
More Related Content
What's hot
Viewers also liked
Similar to COB_20090130_1
More from macavity_d_katt
More from macavity_d_katt (20)
Recently uploaded
Recently uploaded (20)
COB_20090130_1
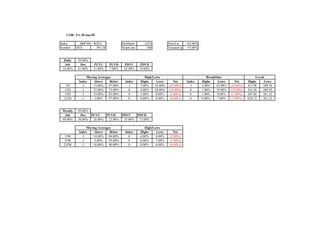
- 1. COB: Fri 30-Jan-09 Index S&P100 - $OEX IdxMatch 2254 PriceUp -63.00% Symbol OEX 391.28 NumCons 100 VolumeUp 47.00% Daily 99.00% Adv Dec PUVU PUVD PDVU PDVD 18.00% 81.00% 11.00% 7.00% 62.00% 19.00% Moving Averages High/Lows BreakOuts Levels Index Above Below Index Highs Lows Net Index Highs Lows Net Highs Lows 3D -1 13.00% 87.00% -1 7.00% 54.00% (47.00%) -1 2.00% 45.00% (43.00%) 413.98 389.54 13D -1 27.00% 73.00% 0 4.00% 20.00% (16.00%) 0 1.00% 19.00% (18.00%) 416.30 380.92 55D -1 19.00% 81.00% 0 1.00% 8.00% (7.00%) 0 1.00% 8.00% (7.00%) 447.86 361.32 233D -1 3.00% 97.00% 0 0.00% 8.00% (8.00%) 0 0.00% 7.00% (7.00%) 658.72 361.32 Weekly 99.00% Adv Dec PUVU PUVD PDVU PDVD 49.00% 50.00% 26.00% 23.00% 35.00% 15.00% Moving Averages High/Lows Index Above Below Index Highs Lows Net 13W -1 14.00% 86.00% 0 6.00% 8.00% (2.00%) 55W -1 5.00% 95.00% 0 0.00% 7.00% (7.00%) 233W -1 10.00% 90.00% 0 0.00% 6.00% (6.00%)
- 2. COB: Fri 30-Jan-09 Index Nasdaq100 - $NDX IdxMatch 2143 PriceUp -64.00% Symbol NDX--X 1180.25 NumCons 100 VolumeUp 36.00% Daily 98.00% Adv Dec PUVU PUVD PDVU PDVD 17.00% 81.00% 14.00% 3.00% 53.00% 28.00% Moving Averages High/Lows BreakOuts Levels Index Above Below Index Highs Lows Net Index Highs Lows Net Highs Lows 3D -1 19.00% 81.00% -1 12.00% 55.00% (43.00%) -1 1.00% 47.00% (46.00%) 1245.98 1176.82 13D -1 30.00% 70.00% 0 6.00% 21.00% (15.00%) 0 1.00% 15.00% (14.00%) 1245.98 1136.61 55D -1 22.00% 78.00% 0 1.00% 2.00% (1.00%) 0 1.00% 0.00% 1.00% 1286.08 1018.86 233D -1 6.00% 94.00% 0 0.00% 2.00% (2.00%) 0 0.00% 0.00% 0.00% 2055.82 1018.86 Weekly 100.00% Adv Dec PUVU PUVD PDVU PDVD 53.00% 47.00% 36.00% 17.00% 33.00% 14.00% Moving Averages High/Lows Index Above Below Index Highs Lows Net 13W -1 19.00% 81.00% 0 7.00% 4.00% 3.00% 55W -1 7.00% 93.00% 0 0.00% 2.00% (2.00%) 233W -1 14.00% 86.00% 0 0.00% 2.00% (2.00%)
- 3. COB: Fri 30-Jan-09 Index S&P500 - $SPX IdxMatch 2770 PriceUp -78.20% Symbol SP-500 825.88 NumCons 500 VolumeUp 38.60% Daily 99.40% Adv Dec PUVU PUVD PDVU PDVD 10.60% 88.80% 7.20% 3.40% 61.80% 27.00% Moving Averages High/Lows BreakOuts Levels Index Above Below Index Highs Lows Net Index Highs Lows Net Highs Lows 3D -1 8.40% 91.60% -1 5.80% 61.40% (55.60%) -1 1.00% 50.00% (49.00%) 877.86 821.67 13D -1 23.60% 76.40% 0 4.00% 21.80% (17.80%) 0 0.40% 16.80% (16.40%) 877.86 804.30 55D -1 21.20% 78.80% 0 0.80% 5.60% (4.80%) 0 0.20% 4.40% (4.20%) 943.85 741.02 233D -1 2.80% 97.20% 0 0.00% 5.00% (5.00%) 0 0.00% 3.60% (3.60%) 1440.24 741.02 Weekly 99.40% Adv Dec PUVU PUVD PDVU PDVD 43.00% 56.40% 27.60% 15.40% 39.40% 17.00% Moving Averages High/Lows Index Above Below Index Highs Lows Net 13W -1 18.20% 81.80% 0 8.20% 7.00% 1.20% 55W -1 2.60% 97.40% 0 0.00% 5.80% (5.80%) 233W -1 6.60% 93.40% 0 0.00% 5.20% (5.20%)
- 4. COB: Fri 30-Jan-09 Index Russell1000 - $RUI IdxMatch 2610 PriceUp -75.64% Symbol RUI-X 447.32 NumCons 977 VolumeUp 31.01% Daily 99.59% Adv Dec PUVU PUVD PDVU PDVD 11.98% 87.62% 7.98% 3.99% 57.32% 30.30% Moving Averages High/Lows BreakOuts Levels Index Above Below Index Highs Lows Net Index Highs Lows Net Highs Lows 3D -1 10.44% 89.56% -1 7.16% 58.34% (51.18%) -1 1.54% 46.57% (45.04%) 475.34 444.97 13D -1 24.46% 75.54% 0 4.09% 20.47% (16.38%) 0 0.41% 15.35% (14.94%) 475.34 435.80 55D -1 21.39% 78.61% 0 1.02% 4.40% (3.38%) 0 0.10% 3.28% (3.17%) 510.35 396.42 233D -1 3.99% 96.01% 0 0.10% 3.89% (3.79%) 0 0.00% 2.66% (2.66%) 788.35 396.42 Weekly 99.28% Adv Dec PUVU PUVD PDVU PDVD 42.37% 57.01% 28.05% 14.23% 36.64% 20.37% Moving Averages High/Lows Index Above Below Index Highs Lows Net 13W -1 18.12% 81.88% 0 6.96% 5.83% 1.13% 55W -1 3.68% 96.32% 0 0.00% 4.91% (4.91%) 233W -1 7.16% 92.84% 0 0.00% 4.61% (4.61%)
- 5. COB: Fri 30-Jan-09 Index Russell2000 - $RUT IdxMatch 2613 PriceUp -56.98% Symbol RUT-X 443.53 NumCons 1920 VolumeUp 19.79% Daily 97.86% Adv Dec PUVU PUVD PDVU PDVD 20.42% 77.45% 13.80% 6.61% 45.00% 32.40% Moving Averages High/Lows BreakOuts Levels Index Above Below Index Highs Lows Net Index Highs Lows Net Highs Lows 3D -1 16.41% 83.59% -1 9.43% 53.13% (43.70%) -1 2.60% 40.52% (37.92%) 474.47 442.43 13D -1 23.33% 76.67% 0 5.16% 19.27% (14.11%) 0 1.35% 13.44% (12.08%) 476.23 431.26 55D -1 19.11% 80.89% 0 1.51% 5.99% (4.48%) 0 0.47% 4.43% (3.96%) 519.00 371.30 233D -1 8.54% 91.46% 0 0.10% 5.00% (4.90%) 0 0.00% 3.70% (3.70%) 764.38 371.30 Weekly 98.91% Adv Dec PUVU PUVD PDVU PDVD 47.08% 51.82% 29.64% 17.45% 31.35% 20.47% Moving Averages High/Lows Index Above Below Index Highs Lows Net 13W -1 17.03% 82.97% 0 5.73% 9.74% (4.01%) 55W -1 7.86% 92.14% 0 0.57% 8.39% (7.81%) 233W -1 10.21% 89.79% 0 0.21% 7.29% (7.08%)
- 6. COB: Fri 30-Jan-09 Index Russell3000 - $RUA IdxMatch 2609 PriceUp -63.34% Symbol RUA-X 476.26 NumCons 2897 VolumeUp 23.51% Daily 98.45% Adv Dec PUVU PUVD PDVU PDVD 17.54% 80.91% 11.81% 5.73% 49.15% 31.72% Moving Averages High/Lows BreakOuts Levels Index Above Below Index Highs Lows Net Index Highs Lows Net Highs Lows 3D -1 14.36% 85.64% -1 8.63% 54.88% (46.25%) -1 2.24% 42.56% (40.32%) 506.35 473.86 13D -1 23.68% 76.32% 0 4.80% 19.68% (14.88%) 0 1.04% 14.08% (13.05%) 506.35 463.98 55D -1 19.88% 80.12% 0 1.35% 5.45% (4.11%) 0 0.35% 4.04% (3.69%) 544.02 420.31 233D -1 6.97% 93.03% 0 0.10% 4.63% (4.52%) 0 0.00% 3.35% (3.35%) 836.41 420.31 Weekly 99.03% Adv Dec PUVU PUVD PDVU PDVD 45.46% 53.61% 29.10% 16.33% 33.14% 20.47% Moving Averages High/Lows Index Above Below Index Highs Lows Net 13W -1 17.40% 82.60% 0 6.14% 8.42% (2.28%) 55W -1 6.42% 93.58% 0 0.38% 7.21% (6.83%) 233W -1 9.15% 90.85% 0 0.14% 6.39% (6.25%)
- 7. COB: Fri 30-Jan-09 Index S&P400 - $MID IdxMatch 2014 PriceUp -79.29% Symbol MID--X 498.68 NumCons 396 VolumeUp 30.30% Daily 99.49% Adv Dec PUVU PUVD PDVU PDVD 10.10% 89.39% 7.58% 2.53% 57.32% 32.07% Moving Averages High/Lows BreakOuts Levels Index Above Below Index Highs Lows Net Index Highs Lows Net Highs Lows 3D -1 10.61% 89.39% -1 7.58% 58.84% (51.26%) -1 1.77% 47.47% (45.71%) 531.67 495.34 13D -1 24.24% 75.76% 0 4.04% 20.20% (16.16%) 0 0.76% 13.89% (13.13%) 531.67 482.96 55D -1 21.46% 78.54% 0 1.26% 5.56% (4.29%) 0 0.25% 4.29% (4.04%) 563.87 406.45 233D -1 7.58% 92.42% 0 0.25% 5.30% (5.05%) 0 0.00% 4.04% (4.04%) 897.37 406.45 Weekly 99.49% Adv Dec PUVU PUVD PDVU PDVD 42.68% 56.82% 29.55% 13.13% 34.09% 22.73% Moving Averages High/Lows Index Above Below Index Highs Lows Net 13W -1 19.44% 80.56% 0 8.33% 7.58% 0.76% 55W -1 7.32% 92.68% 0 0.25% 6.57% (6.31%) 233W -1 9.34% 90.66% 0 0.00% 6.31% (6.31%)
- 8. COB: Fri 30-Jan-09 Index S&P600 - $SML IdxMatch 2734 PriceUp -75.33% Symbol SML--X 234.32 NumCons 600 VolumeUp 27.33% Daily 99.33% Adv Dec PUVU PUVD PDVU PDVD 12.00% 87.33% 9.17% 2.83% 54.17% 33.17% Moving Averages High/Lows BreakOuts Levels Index Above Below Index Highs Lows Net Index Highs Lows Net Highs Lows 3D -1 10.83% 89.17% -1 7.67% 57.67% (50.00%) -1 2.00% 44.17% (42.17%) 251.31 233.44 13D -1 23.17% 76.83% 0 4.67% 19.00% (14.33%) 0 0.83% 13.17% (12.33%) 252.88 228.52 55D -1 19.00% 81.00% 0 1.00% 5.50% (4.50%) 0 0.33% 4.17% (3.83%) 276.80 201.31 233D -1 7.33% 92.67% 0 0.17% 5.00% (4.83%) 0 0.00% 3.67% (3.67%) 402.07 201.31 Weekly 99.50% Adv Dec PUVU PUVD PDVU PDVD 43.00% 56.50% 29.83% 13.17% 32.50% 24.00% Moving Averages High/Lows Index Above Below Index Highs Lows Net 13W -1 17.17% 82.83% 0 6.33% 8.17% (1.83%) 55W -1 7.00% 93.00% 0 0.17% 7.17% (7.00%) 233W -1 9.67% 90.33% 0 0.00% 6.83% (6.83%)