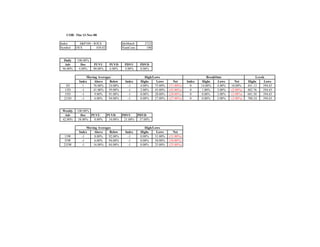
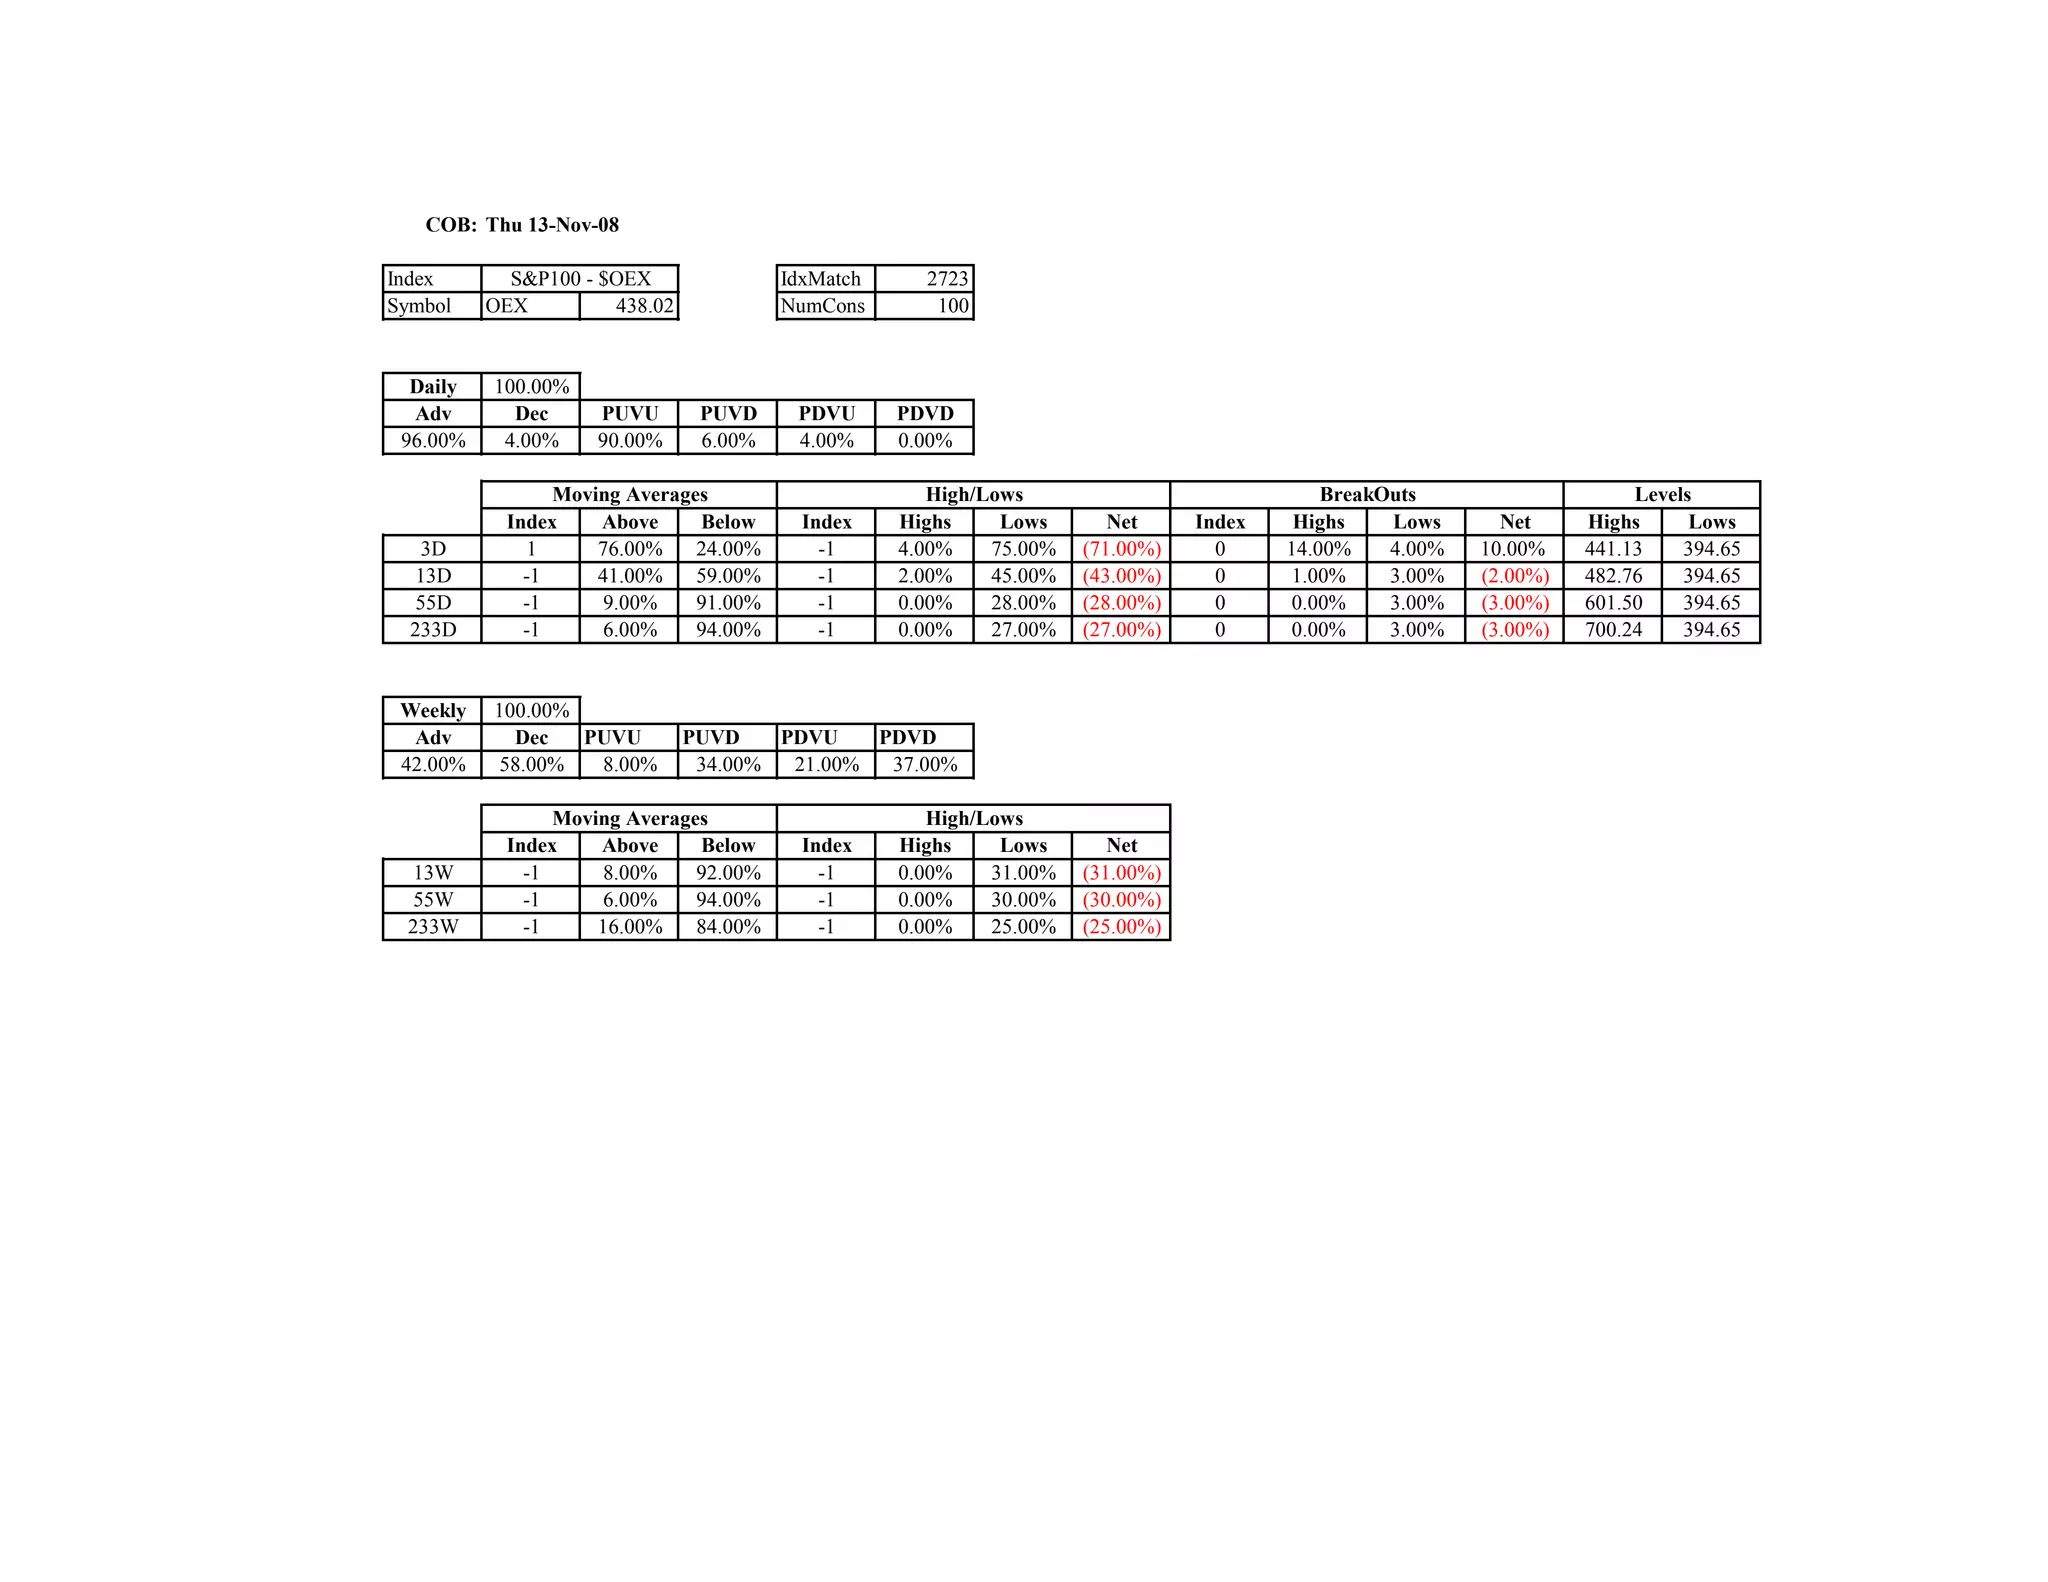
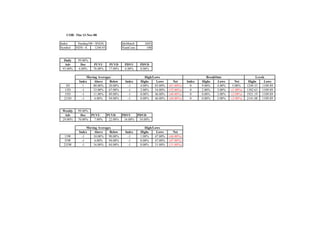
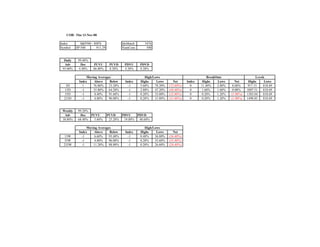


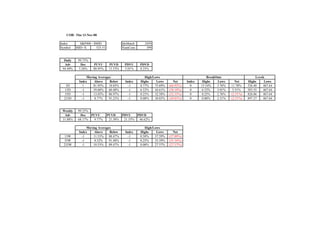

The document provides market index data and statistics for several US stock market indices including the S&P 100, Nasdaq 100, S&P 500, Russell 1000, Russell 2000, and Russell 3000. It includes daily and weekly statistics such as advance/decline percentages and movements relative to moving averages. Most indices saw over 90% of components advance on a daily basis but under 50% on a weekly basis. The majority of components for all indices were trading below their 13-day, 55-day, and 233-day moving averages.


