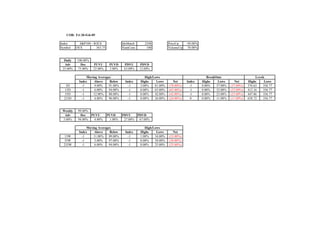


The document provides market index data for several major US stock market indices as of February 20, 2009. It includes daily and weekly statistics on price changes, advancing and declining stocks, moving averages, and high and low prices for the S&P 100, Nasdaq 100, S&P 500, Russell 1000, Russell 2000, and Russell 3000 indices. All indices saw price declines between 17-50% over the period and weak market strength according to other reported metrics.


