
More Related Content
What's hot
Viewers also liked
Similar to Cob 20080929 1
More from macavity_d_katt
More from macavity_d_katt (20)
Recently uploaded
Recently uploaded (20)
Cob 20080929 1
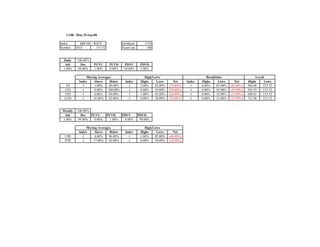
- 1. COB: Mon 29-Sep-08 Index S&P100 - $OEX IdxMatch 2729 Symbol OEX 515.52 NumCons 100 Daily 100.00% Adv Dec PUVU PUVD PDVU PDVD 1.00% 99.00% 1.00% 0.00% 94.00% 5.00% Moving Averages High/Lows BreakOuts Levels Index Above Below Index Highs Lows Net Index Highs Lows Net Highs Lows 3D -1 1.00% 99.00% -1 3.00% 82.00% (79.00%) -1 0.00% 85.00% (85.00%) 566.86 515.52 13D -1 0.00% 100.00% -1 0.00% 59.00% (59.00%) -1 0.00% 45.00% (45.00%) 583.55 515.52 55D -1 6.00% 94.00% -1 1.00% 45.00% (44.00%) -1 0.00% 32.00% (32.00%) 608.81 515.52 233D -1 18.00% 82.00% -1 0.00% 38.00% (38.00%) -1 0.00% 25.00% (25.00%) 725.96 515.52 Weekly 100.00% Adv Dec PUVU PUVD PDVU PDVD 1.00% 99.00% 0.00% 1.00% 0.00% 99.00% Moving Averages High/Lows Index Above Below Index Highs Lows Net 13W -1 4.00% 96.00% -1 1.00% 45.00% (44.00%) 55W -1 17.00% 83.00% -1 0.00% 38.00% (38.00%)
- 2. COB: Mon 29-Sep-08 Index Nasdaq100 - $NDX IdxMatch 2608 Symbol NDX--X 1496.15 NumCons 100 Daily 100.00% Adv Dec PUVU PUVD PDVU PDVD 0.00% 100.00% 0.00% 0.00% 93.00% 7.00% Moving Averages High/Lows BreakOuts Levels Index Above Below Index Highs Lows Net Index Highs Lows Net Highs Lows 3D -1 3.00% 97.00% -1 6.00% 81.00% (75.00%) -1 0.00% 87.00% (87.00%) 1708.44 1496.15 13D -1 5.00% 95.00% -1 3.00% 67.00% (64.00%) -1 0.00% 62.00% (62.00%) 1775.47 1496.15 55D -1 8.00% 92.00% -1 2.00% 52.00% (50.00%) -1 0.00% 42.00% (42.00%) 1973.56 1496.15 233D -1 8.00% 92.00% -1 1.00% 38.00% (37.00%) -1 0.00% 31.00% (31.00%) 2239.23 1496.15 Weekly 100.00% Adv Dec PUVU PUVD PDVU PDVD 0.00% 100.00% 0.00% 0.00% 0.00% 100.00% Moving Averages High/Lows Index Above Below Index Highs Lows Net 13W -1 5.00% 95.00% -1 2.00% 51.00% (49.00%) 55W -1 8.00% 92.00% -1 1.00% 38.00% (37.00%)
- 3. COB: Mon 29-Sep-08 Index S&P500 - $SPX IdxMatch 3486 Symbol SP-500 1106.39 NumCons 500 Daily 99.80% Adv Dec PUVU PUVD PDVU PDVD 0.20% 99.60% 0.20% 0.00% 93.80% 5.80% Moving Averages High/Lows BreakOuts Levels Index Above Below Index Highs Lows Net Index Highs Lows Net Highs Lows 3D -1 0.60% 99.40% -1 3.40% 80.40% (77.00%) -1 0.00% 82.20% (82.20%) 1220.03 1106.39 13D -1 1.20% 98.80% -1 0.40% 57.80% (57.40%) -1 0.00% 46.20% (46.20%) 1265.12 1106.39 55D -1 7.00% 93.00% -1 0.40% 40.60% (40.20%) -1 0.00% 29.40% (29.40%) 1313.15 1106.39 233D -1 11.00% 89.00% -1 0.00% 31.00% (31.00%) -1 0.00% 22.00% (22.00%) 1552.76 1106.39 Weekly 99.80% Adv Dec PUVU PUVD PDVU PDVD 0.20% 99.60% 0.00% 0.20% 0.40% 99.20% Moving Averages High/Lows Index Above Below Index Highs Lows Net 13W -1 5.20% 94.80% -1 0.40% 39.60% (39.20%) 55W -1 10.80% 89.20% -1 0.00% 30.20% (30.20%)
- 4. COB: Mon 29-Sep-08 Index Russell1000 - $RUI IdxMatch 3270 Symbol RUI-X 602.34 NumCons 994 Daily 99.80% Adv Dec PUVU PUVD PDVU PDVD 1.51% 98.29% 1.21% 0.30% 88.03% 10.26% Moving Averages High/Lows BreakOuts Levels Index Above Below Index Highs Lows Net Index Highs Lows Net Highs Lows 3D -1 2.92% 97.08% -1 3.32% 82.49% (79.18%) -1 0.60% 79.78% (79.18%) 664.28 602.34 13D -1 3.02% 96.98% -1 0.91% 58.85% (57.95%) -1 0.10% 46.78% (46.68%) 689.52 602.34 55D -1 8.35% 91.65% -1 0.60% 41.45% (40.85%) -1 0.10% 31.19% (31.09%) 716.82 602.34 233D -1 11.57% 88.43% -1 0.20% 29.28% (29.07%) -1 0.00% 21.13% (21.13%) 845.81 602.34 Weekly 99.80% Adv Dec PUVU PUVD PDVU PDVD 1.51% 98.29% 0.00% 1.51% 0.40% 97.89% Moving Averages High/Lows Index Above Below Index Highs Lows Net 13W -1 6.24% 93.76% -1 0.50% 40.85% (40.34%) 55W -1 10.97% 89.03% -1 0.20% 28.47% (28.27%)
- 5. COB: Mon 29-Sep-08 Index Russell2000 - $RUT IdxMatch 3273 Symbol RUT-X 657.72 NumCons 1961 Daily 99.49% Adv Dec PUVU PUVD PDVU PDVD 5.61% 93.88% 4.13% 1.48% 66.70% 27.18% Moving Averages High/Lows BreakOuts Levels Index Above Below Index Highs Lows Net Index Highs Lows Net Highs Lows 3D -1 6.58% 93.42% -1 7.45% 71.55% (64.10%) -1 1.63% 62.01% (60.38%) 713.00 657.72 13D -1 11.37% 88.63% -1 2.24% 40.39% (38.14%) -1 0.61% 28.05% (27.43%) 761.78 657.72 55D -1 24.32% 75.68% 0 1.22% 20.45% (19.22%) 0 0.15% 14.07% (13.92%) 764.38 647.37 233D -1 26.42% 73.58% 0 0.36% 11.63% (11.27%) 0 0.00% 7.65% (7.65%) 830.39 643.28 Weekly 99.49% Adv Dec PUVU PUVD PDVU PDVD 5.61% 93.88% 0.25% 5.35% 0.36% 93.52% Moving Averages High/Lows Index Above Below Index Highs Lows Net 13W -1 21.77% 78.23% 0 1.17% 19.12% (17.95%) 55W -1 26.01% 73.99% 0 0.36% 11.37% (11.01%)
- 6. COB: Mon 29-Sep-08 Index Russell3000 - $RUA IdxMatch 3269 Symbol RUA-X 646.24 NumCons 2955 Daily 99.59% Adv Dec PUVU PUVD PDVU PDVD 4.23% 95.36% 3.15% 1.08% 73.87% 21.49% Moving Averages High/Lows BreakOuts Levels Index Above Below Index Highs Lows Net Index Highs Lows Net Highs Lows 3D -1 5.35% 94.65% -1 6.06% 75.23% (69.17%) -1 1.29% 67.95% (66.67%) 711.59 646.24 13D -1 8.56% 91.44% -1 1.79% 46.60% (44.81%) -1 0.44% 34.35% (33.91%) 739.80 646.24 55D -1 18.92% 81.08% -1 1.02% 27.55% (26.53%) -1 0.14% 19.83% (19.70%) 766.82 646.24 233D -1 21.39% 78.61% -1 0.30% 17.60% (17.29%) -1 0.00% 12.18% (12.18%) 899.86 646.24 Weekly 99.59% Adv Dec PUVU PUVD PDVU PDVD 4.23% 95.36% 0.17% 4.06% 0.37% 94.99% Moving Averages High/Lows Index Above Below Index Highs Lows Net 13W -1 16.55% 83.45% -1 0.95% 26.46% (25.52%) 55W -1 20.91% 79.09% -1 0.30% 17.16% (16.85%)
- 7. COB: Mon 29-Sep-08 Index S&P400 - $MID IdxMatch 2465 Symbol MID--X 698.21 NumCons 399 Daily 99.75% Adv Dec PUVU PUVD PDVU PDVD 2.01% 97.74% 1.50% 0.50% 82.71% 15.04% Moving Averages High/Lows BreakOuts Levels Index Above Below Index Highs Lows Net Index Highs Lows Net Highs Lows 3D -1 4.26% 95.74% -1 4.76% 81.95% (77.19%) -1 0.75% 73.68% (72.93%) 762.59 694.10 13D -1 5.51% 94.49% -1 1.25% 54.64% (53.38%) -1 0.00% 42.61% (42.61%) 809.79 694.10 55D -1 13.03% 86.97% -1 0.75% 31.58% (30.83%) -1 0.00% 24.56% (24.56%) 828.09 694.10 233D -1 17.54% 82.46% -1 0.25% 19.55% (19.30%) -1 0.00% 14.79% (14.79%) 908.85 694.10 Weekly 99.75% Adv Dec PUVU PUVD PDVU PDVD 2.01% 97.74% 0.00% 2.01% 0.50% 97.24% Moving Averages High/Lows Index Above Below Index Highs Lows Net 13W -1 9.77% 90.23% -1 0.75% 30.83% (30.08%) 55W -1 16.54% 83.46% -1 0.25% 18.80% (18.55%)
- 8. COB: Mon 29-Sep-08 Index S&P600 - $SML IdxMatch 3448 Symbol SML--X 351.66 NumCons 600 Daily 99.50% Adv Dec PUVU PUVD PDVU PDVD 5.17% 94.33% 3.50% 1.67% 65.17% 29.17% Moving Averages High/Lows BreakOuts Levels Index Above Below Index Highs Lows Net Index Highs Lows Net Highs Lows 3D -1 6.67% 93.33% -1 5.17% 75.17% (70.00%) -1 1.00% 58.33% (57.33%) 376.52 350.70 13D -1 10.33% 89.67% -1 0.83% 42.67% (41.83%) -1 0.33% 27.50% (27.17%) 401.27 350.70 55D -1 26.17% 73.83% 0 0.50% 21.00% (20.50%) 0 0.17% 12.83% (12.67%) 401.27 340.14 233D -1 27.67% 72.33% 0 0.00% 11.67% (11.67%) 0 0.00% 7.00% (7.00%) 432.30 339.99 Weekly 99.50% Adv Dec PUVU PUVD PDVU PDVD 5.17% 94.33% 0.17% 5.00% 0.17% 94.17% Moving Averages High/Lows Index Above Below Index Highs Lows Net 13W -1 23.50% 76.50% 0 0.50% 20.17% (19.67%) 55W -1 27.83% 72.17% 0 0.00% 11.50% (11.50%)