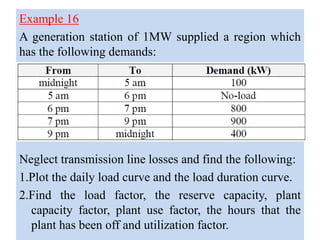
The region has the following demands:
Domestic: 0.5MW from 6am to 12pm and 6pm to 12am.
Commercial: 0.2MW from 8am to 8pm.
Industrial: 0.3MW continuously.
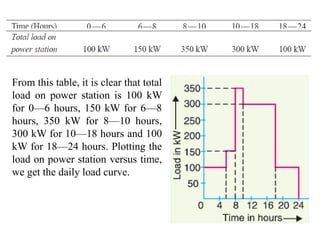
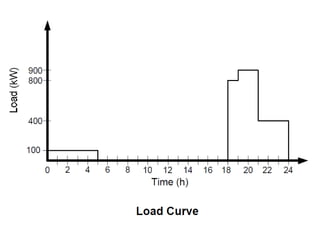
To plot the daily load curve:
6am-12pm: 0.5+0.2+0.3 = 1MW
12pm-8pm: 0.2+0.3 = 0.5MW
8pm-12am: 0.5+0.3 = 0.8MW
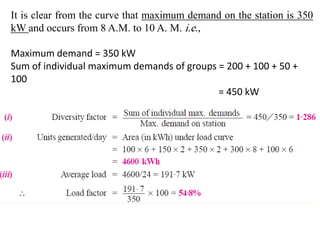
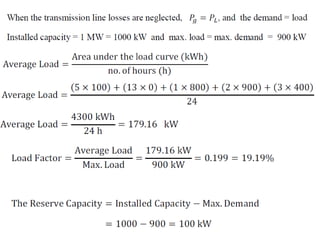
Maximum demand = 1MW
Average load = (1MW for 6hrs + 0.5MW for 8h
As the fifth in a series of tutorials on the power system, Leonardo ENERGY introduces its minute lecture on voltage and frequency control, using the analogy of a metal/rubber plate to demonstrate the centralised nature of frequency control, whereas voltage control is more a local matter.
Wind Power History
Advantages & Disadvantages
Wind Turbine & Components
Power From Wind Mill
Swept area Of Wind Mill Rotor
Wind Speed Variation with Height
Density & Temperature Variation with Height
Global Wind Patterns
Wind Speed Measurements
Wind Speed Distribution
Weibull Probability Distributions
ELECTRICAL POWER GENERATION BY HYBRID RENEWABLE ENERGY SOURCE (SOLAR, WIND &...AMOGHA A K
Non-renewable energy resources are highly exploited which has led to environmental degradation.
In order to save our ‘Earth planet’, the solar, wind & hydro renewable energy resources are freely & abundantly available which are eco-friendly and cost- effective . Hence, it can be extensively utilized.
These slides present about islanding detection techniques in microgrid systems. Later on the classes other aspects of microgrid protection will be discussed in more detail
This Slides will help you to know the- what is the economics of power generation and how it is generated. The basic terminology used in power generation like demand factor, peak load, load curve, load factor, diversity factor, and at last you will also find out the methods used for calculating the Depreciation of materials.
The function of a power station is to de-
liver power to a large number of consum
ers. However, the power demands of dif-
ferent consumers vary in accordance with their
activities. The result of this variation in demand
is that load on a power station is never constant,
rather it varies from time to time. Most of the
complexities of modern power plant operation
arise from the inherent variability of the load de-
manded by the users. Unfortunately, electrical
power cannot be stored and, therefore, the power
station must produce power as and when de-
manded to meet the requirements of the consum-
ers. On one hand, the power engineer would like
that the alternators in the power station should
run at their rated capacity for maximum efficiency
and on the other hand, the demands of the con-
sumers have wide variations. This makes the
design of a power station highly complex. In this
chapter, we shall focus our attention on the prob-
lems of variable load on power stations.
Hierarchical Digital Twin of a Naval Power SystemKerry Sado
A hierarchical digital twin of a Naval DC power system has been developed and experimentally verified. Similar to other state-of-the-art digital twins, this technology creates a digital replica of the physical system executed in real-time or faster, which can modify hardware controls. However, its advantage stems from distributing computational efforts by utilizing a hierarchical structure composed of lower-level digital twin blocks and a higher-level system digital twin. Each digital twin block is associated with a physical subsystem of the hardware and communicates with a singular system digital twin, which creates a system-level response. By extracting information from each level of the hierarchy, power system controls of the hardware were reconfigured autonomously. This hierarchical digital twin development offers several advantages over other digital twins, particularly in the field of naval power systems. The hierarchical structure allows for greater computational efficiency and scalability while the ability to autonomously reconfigure hardware controls offers increased flexibility and responsiveness. The hierarchical decomposition and models utilized were well aligned with the physical twin, as indicated by the maximum deviations between the developed digital twin hierarchy and the hardware.
Immunizing Image Classifiers Against Localized Adversary Attacksgerogepatton
This paper addresses the vulnerability of deep learning models, particularly convolutional neural networks
(CNN)s, to adversarial attacks and presents a proactive training technique designed to counter them. We
introduce a novel volumization algorithm, which transforms 2D images into 3D volumetric representations.
When combined with 3D convolution and deep curriculum learning optimization (CLO), itsignificantly improves
the immunity of models against localized universal attacks by up to 40%. We evaluate our proposed approach
using contemporary CNN architectures and the modified Canadian Institute for Advanced Research (CIFAR-10
and CIFAR-100) and ImageNet Large Scale Visual Recognition Challenge (ILSVRC12) datasets, showcasing
accuracy improvements over previous techniques. The results indicate that the combination of the volumetric
input and curriculum learning holds significant promise for mitigating adversarial attacks without necessitating
adversary training.
Hybrid optimization of pumped hydro system and solar- Engr. Abdul-Azeez.pdffxintegritypublishin
Advancements in technology unveil a myriad of electrical and electronic breakthroughs geared towards efficiently harnessing limited resources to meet human energy demands. The optimization of hybrid solar PV panels and pumped hydro energy supply systems plays a pivotal role in utilizing natural resources effectively. This initiative not only benefits humanity but also fosters environmental sustainability. The study investigated the design optimization of these hybrid systems, focusing on understanding solar radiation patterns, identifying geographical influences on solar radiation, formulating a mathematical model for system optimization, and determining the optimal configuration of PV panels and pumped hydro storage. Through a comparative analysis approach and eight weeks of data collection, the study addressed key research questions related to solar radiation patterns and optimal system design. The findings highlighted regions with heightened solar radiation levels, showcasing substantial potential for power generation and emphasizing the system's efficiency. Optimizing system design significantly boosted power generation, promoted renewable energy utilization, and enhanced energy storage capacity. The study underscored the benefits of optimizing hybrid solar PV panels and pumped hydro energy supply systems for sustainable energy usage. Optimizing the design of solar PV panels and pumped hydro energy supply systems as examined across diverse climatic conditions in a developing country, not only enhances power generation but also improves the integration of renewable energy sources and boosts energy storage capacities, particularly beneficial for less economically prosperous regions. Additionally, the study provides valuable insights for advancing energy research in economically viable areas. Recommendations included conducting site-specific assessments, utilizing advanced modeling tools, implementing regular maintenance protocols, and enhancing communication among system components.
Water scarcity is the lack of fresh water resources to meet the standard water demand. There are two type of water scarcity. One is physical. The other is economic water scarcity.
Final project report on grocery store management system..pdfKamal Acharya
In today’s fast-changing business environment, it’s extremely important to be able to respond to client needs in the most effective and timely manner. If your customers wish to see your business online and have instant access to your products or services.
Online Grocery Store is an e-commerce website, which retails various grocery products. This project allows viewing various products available enables registered users to purchase desired products instantly using Paytm, UPI payment processor (Instant Pay) and also can place order by using Cash on Delivery (Pay Later) option. This project provides an easy access to Administrators and Managers to view orders placed using Pay Later and Instant Pay options.
In order to develop an e-commerce website, a number of Technologies must be studied and understood. These include multi-tiered architecture, server and client-side scripting techniques, implementation technologies, programming language (such as PHP, HTML, CSS, JavaScript) and MySQL relational databases. This is a project with the objective to develop a basic website where a consumer is provided with a shopping cart website and also to know about the technologies used to develop such a website.
This document will discuss each of the underlying technologies to create and implement an e- commerce website.
Cosmetic shop management system project report.pdfKamal Acharya
Buying new cosmetic products is difficult. It can even be scary for those who have sensitive skin and are prone to skin trouble. The information needed to alleviate this problem is on the back of each product, but it's thought to interpret those ingredient lists unless you have a background in chemistry.
Instead of buying and hoping for the best, we can use data science to help us predict which products may be good fits for us. It includes various function programs to do the above mentioned tasks.
Data file handling has been effectively used in the program.
The automated cosmetic shop management system should deal with the automation of general workflow and administration process of the shop. The main processes of the system focus on customer's request where the system is able to search the most appropriate products and deliver it to the customers. It should help the employees to quickly identify the list of cosmetic product that have reached the minimum quantity and also keep a track of expired date for each cosmetic product. It should help the employees to find the rack number in which the product is placed.It is also Faster and more efficient way.
Saudi Arabia stands as a titan in the global energy landscape, renowned for its abundant oil and gas resources. It's the largest exporter of petroleum and holds some of the world's most significant reserves. Let's delve into the top 10 oil and gas projects shaping Saudi Arabia's energy future in 2024.
1. Energy Management
Storage and renewable energy
Technical and economical advantages of energy storage
Energy storage systems
Pumped hydro storage (PHS)
Thermal energy storage (TES)
Compressed air energy storage (CAES)
Small-scale compressed air energy storage (SSCAES)
Energy storage coupled with natural gas storage (NGS)
Energy storage using flow batteries (FBES)
Fuel cells—Hydrogen energy storage (FC–HES)
Chemical storage
Flywheel energy storage (FES)
Superconducting magnetic energy storage (SMES)
Energy storage in supercapacitors
Characteristics of energy storage techniques
Comparison of the different storage techniques
2. Introduction
The function of a power station is to deliver
power to a large number of consumers. However,
the power demands of different consumers vary
in accordance with their activities. The result of
this variation in demand is that load on a power
station is never constant, rather it varies from
time to time. Most of the complexities of modern
power plant operation arise from the inherent
variability of the load demanded by the users.
3. The objective of energy storage is to meet the
fluctuations in electricity demand and assured a
steady supply economically. When the demand is
lower than capacity, excess energy is stored.
When demand is higher than capacity, the stored
energy is released. Fluctuating electricity
demand can be met reliably, efficiently and
economically. Energy storage density is an
important parameter. It is expressed in energy
per unit volume (kJ /m3) .
4. The load on a power station varies from time to time due
to uncertain demands of the consumers and is known as
variable load on the station.
An ideal load on the station would be one of constant
magnitude and steady duration. However, such a steady
load on the station is never realised in actual practice.
The consumers require their small or large block of
power in accordance with the demands of their activities.
The result is that load on the power station varies from
time to time.
Effects of variable load. The variable load on a power
station introduces many perplexities in its operation.
Some of the important effects of variable load on a
power station are :
Variable Load on Power Station
5. (i) Need of additional equipment. The variable load on
a power station necessitates to have additional
equipment. By way of illustration, consider a steam
power station. Air, coal and water are the raw
materials for this plant. In order to produce variable
power, the supply of these materials will be required
to be varied correspondingly.
(ii) Increase in production cost. The variable load on the
plant increases the cost of the production of electrical
energy. An alternator operates at maximum efficiency
near its rated capacity. If a single alternator is used, it
will have poor efficiency during periods of light loads
on the plant. Therefore, in actual practice, a number
of alternators of different capacities are installed so
that most of the alternators can be operated at nearly
full load capacity. However, the use of a number of
generating units increases the initial cost per kW of
the plant capacity as well as floor area required. This
leads to the increase in production cost of energy.
6. Load Curves
The curve showing the variation of load on the power
station with respect to (w.r.t) time is known as a load
curve.
The load on a power station varies. These load
variations during the whole day are recorded half-
hourly or hourly and are plotted against time on the
graph. The curve thus obtained is known as daily load
curve as it shows the variations of load w.r.t. time
during the day. Fig. 1.1. shows a typical daily load curve
of a power station. It is clear that load on the power
station is maximum at 6 P.M. in this case. It may be
seen that load curve indicates at a glance the general
character of the load that is being imposed on the
plant.
9. The monthly load curve can be obtained from the daily
load curves of that month. For this purpose, average*
values of power over a month at different times of the
day are calculated and then plotted on the graph. The
monthly load curve is generally used to fix the rates of
energy. The yearly load curve is obtained by considering
the monthly load curves of that particular year. The
yearly load curve is generally used to determine the
annual load factor.
10. The daily load curves have attained a great importance in
generation as they supply the following information readily :
(i) The daily load curve shows the variations of load on the
power station during different hours of the day.
(ii) The area under the daily load curve gives the number of
units generated in the day.
Units generated/day = Area (in kWh) under daily load curve.
(iii) The highest point on the daily load curve represents the
maximum demand on the station on that day.
(iv) The area under the daily load curve divided by the total
number of hours gives the average load on the station in the
day.
(v) The ratio of the area under the load curve to the total area
of rectangle in which it is contained gives the load factor.
11. (vi) The load curve helps in selecting the size and
number of generating units.
(vii) The load curve helps in preparing the
operation schedule of the station.
12. Important Terms and Factors
Connected load: It is the sum of the rating of all
connected equipment supplied by the power plant.
Maximum demand: It is the greatest load demand on
the power plant during a given period. (The station
should be capable of meeting this maximum
demand). The knowledge of maximum demand is
very important as it helps in determining the installed
capacity of the station. The station must be capable of
meeting the maximum demand.
Demand factor: It is the ratio of maximum demand to
the connected load.
13. Average load: The average of loads occurring on
the power station in a given period (day or month
or year) is known as average load or average
demand.
Load factor: The ratio of average load to the
maximum demand during a given period is known
as load factor i.e.,
14. The load factor may be daily load factor, monthly load
factor or annual load factor if the time period considered
is a day or month or year. Load factor is always less
than 1 because average load is smaller than the
maximum demand. The load factor plays key role in
determining the overall cost per unit generated. Higher
the load factor of the power station, lesser will be the
cost per unit generated.
15. Both consumers use same maximum demand and
accordingly require same investment in capacity, but
each have different manner in using this capacity,
indicated by their load factors.
16. Plant capacity factor: It is the ratio of actual
energy produced to the maximum possible
energy that could have been produced during a
given period i.e.,
Thus if the considered period is one year,
17. The plant capacity factor is an indication of the reserve
capacity of the plant. A power station is so designed that
it has some reserve capacity for meeting the increased
load demand in future. Therefore, the installed capacity
of the plant is always somewhat greater than the
maximum demand on the plant.
Reserve capacity = Plant capacity − Max. demand
It is interesting to note that difference between load
factor and plant capacity factor is an indication of
reserve capacity. If the maximum demand on the plant is
equal to the plant capacity, then load factor and plant
capacity factor will have the same value. In such a case,
the plant will have no reserve capacity.
18. Plant use factor: It is ratio of kWh generated to
the product of plant capacity and the number
of hours for which the plant was in operation
i.e.
Suppose a plant having installed capacity of 20
MW produces annual output of 7·35 × 106 kWh
and remains in operation for 2190 hours in a
year. Then,
19. Units Generated per Annum: It is often
required to find the kWh generated per annum
from maximum demand and load factor. The
procedure is as follows :
Diversity factor: The ratio of the sum of
individual maximum demands to the
maximum demand on power station is known
as diversity factor i.e.,
20. A power station supplies load to various types of
consumers whose maximum demands generally do not
occur at the same time. Therefore, the maximum demand
on the power station is always less than the sum of
individual maximum demands of the consumers.
Obviously, diversity factor will always be greater than 1.
The greater the diversity factor, the lesser is the cost of
generation of power.
21. Note that the maximum
diversified demand is less
than the sum of the
Individual maximum
demands
Diversity factor ≈ 25/16 =
1.56
23. Load Duration Curve
When the load elements of a load curve are
arranged in the order of descending magnitudes,
the curve thus obtained is called a load duration
curve. The area under both curves are equal.
24. The following points may be noted about load
duration curve :
(i) The load duration curve gives the data in a
more presentable form. In other words, it readily
shows the number of hours during which the
given load has prevailed.
(ii) The area under the load duration curve is
equal to that of the corresponding load curve.
Obviously, area under daily load duration curve
(in kWh) will give the units generated on that day.
(iii) The load duration curve can be extended to
include any period of time. By laying out the
abscissa from 0 hour to 8760 hours, the variation
and distribution of demand for an entire year can
be summarised in one curve. The curve thus
obtained is called the annual load duration curve.
27. Examples
Example 1: The maximum demand on a power
station is 100 MW. If the annual load factor is
40% , calculate the total energy generated in a
year.
28. Example 2: A generating station has a connected
load of 43MW and a maximum demand of 20 MW;
the units generated being 61·5 × 106 per annum.
Calculate (i) the demand factor and (ii) load factor.
29. Example 3: A 100 MW power station delivers 100 MW
for 2 hours, 50 MW for 6 hours and is shut down for the
rest of each day. It is also shut down for maintenance
for 45 days each year. Calculate its annual load factor.
30. Example 4: A generating station has a maximum
demand of 25MW, a load factor of 60%, a plant
capacity factor of 50% and a plant use factor of 72%.
Find (i) the reserve capacity of the plant (ii) the daily
energy produced and (iii) maximum energy that could
be produced daily if the plant while running as per
schedule, were fully loaded.
31.
32. Example 5: A diesel station supplies the following loads
to various consumers : Industrial consumer = 1500 kW ;
Commercial establishment = 750 kW Domestic power =
100 kW; Domestic light = 450 kW If the maximum
demand on the station is 2500 kW and the number of
kWh generated per year is 45×105, determine (i) the
diversity factor and (ii) annual load factor.
33. Example 6: A power station has a maximum demand of
15000 kW. The annual load factor is 50% and plant
capacity factor is 40%. Determine the reserve capacity
of the plant.
34. Example 7: A power supply is having the following loads :
Type of load Max. demand (kW) Diversity of group Demand factor
Domestic 1500 1·2 0·8
Commercial 2000 1·1 0·9
Industrial 10,000 1·25 1
If the overall system diversity factor is 1·35, determine (i) the
maximum demand and (ii) connected load of each.
35. Example 8: It has been desired to install a diesel power station to
supply power in a suburban area having the following particulars :
(i) 1000 houses with average connected load of 1·5 kW in each
house. The demand factor and diversity factor being 0·4 and 2·5
respectively.
(ii) 10 factories having overall maximum demand of 90 kW.
(iii) 7 tubewells of 7 kW each and operating together in the
morning. The diversity factor among above three types of
consumers is 1·2. What should be the minimum capacity of power
station ?
36. Example 9: A generating station has the following daily load cycle :
Time (Hours) 0—6 6—10 10—12 12—16 16—20 20—24
Load (MW) 40 50 60 50 70 40
Draw the load curve and find (i) maximum demand (ii) units
generated per day (iii) average load and (iv) load factor.
37.
38. Example 10: A power station has to meet the following demand :
Group A : 200 kW between 8 A.M. and 6 P.M.
Group B : 100 kW between 6 A.M. and 10 A.M.
Group C : 50 kW between 6 A.M. and 10 A.M.
Group D : 100 kW between 10 A.M. and 6 P.M. and then between 6
P.M. and 6 A.M.
Plot the daily load curve and determine (i) diversity factor (ii) units
generated per day (iii) load factor.
39. From this table, it is clear that total
load on power station is 100 kW
for 0—6 hours, 150 kW for 6—8
hours, 350 kW for 8—10 hours,
300 kW for 10—18 hours and 100
kW for 18—24 hours. Plotting the
load on power station versus time,
we get the daily load curve.
40. It is clear from the curve that maximum demand on the station is 350
kW and occurs from 8 A.M. to 10 A. M. i.e.,
Maximum demand = 350 kW
Sum of individual maximum demands of groups = 200 + 100 + 50 +
100
= 450 kW
41. Example 11:The daily demands of three consumers are given below:
Time Consumer 1 Consumer 2 Consumer 3
12 midnight to 8 A.M. No load 200 W No load
8 A.M. to 2 P.M. 600 W No load 200 W
2 P.M. to 4 P.M. 200 W 1000 W 1200 W
4 P.M. to 10 P.M. 800 W No load No load
10 P.M. to midnight No load 200 W 200 W
Plot the load curve and find (i) maximum demand of individual
consumer (ii) load factor of individual consumer (iii) diversity factor
and (iv) load factor of the station.
42.
43.
44. Example 12: A daily load curve which exhibited a 15-minute peak of
3000 kW is drawn to scale of 1 cm = 2 hours and 1 cm = 1000 kW.
The total area under the load curve is measured by planimeter and
is found to be 12 cm2. Calculate the load factor based on 15-min.
peak.
45. Example 13: A power station has a daily load cycle as following:
260 MW for 6 hours ; 200 MW for 8 hours : 160 MW for 4 hours,
100 MW for 6 hours. If the power station is equipped with 4 sets of
75 MW each, calculate (i) daily load factor (ii) plant capacity factor
and (iii) daily requirement if the calorific value of oil used were
10,000 kcal/kg and the average heat rate of station were 2860
kcal/kWh.
46. Example 14: A power station has the following daily load cycle :
Time in Hours 6—8 8—12 12—16 16—20 20—24 24—6
Load in MW 20 40 60 20 50 20
Plot the load curve and load duration curve. Also calculate the energy
generated per day.
47.
48. Example 15: The annual load duration curve of a certain power
station can be considered as a straight line from 20 MW to 4 MW. To
meet this load, three turbine-generator units, two rated at 10 MW
each and one rated at 5 MW are installed. Determine (i) installed
capacity (ii) plant factor (iii) units generated per annum (iv) load factor
and (v) utilisation factor.
This Figure shows the annual load duration curve of the power
station.
49.
50. Example 16
A generation station of 1MW supplied a region which
has the following demands:
Neglect transmission line losses and find the following:
1.Plot the daily load curve and the load duration curve.
2.Find the load factor, the reserve capacity, plant
capacity factor, plant use factor, the hours that the
plant has been off and utilization factor.