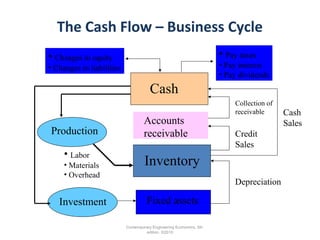
4. Cash Flows Statement
 The business operating cycle: How a
business earns its cash
 Sources and Uses of Cash
 The engineer’s focus on the investing
section: Capital Budgeting
Contemporary Engineering Economics, 5th edition.
©2010
Cash Flow Transactions within Business
Contemporary Engineering Economics, 5th
edition. ©2010
Shareholders
Fixed Assets
Debt holders
Inventory
Government
Customers
CASH
From cash sales
To pay taxes
From credit
sales
To pay labor,
materials, and
overhead
To pay interest
and principal
From sale
of debt
To purchase
From sale
To pay dividend,
To purchase back
shares
From sale
of shares
Cash Flow Statement
Contemporary Engineering
Economics, 5th edition. ©2010
Cash flow statement describes the cash inflows and
outflows of an enterprise during a period.
This statement reports cash inflows and outflows
based on the firm’s operating activities, investing
activities, and financing activities.
Change in cash = Cash from operations + Cash from
investment + Cash from financing
Cash Flow from Operating Activities
Cash Inflow
From sales of goods or
services
From interest and dividend
income
From sales of goods or
services
From interest and dividend
income
Cash Outflow
To pay suppliers for inventory
To pay employees for services
To pay lenders (interest)
To pay government for taxes
To pay other suppliers for
other operating expenses
To pay suppliers for inventory
To pay employees for services
To pay lenders (interest)
To pay government for taxes
To pay other suppliers for
other operating expenses
Contemporary Engineering
Economics, 5th edition. ©2010
•It shows impact of transactions not defined as investing or financing
activities.
•These cash flows are generally the cash effects that enter into the
determination of net income.
Importance of Cash Flow from Operating
Activities
It would seem more logical to
classify interest and dividend
income as an “investing”
inflow, while interest paid
certainly looks like a
“financing” outflow. But the
SSAP (Statement of Standard
Accounting Practices) and FRS
(Financial Reporting Standard)
classified these items as
operating flows.
 In the long run, a business must
generate a positive net cash flow
from its operating activities if the
business is to survive. A business
with negative cash flows from
operations will not be able to raise
cash from other sources
indefinitely.
 In fact, the ability of a business to
raise cash through financing
activities is highly dependent upon
its ability to generate cash from its
normal business operations.
Creditors and stockholders are
reluctant to invest money in a
company that does not generate
enough cash from operating
activities to assure prompt payment
of maturing liabilities, interest and
dividends.
Contemporary Engineering
Economics, 5th edition. ©2010
Cash Flow from Investment Activities
Cash Inflow
From sale of fixed assets
(property, plant and
equipment)
From sale of debt or equity
securities (other than
common equity) of other
entities
From sale of fixed assets
(property, plant and
equipment)
From sale of debt or equity
securities (other than
common equity) of other
entities
Cash Outflow
To acquire fixed assets
(property, plant and
equipment)
To purchase debt or equity
securities (other than
common equity) of other
entities
To acquire fixed assets
(property, plant and
equipment)
To purchase debt or equity
securities (other than
common equity) of other
entities
Contemporary Engineering
Economics, 5th edition. ©2010
It shows impact of buying and selling fixed assets
and debt or equity securities of other entities.
Cash Flow from Financing Activities
Cash Inflow
From borrowing (Short-term
and long-term)
From sale of firm’s own
equity securities (i.e. by
issuing stock)
Cash Outflow
To repay amounts borrowed
To repurchase firm’s own
equity securities
To pay shareholders’
dividends
Contemporary Engineering
Economics, 5th edition. ©2010
It shows impact of all cash transactions with
shareholders and the borrowing and repaying
transactions with lenders
Contemporary Engineering Economics, 5th
edition. ©2010
The Cash Flow – Business Cycle
Inventory
Production
Cash
Accounts
receivable
Fixed assets
Cash
Sales
Credit
Sales
Collection of
receivable
Investment
Depreciation
• Changes in equity
• Changes in liabilities
• Pay taxes
• Pay interest
• Pay dividends
• Labor
• Materials
• Overhead
The Cash Flow Statement of SABIC – Illustration
Contemporary Engineering
Economics, 5th edition. ©2010
Period End Date 12/31/2011 12/31/2010
CASH FROM OPERATING ACTIVITIES
+ Net Income 29,241.75 21,528.67
+ Depreciation & Amortization (writing off an intangible asset
investment)
11,815.33 10,609.85
+ Other Non-Cash Adjustments 17,070.40 11,169.38
+ Changes in Non-Cash Capital -15,983.02 -13,682.96
Cash From Operations 42,144.46 29,624.94
CASH FROM INVESTING ACTIVITIES
+ Disposal of Fixed Assets 0.00 0.00
+ Capital Expenditures (Physical assets) -10,641.97 -16,100.22
+ Increase in Investments 0.00 0.00
+ Decrease in Investments 5.14 24.56
+ Other Investing Activities -1,613.34 -3,986.87
Cash From Investing Activities -12,250.17 -20,062.54
CASH FROM FINANCING ACTIVITIES
+ Dividends Paid -11,831.28 -8,961.98
+ Change in Short-Term Borrowings 212.92 180.73
+ Increase in Long-Term Borrowings 0.00 3,406.67
+ Decrease in Long-term Borrowings -8,310.21 0.00
+ Increase in Capital Stocks (Preferred & Common) 0.00 0.00
+ Decrease in Capital Stocks (Preferred & Common) 0.00 0.00
+ Other Financing Activities -10,224.74 -10,736.63
Cash from Financing Activities -30,153.31 -16,111.20
Net Changes in Cash -259.02 -6,548.80

Cash flow statement

  • 1.
    4. Cash FlowsStatement  The business operating cycle: How a business earns its cash  Sources and Uses of Cash  The engineer’s focus on the investing section: Capital Budgeting Contemporary Engineering Economics, 5th edition. ©2010
  • 2.
    Cash Flow Transactionswithin Business Contemporary Engineering Economics, 5th edition. ©2010 Shareholders Fixed Assets Debt holders Inventory Government Customers CASH From cash sales To pay taxes From credit sales To pay labor, materials, and overhead To pay interest and principal From sale of debt To purchase From sale To pay dividend, To purchase back shares From sale of shares
  • 3.
    Cash Flow Statement ContemporaryEngineering Economics, 5th edition. ©2010 Cash flow statement describes the cash inflows and outflows of an enterprise during a period. This statement reports cash inflows and outflows based on the firm’s operating activities, investing activities, and financing activities. Change in cash = Cash from operations + Cash from investment + Cash from financing
  • 4.
    Cash Flow fromOperating Activities Cash Inflow From sales of goods or services From interest and dividend income From sales of goods or services From interest and dividend income Cash Outflow To pay suppliers for inventory To pay employees for services To pay lenders (interest) To pay government for taxes To pay other suppliers for other operating expenses To pay suppliers for inventory To pay employees for services To pay lenders (interest) To pay government for taxes To pay other suppliers for other operating expenses Contemporary Engineering Economics, 5th edition. ©2010 •It shows impact of transactions not defined as investing or financing activities. •These cash flows are generally the cash effects that enter into the determination of net income.
  • 5.
    Importance of CashFlow from Operating Activities It would seem more logical to classify interest and dividend income as an “investing” inflow, while interest paid certainly looks like a “financing” outflow. But the SSAP (Statement of Standard Accounting Practices) and FRS (Financial Reporting Standard) classified these items as operating flows.  In the long run, a business must generate a positive net cash flow from its operating activities if the business is to survive. A business with negative cash flows from operations will not be able to raise cash from other sources indefinitely.  In fact, the ability of a business to raise cash through financing activities is highly dependent upon its ability to generate cash from its normal business operations. Creditors and stockholders are reluctant to invest money in a company that does not generate enough cash from operating activities to assure prompt payment of maturing liabilities, interest and dividends. Contemporary Engineering Economics, 5th edition. ©2010
  • 6.
    Cash Flow fromInvestment Activities Cash Inflow From sale of fixed assets (property, plant and equipment) From sale of debt or equity securities (other than common equity) of other entities From sale of fixed assets (property, plant and equipment) From sale of debt or equity securities (other than common equity) of other entities Cash Outflow To acquire fixed assets (property, plant and equipment) To purchase debt or equity securities (other than common equity) of other entities To acquire fixed assets (property, plant and equipment) To purchase debt or equity securities (other than common equity) of other entities Contemporary Engineering Economics, 5th edition. ©2010 It shows impact of buying and selling fixed assets and debt or equity securities of other entities.
  • 7.
    Cash Flow fromFinancing Activities Cash Inflow From borrowing (Short-term and long-term) From sale of firm’s own equity securities (i.e. by issuing stock) Cash Outflow To repay amounts borrowed To repurchase firm’s own equity securities To pay shareholders’ dividends Contemporary Engineering Economics, 5th edition. ©2010 It shows impact of all cash transactions with shareholders and the borrowing and repaying transactions with lenders
  • 8.
    Contemporary Engineering Economics,5th edition. ©2010 The Cash Flow – Business Cycle Inventory Production Cash Accounts receivable Fixed assets Cash Sales Credit Sales Collection of receivable Investment Depreciation • Changes in equity • Changes in liabilities • Pay taxes • Pay interest • Pay dividends • Labor • Materials • Overhead
  • 9.
    The Cash FlowStatement of SABIC – Illustration Contemporary Engineering Economics, 5th edition. ©2010 Period End Date 12/31/2011 12/31/2010 CASH FROM OPERATING ACTIVITIES + Net Income 29,241.75 21,528.67 + Depreciation & Amortization (writing off an intangible asset investment) 11,815.33 10,609.85 + Other Non-Cash Adjustments 17,070.40 11,169.38 + Changes in Non-Cash Capital -15,983.02 -13,682.96 Cash From Operations 42,144.46 29,624.94 CASH FROM INVESTING ACTIVITIES + Disposal of Fixed Assets 0.00 0.00 + Capital Expenditures (Physical assets) -10,641.97 -16,100.22 + Increase in Investments 0.00 0.00 + Decrease in Investments 5.14 24.56 + Other Investing Activities -1,613.34 -3,986.87 Cash From Investing Activities -12,250.17 -20,062.54 CASH FROM FINANCING ACTIVITIES + Dividends Paid -11,831.28 -8,961.98 + Change in Short-Term Borrowings 212.92 180.73 + Increase in Long-Term Borrowings 0.00 3,406.67 + Decrease in Long-term Borrowings -8,310.21 0.00 + Increase in Capital Stocks (Preferred & Common) 0.00 0.00 + Decrease in Capital Stocks (Preferred & Common) 0.00 0.00 + Other Financing Activities -10,224.74 -10,736.63 Cash from Financing Activities -30,153.31 -16,111.20 Net Changes in Cash -259.02 -6,548.80
  • 10.
    The Cash FlowStatement of SABIC – Illustration Contemporary Engineering Economics, 5th edition. ©2010 Period End Date 12/31/2011 12/31/2010 CASH FROM OPERATING ACTIVITIES + Net Income 29,241.75 21,528.67 + Depreciation & Amortization (writing off an intangible asset investment) 11,815.33 10,609.85 + Other Non-Cash Adjustments 17,070.40 11,169.38 + Changes in Non-Cash Capital -15,983.02 -13,682.96 Cash From Operations 42,144.46 29,624.94 CASH FROM INVESTING ACTIVITIES + Disposal of Fixed Assets 0.00 0.00 + Capital Expenditures (Physical assets) -10,641.97 -16,100.22 + Increase in Investments 0.00 0.00 + Decrease in Investments 5.14 24.56 + Other Investing Activities -1,613.34 -3,986.87 Cash From Investing Activities -12,250.17 -20,062.54 CASH FROM FINANCING ACTIVITIES + Dividends Paid -11,831.28 -8,961.98 + Change in Short-Term Borrowings 212.92 180.73 + Increase in Long-Term Borrowings 0.00 3,406.67 + Decrease in Long-term Borrowings -8,310.21 0.00 + Increase in Capital Stocks (Preferred & Common) 0.00 0.00 + Decrease in Capital Stocks (Preferred & Common) 0.00 0.00 + Other Financing Activities -10,224.74 -10,736.63 Cash from Financing Activities -30,153.31 -16,111.20 Net Changes in Cash -259.02 -6,548.80