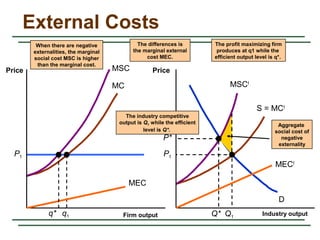
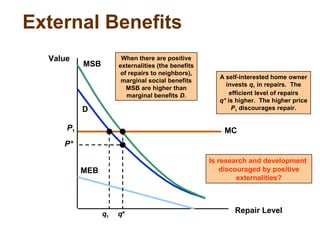
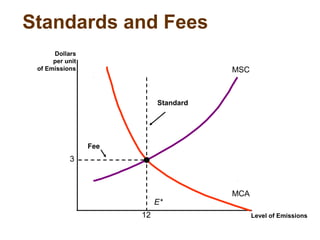
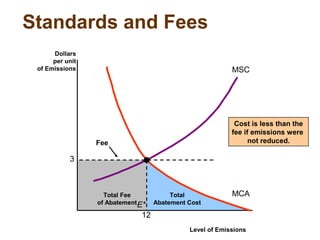
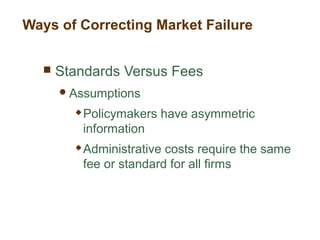
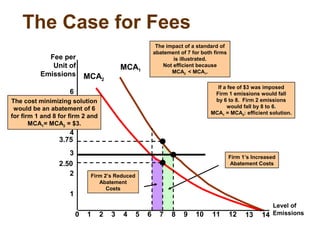
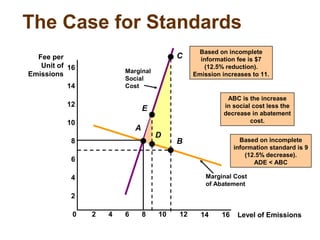
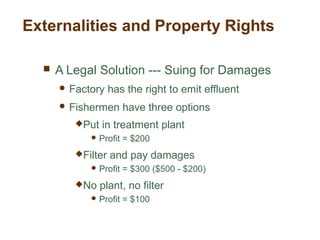
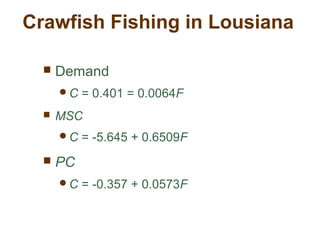
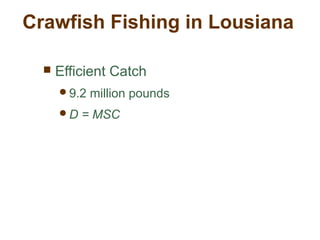
This document discusses externalities, public goods, and market failures. It begins by defining externalities as costs or benefits imposed on third parties from economic transactions. When negative externalities are present, the competitive market outcome is inefficient. The document presents different ways to correct this, such as emissions fees, standards, and tradable permits. It also discusses public goods, which are nonrival and nonexclusive, leading to underprovision in the private market due to free-riding incentives. Common resources are also prone to overuse without controls due to high social costs not faced by individual actors.
The document discusses four key functions of public finance: allocation, distribution, stabilization, and growth. It also discusses principles for evaluating a good tax system, including revenue adequacy, stability, simplicity, tax neutrality, economic efficiency, and low administration and compliance costs. The document compares tax systems before and after reforms, noting the need to tailor reforms to a country's existing economic system and administrative capabilities.
The document discusses externalities and the role of government in addressing market failures caused by externalities. It defines externalities as costs or benefits imposed on third parties by production or consumption activities. When externalities are present, markets allocate resources inefficiently. The government can intervene to correct market failures through Pigouvian taxes to internalize negative externalities or subsidies to encourage positive externalities. By internalizing external costs and benefits, the government can make prices reflect true social costs and benefits, leading to more economically efficient outcomes.
types of inflation and inflationary and deflationary gap ayazmashori
This document discusses different types of inflation including definitions of inflation, deflation, disinflation, and their causes. It defines inflation as a sustained increase in prices over time. Deflation is a decrease in prices, while disinflation is a slowdown in the rate of inflation. The types of inflation include hyperinflation (over 100% per year), galloping inflation (10-100%), and creeping inflation (<10%). Causes of inflation are discussed as either demand-pull inflation from too much spending, or cost-push inflation from increased costs of production. Inflationary gaps occur when current GDP is higher than potential GDP at full employment, while deflationary gaps are when demand is below full employment supply
The Liquidity Preference Theory suggests that investors demand higher interest rates for longer term investments because cash is considered the most liquid asset. There are three motives for demanding money: transaction motives for daily needs, precautionary motives for unexpected events, and speculative motives based on interest rate fluctuations. The total demand for money is the sum of these three motives and is determined by income and interest rates. Interest rates are set by the point where the total demand for money equals the fixed money supply as determined by the central bank, with the demand curve sloping downward and the supply curve being vertical.
This document outlines the Absolute Income Hypothesis theory presented by Keynes in 1936. The theory states that as absolute income increases, the proportion of that income spent on consumption decreases. So while consumption increases with more income, the rate of increase declines. Key points include consumption (C) increasing at a decreasing rate as income (Y) rises, the average propensity to consume (APC) decreasing as income rises, and the theory showing consumption-income relationships in both the short run and long run.
1. Market failure occurs when the conditions for perfect competition are not met, resulting in inefficient resource allocation. Some causes of market failure include monopoly, externalities, public goods, imperfect information, and non-existent markets.
2. Externalities occur when the actions of one economic unit unintentionally impact another in an uncompensated way, such as pollution from factories. This leads to a divergence between private and social costs/benefits.
3. For goods with public goods characteristics of non-rivalry and non-excludability, like national defense, there is no market mechanism to efficiently allocate resources, as they cannot be priced. This results in underprovision of public goods.
Since pollution is an externality firms will not undertake to control their pollution. The answer is in government regulations. Coase argues that in perfect competition with laissez faire, govt regulation is not needed. Instead bargaining between the polluters and their victims can lead to an optimal situation. But this pre supposes equality in bargaining, and does not take note of ecological consequences of pollution.
This document discusses public goods and their efficient provision. It defines public goods as nonrival and nonexcludable, meaning consumption by one person does not reduce availability to others and it is difficult to prevent others from consuming them. This leads to a free rider problem where people have an incentive to let others pay for public goods while still enjoying the benefits. While private markets fail to efficiently provide public goods due to this issue, government intervention through taxation can potentially solve the free rider problem and lead to more efficient outcomes. The document also discusses the debate around privatizing certain goods and services traditionally provided publicly.
The document summarizes Keynesian income determination through the aggregate demand-aggregate supply model. It defines consumption and investment functions, which together determine aggregate demand. Consumption depends on income through the marginal propensity to consume. Investment is assumed constant in the short-run. Equilibrium income is reached at the point where aggregate demand equals aggregate supply. This can be modeled as either the AD-AS approach where equilibrium Y satisfies C+I=C+S, or the savings-investment approach where I=S. Numerical examples are provided to illustrate the equilibrium income calculation under each approach.
1. The document discusses general equilibrium and welfare in a perfectly competitive economy with two goods, x and y. It uses an Edgeworth box diagram to show the production possibility frontier for efficient combinations of x and y output given fixed inputs.
2. The production possibility frontier and indifference curves are used to determine the equilibrium prices and outputs of x and y that equalize supply and demand. A change such as technological progress in x production would shift the frontier outward and lower the relative price of x.
3. The debate over Britain's Corn Laws in the 1800s is used as an example, where removing trade tariffs on grain imports would change the price ratio and increase grain imports.
Open-Economy Macroeconomics: Basic ConceptsChris Thomas
This document provides an overview of key concepts in open-economy macroeconomics. It defines open and closed economies, and describes how an open economy interacts through international trade and financial flows. It explains exports, imports, the trade balance, and factors that influence them. It also discusses net capital flows, interest rates, and the relationship between saving, investment, and international flows. Finally, it introduces nominal and real exchange rates, and the theory of purchasing power parity.
Public goods are characterized by non-excludability, meaning it is impossible to prevent people who have not paid from consuming them, and non-rivalry, meaning that one person's consumption does not reduce availability to others. Examples include national defense, street lighting, flood defenses. Public goods cause market failure as it is difficult to charge people for their provision or exclude non-payers. While governments often provide public goods, technological advances are blurring the distinction between public and private goods in some cases.
This document discusses models of duopoly, where there are two firms in an industry. It describes Cournot's model of duopoly, where each firm assumes the other will not change output and they reach an equilibrium with each supplying 1/3 of the market. It also covers Chamberlin's model, where firms recognize their interdependence and independently set the monopoly price to maximize joint profits. Finally, it mentions Bertrand's model which differs from Cournot's in its behavioral assumptions about how firms respond to each other.
This document summarizes key points from a chapter about government debt. It discusses several topics:
1. The size of government debt in various countries, with Japan having the highest debt-to-GDP ratio at 159% and the U.S. at 64%.
2. Traditional and Ricardian views on the effects of government debt. The traditional view is that debt crowds out investment, while the Ricardian view is that debt has no real effects due to forward-looking consumers.
3. Problems in measuring budget deficits, such as not accounting for inflation, capital assets, or future liabilities for programs like Social Security. Correcting for these issues can significantly change deficit estimates.
This document summarizes Wagner's hypothesis and the Peacock-Wiseman hypothesis about public expenditure. Wagner hypothesized that industrialization leads to increasing state activity and that public expenditure will rise faster than per capita income. The Peacock-Wiseman hypothesis emphasizes time patterns of spending rather than a theory of growth. It involves displacement effects as social disturbances expand the public sector, inspection effects as revenue lags required spending, and concentration effects as central government activity increases with economic growth. The document also lists criticisms of Wagner's hypothesis and defines intensive and extensive increases in state activity.
The document discusses different types of costs firms face in both the short run and long run. It defines explicit costs as actual cash payments and implicit costs as opportunity costs. In the short run, some resources are fixed while others are variable. As more of the variable input is added, marginal product initially increases but eventually declines due to diminishing returns. In the long run, all inputs are variable and firms can choose different plant sizes, leading to economies or diseconomies of scale.
Consumer Behavior: Income and Substitution Effects
The Consumer’s Reaction to a Change in Income
Engel Curve or Engel’s Law
The Consumer’s Reaction to a Change in Price
The Consumer’s Demand Function
Cobb-Douglas Utility Function
The Slutsky Substitution Effect
The Hicks substitution effect
The document summarizes key concepts from chapter twelve of Mankiw's macroeconomics textbook on aggregate demand in an open economy. It introduces the Mundell-Fleming model and its assumptions. It shows how fiscal and monetary policy impact the economy differently under floating versus fixed exchange rates. Specifically, fiscal policy is powerful under fixed rates but monetary policy is powerful under floating rates. It also examines the effects of changes in the exchange rate, interest rates, money supply, and price levels in the Mundell-Fleming model framework.
Concept and application of cd and ces production function in resource managem...Nar B Chhetri
The document defines production functions and describes the Cobb-Douglas and CES production functions. It provides the mathematical forms and properties of each. The Cobb-Douglas production function relates output to labor and capital inputs. It is widely used in empirical analyses. The CES production function generalizes the Cobb-Douglas by allowing the elasticity of substitution to vary. Both functions exhibit constant returns to scale under certain parameter values. Examples are given of estimating production functions for various industries and crops using regression analysis.
The Harrod-Domar growth model uses 3 key variables to determine the growth rate:
1. The saving rate, which determines how much can be invested.
2. Capital productivity, or how much output increases with each unit of new capital.
3. The depreciation rate, which accounts for aging of the existing capital stock.
The model's formula is: Growth Rate = Saving Rate x Capital Productivity - Depreciation Rate. It provides a simple framework for analyzing how changes to these variables impact long-term economic growth.
A competitive market has many small firms that produce identical goods, with free entry and exit. Each firm is a price taker and maximizes profits by producing where marginal revenue equals marginal cost. The competitive firm's supply curve is its marginal cost curve above average variable cost in the short run and above average total cost in the long run. Market supply is the sum of individual firm supplies. In the long run, entry and exit drive the market to equilibrium with price equal to minimum average total cost and zero profits.
Meeting 4 - Stolper - Samuelson theorem (International Economics)Albina Gaisina
The document discusses the Stolper-Samuelson theorem, which states that a decrease in the price of a good will lead to a decrease in the return to the factor that is used intensively in the production of that good. It will conversely lead to an increase in the return to the other factor. The theorem is based on assumptions of perfect competition and factor mobility. It predicts that increased trade with developing countries likely contributed to rising wage inequality in skilled countries. While trade increases overall welfare, it benefits some factors more than others according to their intensity of use.
This document discusses the natural rate of unemployment and its causes. It begins by defining the natural rate of unemployment as the average rate around which the actual unemployment rate fluctuates over the business cycle. It then presents a model showing how the natural rate is determined by the rates of job separation and job finding. Frictional unemployment results from the time it takes to search for and transition between jobs, while structural unemployment stems from wage rigidities that prevent wages from adjusting downward to clear the labor market. The document explores factors like minimum wages, unions, efficiency wages, and sectoral shifts that contribute to real wage rigidity and the natural rate of unemployment.
INDIRECT UTILITY FUNCTION AND ROY’S IDENTITIY by Maryam LoneSAMEENALONE2
- Utility is a measure of satisfaction derived from consuming goods and services. Individuals seek to maximize their utility subject to a budget constraint.
- Indifference curves represent combinations of goods that provide equal utility. The slope of the indifference curve is the marginal rate of substitution (MRS).
- The budget constraint shows affordable combinations given prices and income. Utility is maximized at the point where the MRS equals the price ratio, where the indifference curve is tangent to the budget constraint.
- Using tools like Lagrangian optimization and the envelope theorem, the amounts demanded of each good can be derived as functions of prices and income.
The Baumol model describes money demand as a tradeoff between liquidity and interest rate returns. It assumes consumers can keep income as cash or in savings accounts. Cash earns no interest while savings accounts pay interest i, the opportunity cost of holding cash. Consumers minimize costs by choosing the optimal number of trips N to the bank to withdraw cash. Their average money holdings is Y/2N. The Baumol-Tobin money demand function shows real money demand depends positively on income and withdrawal costs, and negatively on the interest rate.
Income consumption curve,price consumption curve, engles law Ekta Doger
1. Comparative statics analysis examines how optimal decisions change when underlying assumptions, like prices or income, change.
2. Changes in prices result in new budget constraints and equilibrium points where indifference curves are tangent to the new budget lines.
3. The price consumption curve is formed by joining all the new equilibrium points and used to derive the demand curve.
4. Similarly, changes in income result in parallel shifts to the budget line and new equilibrium points joined to form the income consumption curve.
This document provides an overview of market-based instruments (MBIs) for environmental regulation. It discusses the need for MBIs and examples like cap-and-trade programs and environmental offsets. Cap-and-trade programs set a limit on pollution and allow trading of permits between companies. Offsets allow pollution in one area if equivalent reductions are made elsewhere. The document also examines MBIs compared to traditional command-and-control regulation and examples of MBIs used in India, including a case study of the US Acid Rain Program sulfur dioxide cap-and-trade system.
The document discusses carbon emissions trading as an EU environmental policy to control climate change. It provides background on the EU Emissions Trading Scheme (ETS), which uses a cap-and-trade model to incentivize reductions in greenhouse gas emissions. The ETS allocates emissions allowances that can be traded, with the goal of decarbonizing the economy over the long term. However, the system has faced criticisms over weaknesses like over-allocation of quotas and lack of certainty about future rules.
This document discusses the key concepts of green economics compared to conventional economics. It outlines some basic axioms of green economics, including that resources are finite and growth cannot continue indefinitely. It describes how green economics aims to internalize external costs through policies like resource taxes, polluter pays principles, and emissions trading systems. Kyoto Protocol and the EU Emissions Trading System are provided as examples of large emissions trading schemes. India and China's involvement in carbon credit markets through clean development mechanism projects is also summarized.
This document discusses carbon emissions trading in the EU and alternatives like a carbon tax. It covers:
1) The EU Emissions Trading Scheme which creates a market for carbon allowances in an effort to reduce emissions cost-effectively. However, the scheme has faced criticisms like over-allocation of quotas and price volatility.
2) A potential alternative of a carbon tax which would directly price carbon and provide incentives for emission reductions, but faces challenges in agreement and measuring emissions accurately.
3) Key considerations in evaluating different policy approaches include their effectiveness in changing behavior, encouraging innovation, reducing emissions at lowest cost, and achieving global participation. Putting an accurate price on carbon is necessary but not sufficient.
The document discusses the scale of changes needed to limit global warming to 450 parts per million of CO2, including improving energy efficiency, increasing renewable energy sources, deploying carbon capture and storage technologies, and increasing nuclear power. It emphasizes that a coordinated global policy approach is required, including government policies to support low-carbon technologies through all stages from research to large-scale demonstration and deployment. Cap-and-trade systems and international cooperation on projects are presented as important policy mechanisms.
Negative externalities occur when production or consumption impose costs on third parties not involved in the market transaction. This leads to market failure as prices do not reflect the full social costs. Examples include pollution from factories imposing health costs, and noise pollution from airlines imposing nuisance costs. Taxes or regulations can be used to internalize these external costs and improve economic efficiency by aligning private and social costs. However, determining the appropriate tax level can be difficult and taxes may impact consumer welfare.
Negative externalities occur when production or consumption impose costs on third parties not involved in the market transaction. This leads to market failure as prices do not reflect the full social costs. Examples include pollution from factories imposing health costs, and noise pollution from events imposing costs of disruption. Taxes and regulations can help internalize these external costs and improve social welfare, but come with challenges of setting the right level and unintended consequences.
Energy Efficiency Obligations – A Toolkit for successLeonardo ENERGY
Energy Efficiency Obligations (EEOs) are a strong driver of energy savings in Europe and around the world. Many Member States have chosen EEOs as an important policy to support compli-ance with Article 7 of the Energy Efficiency Directive. This webinar draws on the recently pub-lished “Toolkit for Energy Efficiency Obligations” to discuss elements of EEO design, and specif-ically to answer: What are the main considerations for designing, implementing, and (over time) improving EEOs? What are examples of best practices that have led to successful schemes? And what are some of the most frequent barriers and how might they be over-come?
The document discusses frameworks for assessing corporate carbon performance using indicators such as carbon intensity, dependency, exposure, and risk. It outlines key considerations for standardizing carbon accounting, including which emissions scopes to cover and what business metrics to use as denominators for different industry sectors. The document also provides examples of business metrics, cost approaches, and a carbon management framework that incorporates setting goals and monitoring performance over time.
This document discusses externalities and market failures. It begins by defining an externality as the uncompensated impact of one person's actions on another. Externalities can cause market outcomes to be inefficient if they are not accounted for. The document presents several examples of policies that can address externalities, such as corrective taxes/subsidies that internalize external costs and benefits, and tradable pollution permits that achieve pollution reduction goals at lower cost. However, private solutions to externalities face limitations around transaction costs and coordination problems with many parties.
The document discusses carbon trading as a mechanism under the Kyoto Protocol to reduce greenhouse gas emissions. It involves capping overall emissions and allowing countries to trade emission permits. Countries with excess permits below their cap can sell to countries that are over their cap. It also describes carbon offsetting programs and case studies of carbon trading in the European Union, highlighting phases that saw both increases and reductions in emissions and carbon prices. Benefits include incentivizing alternative energy development while criticisms note it can slow emissions reductions and lack a centralized global framework.
This document outlines an economic analysis of a landfill recycling project in the United States. It discusses how landfills produce methane, a potent greenhouse gas, and how capturing and using landfill gas can generate renewable energy. The analysis examines a specific landfill project that would install gas collection infrastructure and pipelines to deliver gas to an end user. It calculates the capital costs, operating costs, revenues from gas sales, and environmental benefits. The financial analysis finds the project has a positive net present value and internal rate of return, suggesting it is economically viable. Barriers to implementing such projects in Oman are also discussed.
Toward New Frameworks for Transportation Climate Policyjmdecicco
The document discusses the need for new frameworks for transportation climate policy. It argues that existing approaches focused on technology and fuels alone have not been effective. A more holistic actor-based approach is needed that considers all decision makers including automakers, fuel providers, land use planners, and consumers. The framework should establish a consistent context where all actors make decisions considering carbon impacts. A combination of incentives and constraints is likely needed to motivate emission reductions across the transportation sector.
A general overview on carbon tax and carbon trading describing it's mechanism and advantages and disadvantages. A summarization of their effects on economy and environment remarking the conclusion
This document provides an overview of pure monopoly, including its key characteristics, examples, and barriers to entry. It also discusses how a pure monopolist determines the profit-maximizing price and output level by setting marginal revenue equal to marginal cost and choosing the quantity where total revenue is maximized. Finally, it examines the economic effects of monopoly, including inefficiency due to underproduction compared to perfect competition.
This document discusses carbon credits and carbon banking. It begins by defining carbon credits as representing one ton of carbon. It then explains how carbon credits were created to control greenhouse gas emissions and how they work as part of an emissions trading system. It discusses the key concepts and mechanisms behind carbon credits, including additionality, criticism of the system, and how carbon credits can benefit countries and companies.
April 21, 2010 - As the 111th Congress makes its spring and summer push for climate and energy legislation, at least four major proposals are under consideration. The proposals, similar in their intent to reduce carbon emissions and promote clean energy, differ in framework, reach, and importantly, the role of energy efficiency as a clean energy resource. Today, the Alliance to Save Energy held a webinar on alternative approaches to energy and climate.
Similar to Chapter 18 externality and public goods (20)
Konsep Balanced Score Card. Penilaian kinerja dilihat dari 4 perspektif yaitu perspektif keuangan, konsumen, learn and growth dan proses bisnis internal.
Dokumen tersebut membahas prospek industri taksi di Jakarta yang padat. Bakri mempertimbangkan untuk memasuki bisnis ini namun perlu menganalisis apakah dapat bersaing, bagaimana memulai usaha, kerja sama dengan investor dan mekanisme kerja sama dengan supir taksi.
Bakri berencana memasuki bisnis taksi di Jakarta. Analisis lingkungan eksternal menunjukkan prospek bisnis taksi masih baik meskipun persaingan ketat. Bakri perlu strategi yang tepat untuk bersaing di pasar yang padat.
Makalah Analisis PT Kereta API Indonesia . membahas analisis strategik dalam perusahaan kereta api, dimana dampak peraturan harga pesawat tidak ada penetapan batas bawah maka kereta api berdampak.
Dmfi booklet indonesian. isi petisi nya yah jangan lupa klik www.dogmeatfreeindonesia.org
tidak sampai 1 menit isi petisi ini agar indonesia bebas dari daging anjing, anjing layak diperlakukan layak dan lebih baik.
tolong ya teman - teman
Dokumen tersebut membahas risiko kesehatan dan kesejahteraan hewan yang ditimbulkan oleh perdagangan daging anjing di Indonesia, termasuk penyebaran penyakit rabies, penderitaan hewan, dan kerentanan kelompok tertentu terhadap penyakit. Beberapa organisasi berkomitmen untuk meningkatkan kesadaran masyarakat dan mendorong pemerintah mengakhiri praktik ini.
BPR adalah merancang ulang radikal sistem bisnis untuk meningkatkan kinerja kritis seperti biaya, kualitas, layanan dan kecepatan. Faktor keberhasilan BPR meliputi visi, keterampilan, insentif, sumber daya, dan rencana aksi. Hasil yang diharapkan dari BPR adalah perbaikan proses hingga 100% dan pengurangan biaya secara drastis.
Makalah ini membahas tentang Business Process Reengineering (BPR), termasuk definisi, pihak yang terlibat, tahapan pelaksanaannya, dan faktor-faktor keberhasilannya. BPR merupakan perancangan ulang mendasar dan radikal sistem bisnis untuk meningkatkan kinerja perusahaan secara signifikan."
Balanced Scorecard (BSC) adalah sistem pengelolaan strategis yang menggabungkan ukuran-ukuran keuangan dan nonkeuangan untuk menyelaraskan strategi perusahaan. BSC memiliki empat perspektif yaitu keuangan, pelanggan, proses internal, dan pembelajaran & pertumbuhan. Langkah-langkah penyusunan BSC meliputi penetapan masalah, indikator kinerja utama, pengukuran KPI, dan pembuatan peta strategi.
Makalah ini membahas tentang Balanced Scorecard, yaitu sistem pengukuran kinerja yang mempertimbangkan empat perspektif yaitu keuangan, pelanggan, proses bisnis internal, dan pembelajaran dan pertumbuhan. Balanced Scorecard dikembangkan untuk mengurangi kelemahan pengukuran kinerja konvensional yang hanya berfokus pada aspek keuangan."
Solution Manual For Financial Accounting, 8th Canadian Edition 2024, by Libby...Donc Test
Solution Manual For Financial Accounting, 8th Canadian Edition 2024, by Libby, Hodge, Verified Chapters 1 - 13, Complete Newest Version Solution Manual For Financial Accounting, 8th Canadian Edition by Libby, Hodge, Verified Chapters 1 - 13, Complete Newest Version Solution Manual For Financial Accounting 8th Canadian Edition Pdf Chapters Download Stuvia Solution Manual For Financial Accounting 8th Canadian Edition Ebook Download Stuvia Solution Manual For Financial Accounting 8th Canadian Edition Pdf Solution Manual For Financial Accounting 8th Canadian Edition Pdf Download Stuvia Financial Accounting 8th Canadian Edition Pdf Chapters Download Stuvia Financial Accounting 8th Canadian Edition Ebook Download Stuvia Financial Accounting 8th Canadian Edition Pdf Financial Accounting 8th Canadian Edition Pdf Download Stuvia
Lecture slide titled Fraud Risk Mitigation, Webinar Lecture Delivered at the Society for West African Internal Audit Practitioners (SWAIAP) on Wednesday, November 8, 2023.
Vicinity Jobs’ data includes more than three million 2023 OJPs and thousands of skills. Most skills appear in less than 0.02% of job postings, so most postings rely on a small subset of commonly used terms, like teamwork.
Laura Adkins-Hackett, Economist, LMIC, and Sukriti Trehan, Data Scientist, LMIC, presented their research exploring trends in the skills listed in OJPs to develop a deeper understanding of in-demand skills. This research project uses pointwise mutual information and other methods to extract more information about common skills from the relationships between skills, occupations and regions.
Financial Assets: Debit vs Equity Securities.pptxWrito-Finance
financial assets represent claim for future benefit or cash. Financial assets are formed by establishing contracts between participants. These financial assets are used for collection of huge amounts of money for business purposes.
Two major Types: Debt Securities and Equity Securities.
Debt Securities are Also known as fixed-income securities or instruments. The type of assets is formed by establishing contracts between investor and issuer of the asset.
• The first type of Debit securities is BONDS. Bonds are issued by corporations and government (both local and national government).
• The second important type of Debit security is NOTES. Apart from similarities associated with notes and bonds, notes have shorter term maturity.
• The 3rd important type of Debit security is TRESURY BILLS. These securities have short-term ranging from three months, six months, and one year. Issuer of such securities are governments.
• Above discussed debit securities are mostly issued by governments and corporations. CERTIFICATE OF DEPOSITS CDs are issued by Banks and Financial Institutions. Risk factor associated with CDs gets reduced when issued by reputable institutions or Banks.
Following are the risk attached with debt securities: Credit risk, interest rate risk and currency risk
There are no fixed maturity dates in such securities, and asset’s value is determined by company’s performance. There are two major types of equity securities: common stock and preferred stock.
Common Stock: These are simple equity securities and bear no complexities which the preferred stock bears. Holders of such securities or instrument have the voting rights when it comes to select the company’s board of director or the business decisions to be made.
Preferred Stock: Preferred stocks are sometime referred to as hybrid securities, because it contains elements of both debit security and equity security. Preferred stock confers ownership rights to security holder that is why it is equity instrument
<a href="https://www.writofinance.com/equity-securities-features-types-risk/" >Equity securities </a> as a whole is used for capital funding for companies. Companies have multiple expenses to cover. Potential growth of company is required in competitive market. So, these securities are used for capital generation, and then uses it for company’s growth.
Concluding remarks
Both are employed in business. Businesses are often established through debit securities, then what is the need for equity securities. Companies have to cover multiple expenses and expansion of business. They can also use equity instruments for repayment of debits. So, there are multiple uses for securities. As an investor, you need tools for analysis. Investment decisions are made by carefully analyzing the market. For better analysis of the stock market, investors often employ financial analysis of companies.
BONKMILLON Unleashes Its Bonkers Potential on Solana.pdfcoingabbar
Introducing BONKMILLON - The Most Bonkers Meme Coin Yet
Let's be real for a second – the world of meme coins can feel like a bit of a circus at times. Every other day, there's a new token promising to take you "to the moon" or offering some groundbreaking utility that'll change the game forever. But how many of them actually deliver on that hype?
Abhay Bhutada, the Managing Director of Poonawalla Fincorp Limited, is an accomplished leader with over 15 years of experience in commercial and retail lending. A Qualified Chartered Accountant, he has been pivotal in leveraging technology to enhance financial services. Starting his career at Bank of India, he later founded TAB Capital Limited and co-founded Poonawalla Finance Private Limited, emphasizing digital lending. Under his leadership, Poonawalla Fincorp achieved a 'AAA' credit rating, integrating acquisitions and emphasizing corporate governance. Actively involved in industry forums and CSR initiatives, Abhay has been recognized with awards like "Young Entrepreneur of India 2017" and "40 under 40 Most Influential Leader for 2020-21." Personally, he values mindfulness, enjoys gardening, yoga, and sees every day as an opportunity for growth and improvement.
1. Elemental Economics - Introduction to mining.pdfNeal Brewster
After this first you should: Understand the nature of mining; have an awareness of the industry’s boundaries, corporate structure and size; appreciation the complex motivations and objectives of the industries’ various participants; know how mineral reserves are defined and estimated, and how they evolve over time.
5 Tips for Creating Standard Financial ReportsEasyReports
Well-crafted financial reports serve as vital tools for decision-making and transparency within an organization. By following the undermentioned tips, you can create standardized financial reports that effectively communicate your company's financial health and performance to stakeholders.
5. External Cost
Scenario
Steel plant dumping waste in a river
The entire steel market effluent can be
reduced by lowering output (fixed
proportions production function)
6. External Cost
Scenario
Marginal External Cost (MEC) is the cost
imposed on fishermen downstream for
each level of production.
Marginal Social Cost (MSC) is MC plus
MEC.
7. MC
S = MCI
D
P1
Aggregate
social cost of
negative
externality
P1
q1 Q1
MSC
MSCI
When there are negative
externalities, the marginal
social cost MSC is higher
than the marginal cost.
External Costs
Firm output
Price
Industry output
Price
MEC
MECI
The differences is
the marginal external
cost MEC.
q*
P*
Q*
The industry competitive
output is Q1 while the efficient
level is Q*.
The profit maximizing firm
produces at q1 while the
efficient output level is q*.
8. External Cost
Negative Externalities encourage
inefficient firms to remain in the
industry and create excessive
production in the long run.
9. Externalities
Positive Externalities and Inefficiency
Externalities can also result in too little
production, as can be shown in an
example of home repair and
landscaping.
10. MCP1
External Benefits
Repair Level
Value
D
Is research and development
discouraged by positive
externalities?
q1
MSB
MEB
When there are positive
externalities (the benefits
of repairs to neighbors),
marginal social benefits
MSB are higher than
marginal benefits D.
q*
P*
A self-interested home owner
invests q1 in repairs. The
efficient level of repairs
q* is higher. The higher price
P1 discourages repair.
11. Ways of Correcting Market Failure
Assumption: The market failure is
pollution
Fixed-proportion production technology
Must reduce output to reduce
emissions
Use an output tax to reduce output
Input substitution possible by altering
technology
12. The Efficient Level of Emissions
Level of Emissions
2
4
6
Dollars
per unit
of Emissions
0 2 4 6 8 10 12 14 16 18 20 22 24 26
MSC
MCA
E*
The efficient level of
emissions is 12 (E*) where
MCA = MSC.
Assume:
1) Competitive market
2) Output and emissions decisions are independent
3) Profit maximizing output chosen
At Eo the marginal
cost of abating emissions
is greater than the
marginal social cost.
E0
At E1 the marginal
social cost is greater
than the marginal benefit.
E1
Why is this more efficient
than zero emissions?
13. Ways of Correcting Market Failure
Options for Reducing Emissions to E*
Emission Standard
Set a legal limit on emissions at E*
(12)
Enforced by monetary and criminal
penalties
Increases the cost of production and
the threshold price to enter the
industry
14. Standards and Fees
Level of Emissions
Dollars
per unit
of Emissions MSC
MCA
3
12
E*
Standard
Fee
15. Options for Reducing Emissions to E*
Emissions Fee
Charge levied on each unit of
emission
Ways of Correcting Market Failure
16. Total
Abatement Cost
Cost is less than the
fee if emissions were
not reduced.
Total Fee
of Abatement
Standards and Fees
Level of Emissions
Dollars
per unit
of Emissions MSC
MCA
3
12
E*
Fee
17. Standards Versus Fees
Assumptions
Policymakers have asymmetric
information
Administrative costs require the same
fee or standard for all firms
Ways of Correcting Market Failure
18. Firm 2’s Reduced
Abatement
Costs
Firm 1’s Increased
Abatement Costs
MCA1
MCA2
The Case for Fees
Level of
Emissions
2
4
6
Fee per
Unit of
Emissions
0 1 2 3 4 5 6 7 8 9 10 11 12 13
1
3
5
14
The cost minimizing solution
would be an abatement of 6
for firm 1 and 8 for firm 2 and
MCA1= MCA2 = $3.
3.75
2.50
The impact of a standard of
abatement of 7 for both firms
is illustrated.
Not efficient because
MCA2 < MCA1.
If a fee of $3 was imposed
Firm 1 emissions would fall
by 6 to 8. Firm 2 emissions
would fall by 8 to 6.
MCA1 = MCA2: efficient solution.
19. Advantages of Fees
When equal standards must be used,
fees achieve the same emission
abatement at lower cost.
Fees create an incentive to install
equipment that would reduce emissions
further.
Ways of Correcting Market Failure
20. ABC is the increase
in social cost less the
decrease in abatement
cost.
Marginal
Social
Cost
Marginal Cost
of Abatement
The Case for Standards
Level of Emissions
Fee per
Unit of
Emissions
0 2 4 6 8 10 12 14 16
2
4
6
8
10
12
14
16
E
Based on incomplete
information standard is 9
(12.5% decrease).
ADE < ABC
D
A
B
C
Based on incomplete
information fee is $7
(12.5% reduction).
Emission increases to 11.
21. Summary: Fees vs. Standards
Standards are preferred when MSC is
steep and MCA is flat.
Standards (incomplete information) yield
more certainty on emission levels and
less certainty on the cost of abatement.
Ways of Correcting Market Failure
22. Summary: Fees vs. Standards
Fees have certainty on cost and
uncertainty on emissions.
Preferred policy depends on the nature
of uncertainty and the slopes of the cost
curves.
Ways of Correcting Market Failure
23. Transferable Emissions Permits
Permits help develop a competitive
market for externalities.
Agency determines the level of
emissions and number of permits
Permits are marketable
High cost firm will purchase permits
from low cost firms
Ways of Correcting Market Failure
24. Question
What factors could limit the efficiency of
this approach?
Ways of Correcting Market Failure
25. The Costs and Benefits
of Reduced Sulfur Dioxide Emissions
Cost of Reducing Emissions
Conversion to natural gas from coal and
oil
Emission control equipment
26. Benefits of Reducing Emissions
Health
Reduction in corrosion
Aesthetic
The Costs and Benefits
of Reduced Sulfur Dioxide Emissions
27. Sulfur Dioxide Emissions Reductions
Sulfur dioxide
concentration (ppm)
20
40
60
0
Dollars
per
unit of
reduction
0.02 0.04 0.06 0.08
Marginal Social Cost
Marginal Abatement Cost
ObservationsObservations
•MAC = MSC @ .0275MAC = MSC @ .0275
•.0275 is slightly below actual emission level.0275 is slightly below actual emission level
•Economic efficiency improvedEconomic efficiency improved
28. Emissions Trading and Clean Air
Bubbles
Firm can adjust pollution controls for
individual sources of pollutants as long
as a total pollutant limit is not exceeded.
Offsets
New emissions must be offset by
reducing existing emissions
2000 offsets since 1979
29. Cost of achieving an 85% reduction in
hydrocarbon emissions for DuPont
Three Options
85% reduction at each source plant
(total cost = $105.7 million)
85% reduction at each plant with internal
trading (total cost = $42.6 million)
85% reduction at all plants with internal and
external trading
(total cost = $14.6 million)
Emissions Trading and Clean Air
30. 1990 Clean Air Act
Since 1990, the cost of the permits has
fallen from an expected $300 to below
$100.
Causes of the drop in permit prices
More efficient abatement techniques
Price of low sulfur coal has fallen
Emissions Trading and Clean Air
31. Recycling
Households can dispose of glass and
other garbage at very low cost.
The low cost of disposal creates a
divergence between the private and the
social cost of disposal.
Ways of Correcting Market Failure
32. The Efficient Amount of Recycling
Scrap
Cost
0 4 8 12
MCR
MSC
m*
With a refundable deposit,
MC increases and
MC = MSC = MCR.
MC + per unit refund
MC
m1
Without market intervention
the level of scrap will be at m1
and m1 > m*.
33. Refundable Deposits
Amount of Glass
$
D
Price falls to P’ and
the amount of
recycled glass
increases to M*.
Sv
Sr
S
The supply of glass is
the sum of the supply
of virgin glass (Sr) and
the supply of recycled
glass (Sr).
M1
P
Without refunds the
price of glass is P and
Sr is M1.
S’r
S’
P’
M*
With refunds Sr increases
to S’r and S increases to S’.
34. Externalities and Property Rights
Property Rights
Legal rules describing what people or
firms may do with their property
For example
If residents downstream owned the
river (clean water) they control
upstream emissions.
35. Bargaining and Economic Efficiency
Economic efficiency can be achieved
without government intervention when
the externality affects relatively few
parties and when property rights are well
specified.
Externalities and Property Rights
36. Profits Under Alternative
Emissions Choices (Daily)
No filter, not treatment plant 500 100 600
Filter, no treatment plant 300 500 800
No filter, treatment plant 500 200 700
Filter, treatment plant 300 300 600
Factory’s Fishermen’s Total
Profit Profit Profit
37. Assumptions
Factory pays for the filter
Fishermen pay for the treatment plant
Efficient Solution
Buy the filter and do not build the plant
Externalities and Property Rights
38. Bargaining with
Alternative Property Rights
No Cooperation
Profit of factory $500 $300
Profit of fishermen $200 $500
Cooperation
Profit of factory $550 $300
Profit of fishermen $250 $500
Right to Dump Right to Clean Water
39. Conclusion: Coase Theorem
When parties can bargain without cost
and to their mutual advantage, the
resulting outcome will be efficient,
regardless of how the property rights are
specified.
Externalities and Property Rights
40. Costly Bargaining --- The Role of
Strategic Behavior
Bargaining requires clearly defined rules
and property rights.
Externalities and Property Rights
41. A Legal Solution --- Suing for
Damages
Fishermen have the right to clean water
Factory has two options
No filter, pay damages
Profit = $100 ($500 - $400)
Filter, no damages
Profit = $300 ($500 - $200)
Externalities and Property Rights
42. A Legal Solution --- Suing for Damages
Factory has the right to emit effluent
Fishermen have three options
Put in treatment plant
Profit = $200
Filter and pay damages
Profit = $300 ($500 - $200)
No plant, no filter
Profit = $100
Externalities and Property Rights
43. Conclusion
A suit for damages results in an efficient
outcome.
Question
How would imperfect information impact
the outcome?
Externalities and Property Rights
44. The Coase Theorem at Work
Negotiating an Efficient Solution
1987 --- New York garbage spill (200
tons) littered the New Jersey beaches
The potential cost of litigation resulted
in a solution that was mutually
beneficial to both parties.
45. Common Property Resources
Common Property Resource
Everyone has free access.
Likely to be overutilized
Examples
Air and water
Fish and animal populations
Minerals
46. Common Property Resources
Fish per Month
Benefits,
Costs
($ per
fish)
Demand
However, private costs
underestimate true cost.
The efficient level of
fish/month is F* where
MSC = MB (D)
Marginal Social Cost
F*
Private Cost
FC
Without control the number
of fish/month is FC where
PC = MB.
47. Common Property Resources
Solution
Private ownership
Question
When would private ownership be
impractical?
48. Crawfish Fishing in Lousiana
Finding the Efficient Crawfish Catch
F = crawfish catch in millions of
pounds/yr
C = cost in dollars/pound
51. Crawfish Catch
(millions of pounds)
C
Cost
(dollars/pound)
Demand
Marginal Social Cost
Private Cost
Crawfish as a Common
Property Resource
11.9
2.10
9.2
0.325
53. Public Goods
Public Good Characteristics
Nonrival
For any given level of production the
marginal cost of providing it to an
additional consumer is zero.
Nonexclusive
People cannot be excluded from
consuming the good.
54. Public Goods
Not all government produced goods
are public goods
Some are rival and nonexclusive
Education
Parks
55. D1
D2
D
When a good is nonrival, the social marginal
benefit of consumption (D) , is determined by
vertically summing the individual demand
curves for the good.
Efficient Public Good Provision
Output0
Benefits
(dollars)
1 2 3 4 5 6 7 8 109
$4.00
$5.50
$7.00
Marginal Cost
$1.50
Efficient output occurs
where MC = MB at 2
units of output. MB is
$1.50 + $4.00 or $5.50.
56. Public Goods
Public Goods and Market Failure
How much national defense did you
consume last week?
57. Public Goods
Free Riders
There is no way to provide some goods
and services without benefiting
everyone.
Households do not have the incentive to
pay what the item is worth to them.
Free riders understate the value of a
good or service so that they can enjoy its
benefit without paying for it.
58. Public Goods
Establishing a mosquito abatement
company
How do you measure output?
Who do you charge?
A mosquito meter?
59. The Demand for Clean Air
Clean Air is a public good
Nonexclusive and nonrival
What is the price of clean air?
60. The Demand for Clean Air
Choosing where to live
Study in Boston correlates housing
prices with the quality of air and other
characteristics of the houses and their
neighborhoods.
61. The Demand for Clean Air
Nitrogen Oxides
(pphm)0
Dollars
1 2 3 4 5 6 7 8 109
2000
2500
3000
500
1500
1000
Low Income
Middle Income
High Income
62. The Demand for Clean Air
Findings
Amount people are willing to pay for clean air
increases substantially as pollution increases.
Higher income earners are willing to pay more
(the gap between the demand curves widen)
National Academy of Sciences found that a
10% reduction in auto emissions yielded a
benefit of $2 billion---somewhat greater than
the cost.
63. Private Preferences for Public Goods
Government production of a public
good is advantageous because the
government can assess taxes or fees
to pay for it.
Determining how much of a public
good to provide when free riders exist
is difficult.
64. Determining the Level
of Educational Spending
Educational spending
per pupil$0
Willingness
to pay
$
$1200$600 $1800 $2400
W1 W2 W3
AW
The efficient level of educational
spending is determined by summing the
willingness to pay for education for each
of three citizens.
65. Determining the Level
of Educational Spending
Educational spending
per pupil$0
Willingness
to pay
$
$1200$600 $1800 $2400
W1 W2 W3
AW
Will majority rule yield an efficient outcome?
•W1 will vote for $600
•W2 and W3 will vote for $1200
The median vote will always win in a majority
rule election.
66. Question
Will the median voter selection always
be efficient?
Answer
If two of the three preferred $1200 there
would be overinvestment.
If two of the three preferred $600 there
would be underinvestment.
Private Preferences for Public Goods
67. Majority rule is inefficient because it
weighs each citizen’s preference
equally---the efficient outcome weighs
each citizen’s vote by his or her
strength of preference.
Private Preferences for Public Goods
68. Summary
There is an externality when a producer or
a consumer affects the production or
consumption activities of others in a
manner that is not directly reflected in the
market.
Pollution can be corrected by emission
standards, emissions fees, marketable
emissions permits, or by encouraging
recycling.
69. Summary
Inefficiencies due to market failure
may be eliminated through private
bargaining among the affected
parties.
Common property resources are not
controlled by a single person and can
be used without a price being paid.
70. Summary
Goods that private markets are not
likely to produce efficiently are either
nonrival or nonexclusive. Public
goods are both.
A public good is provided efficiently
when the vertical sum of the
individual demands for the public
good is equal to the marginal cost of
producing it.
71. Summary
Under majority rule voting, the level of
spending provided will be that
preferred by the median voter---this
need not be the efficient outcome.