Download as PDF, PPTX

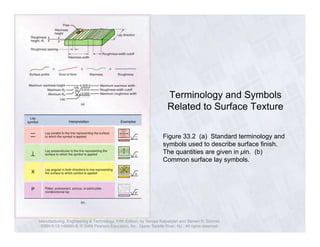
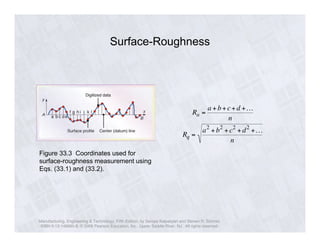
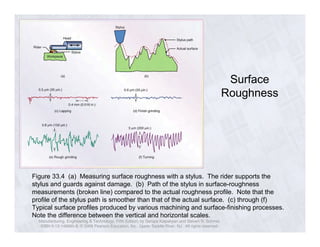

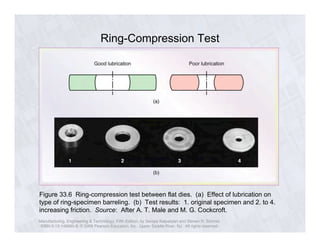

The document discusses surface roughness measurement and terminology, including common symbols used to describe surface finish. Methods for measuring surface roughness with a stylus are presented, as well as typical surface profiles produced by different machining processes. Formulas for calculating average roughness (Ra) and root mean square roughness (Rq) are also provided.