VIP Kolkata Call Girl Serampore 👉 8250192130 Available With Room
Ntpc 2 qfy11 result update - 271010
1. Please refer to important disclosures at the end of this report 1
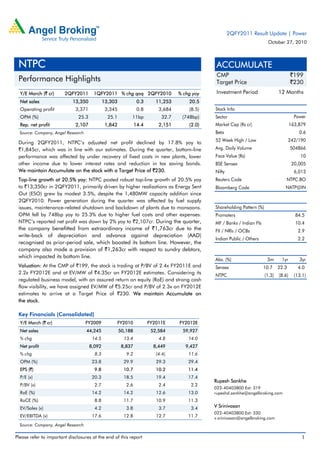
Y/E March (` cr) 2QFY2011 1QFY2011 % chg qoq 2QFY2010 % chg yoy
Net sales 13,350 13,303 0.3 11,253 20.5
Operating profit 3,371 3,345 0.8 3,684 (8.5)
OPM (%) 25.3 25.1 11bp 32.7 (748bp)
Rep. net profit 2,107 1,842 14.4 2,151 (2.0)
Source: Company, Angel Research
During 2QFY2011, NTPC’s adjusted net profit declined by 17.8% yoy to
`1,845cr, which was in line with our estimates. During the quarter, bottom-line
performance was affected by under recovery of fixed costs in new plants, lower
other income due to lower interest rates and reduction in tax saving bonds.
We maintain Accumulate on the stock with a Target Price of `230.
Top-line growth at 20.5% yoy: NTPC posted robust top-line growth of 20.5% yoy
to `13,350cr in 2QFY2011, primarily driven by higher realisations as Energy Sent
Out (ESO) grew by modest 3.5%, despite the 1,480MW capacity addition since
2QFY2010. Power generation during the quarter was affected by fuel supply
issues, maintenance-related shutdown and backdown of plants due to monsoons.
OPM fell by 748bp yoy to 25.3% due to higher fuel costs and other expenses.
NTPC’s reported net profit was down by 2% yoy to `2,107cr. During the quarter,
the company benefitted from extraordinary income of `1,763cr due to the
write-back of depreciation and advance against depreciation (AAD)
recognised as prior-period sale, which boosted its bottom line. However, the
company also made a provision of `1,263cr with respect to sundry debtors,
which impacted its bottom line.
Valuation: At the CMP of `199, the stock is trading at P/BV of 2.4x FY2011E and
2.2x FY2012E and at EV/MW of `4.35cr on FY2012E estimates. Considering its
regulated business model, with an assured return on equity (RoE) and strong cash
flow visibility, we have assigned EV/MW of `5.25cr and P/BV of 2.3x on FY2012E
estimates to arrive at a Target Price of `230. We maintain Accumulate on
the stock.
Key Financials (Consolidated)
Y/E March (` cr) FY2009 FY2010 FY2011E FY2012E
Net sales 44,245 50,188 52,584 59,927
% chg 14.5 13.4 4.8 14.0
Net profit 8,092 8,837 8,449 9,427
% chg 8.3 9.2 (4.4) 11.6
OPM (%) 23.8 29.9 29.3 29.4
EPS (`) 9.8 10.7 10.2 11.4
P/E (x) 20.3 18.5 19.4 17.4
P/BV (x) 2.7 2.6 2.4 2.2
RoE (%) 14.2 14.2 12.6 13.0
RoCE (%) 8.8 11.7 10.9 11.3
EV/Sales (x) 4.2 3.8 3.7 3.4
EV/EBITDA (x) 17.6 12.8 12.7 11.7
Source: Company, Angel Research
ACCUMULATE
CMP `199
Target Price `230
Investment Period 12 Months
Stock Info
Sector
Bloomberg Code
Shareholding Pattern (%)
Promoters 84.5
MF / Banks / Indian Fls 10.4
FII / NRIs / OCBs 2.9
Indian Public / Others 2.2
Abs. (%) 3m 1yr 3yr
Sensex 10.7 22.3 4.0
NTPC (1.3) (8.6) (13.1)
10
20,005
6,013
NTPC.BO
NATP@IN
Face Value (Rs)
BSE Sensex
Nifty
Reuters Code
163,879
0.6
242/190
504866
Power
Avg. Daily Volume
Market Cap (Rs cr)
Beta
52 Week High / Low
Rupesh Sankhe
022-40403800 Ext: 319
rupeshd.sankhe@angelbroking.com
V Srinivasan
022-40403800 Ext: 330
v.srinivasan@angelbroking.com
NTPC
Performance Highlights
2QFY2011 Result Update | Power
October 27, 2010
3. NTPC |2QFY2011 Result Update
October 27, 2010 3
Operational highlights
During the quarter, NTPC’s generation volumes grew by 3.7% yoy to 52.2BU
(50.4BU). The overall plant load factor (PLF) for the company stood at 82.9%, up
by a marginal 49bp yoy. Power generation during the quarter was affected due to
fuel supply issues in some of the plants, maintenance-related shutdown and
backdown of plants due to monsoons. ESO grew by 3.5% yoy to 48.8BU during
the quarter.
The plant availability factor (PAF) for the company also improved for both coal and
gas-based stations. PAF for coal-based plants stood at 86.5% (82.5%), up 400bp
yoy, while that for gas-based plants came in at 92.1% (88.2% in 2QFY2010).
PAF of gas-based plants grew because of improved gas availability.
Exhibit 4: Operational performance
Source: Company, Angel Research
Capacity addition
Currently, NTPC’s capacity stands at 32,690MW, while capacity under construction
is at 16,844MW. In 2QFY2011, the company commissioned 490MW Unit6 plant
at Dadri in Uttar Pradesh. Management has guided that it would add 4,150MW
and 6,500MW of capacity in FY2011E and FY2012E, respectively. On a
consolidated basis, the company plans to incur capex of `29,000cr during FY2011
and add 4,150MW of capacity during FY2011.
Exhibit 5: Capacity addition planned for FY2011
Project MW
Sipat Stage-I, Unit-I 660
Jhajjar, Unit- I &2 1,000
Korba Stage–III, Unit -7 500
NCTPP Stage–II, Unit – 6 490
Simhadri, Stage–II, Unit- 3&4 1,000
Farakka, Stage-III, Unit 6 500
Total 4,150
Source: Company, Angel Research
74
78
82
86
90
94
0
50
100
150
200
250
FY03 FY04 FY05 FY06 FY07 FY08 FY09 FY10
Generation PLF ‐ (RHS)
BU
%
4. NTPC |2QFY2011 Result Update
October 27, 2010 4
Investment arguments
Capacity addition to drive future growth: NTPC is India’s largest power generating
company. Currently, the company has a capacity of 32,690MW. Having the best
execution capability in the industry, management has an ambitious target of
adding 22,300MW during the Eleventh Plan, thus taking its installed capacity to
50,000MW. The company has till date managed to add only 4,800MW since the
beginning of the plan period, with most of its capacity addition expected to be
back ended. In all, we estimate the company to add close to 15,000MW during
the plan period.
Earnings protected by the regulated return model: NTPC, being a Central Public
Utility (CPU), is governed under the regulated return model. The CERC’s
regulations for FY2010–14 increased the cap on RoE to 15.5% (on a pre-tax basis,
grossed up for tax) from the earlier 14% (on a post-tax basis), which is positive for
NTPC. Going ahead, with the commissioning of new capacities, the company
would fall under the MAT bracket and will have to pay tax of 19.95% as against
the marginal tax rate of 33.2%. This in turn would suppress the company’s pre-tax
RoE to 19.4% as against the earlier 23.2%, which is a negative.
NTPC to generate stable cash flows: NTPC has 85% of its overall output tied
up under the long-term PPA route, which ensures power offtake, thereby
ensuring stable cash flows for the company.
5. NTPC |2QFY2011 Result Update
October 27, 2010 5
Outlook and valuation
Despite being one of the lowest per capita consumers of power, India has an
overall power deficit of 11%. Power demand in the country, which has grown at
6% since FY2003, has continued to outstrip supply. The escalation in power
demand is expected to be robust going ahead as well, in line with healthy GDP
growth estimated for the country. Apart from rising demand from the industrial
segment, the domestic segment’s demand is also expected to pick up, with the
Ministry of Power’s ambitious target of achieving per capita consumption of
1,000 units by 2012.
With 32,690MW of capacity, NTPC has a 20% market share in the overall
domestic power generation industry. The company is expected to add around
9,500MW of capacity over FY2010–12E, taking its capacity close to 42,000MW by
FY2012E. We expect the company’s top line to grow at a 9.3% CAGR over
FY2010–12E.
At the CMP of `199, the stock is trading at P/BV of 2.4x FY2011E and 2.2x
FY2012E and at EV/MW of `4.35cr on FY2012E estimates. Considering its
regulated business model, with an assured RoE and strong cash flow visibility, we
have assigned EV/MW of `5.25cr and P/BV of 2.3x on FY2012E estimates to
arrive at a Target Price of `230. We maintain an Accumulate rating on the stock.
Exhibit 6: Change in estimates
(` cr) FY2011E FY2012E
Earlier Revised Variation (%) Earlier Revised Variation (%)
Net sales 51,605 52,584 1.9 58,520 59,927 2.4
Operating exp. 36,242 37,174 2.6 40,746 42,304 3.8
Operating profit 15,363 15,410 0.3 17,774 17,623 (0.9)
Depreciation 3,440 3,506 1.9 4,096 4,195 2.4
Interest 2,239 2,239 0.0 2,844 2,844 0.0
PBT 10,699 11,266 5.3 11,849 12,085 2.0
Tax 2,675 2,816 5.3 2,674 2,657 (0.6)
PAT 8,024 8,449 5.3 9,175 9,427 2.7
Source: Angel Research
12. NTPC |2QFY2011 Result Update
October 27, 2010 12
Disclosure of Interest Statement NTPC
1. Analyst ownership of the stock No
2. Angel and its Group companies ownership of the stock Yes
3. Angel and its Group companies' Directors ownership of the stock No
4. Broking relationship with company covered No
Note: We have not considered any Exposure below `1 lakh for Angel, its Group companies and Directors.
Ratings (Returns) : Buy (> 15%) Accumulate (5% to 15%) Neutral (-5 to 5%)
Reduce (-5% to 15%) Sell (< -15%)
Research Team Tel: 022 - 4040 3800 E-mail: research@angeltrade.com Website: www.angeltrade.com
DISCLAIMER
This document is solely for the personal information of the recipient, and must not be singularly used as the basis of any investment
decision. Nothing in this document should be construed as investment or financial advice. Each recipient of this document should make
such investigations as they deem necessary to arrive at an independent evaluation of an investment in the securities of the companies
referred to in this document (including the merits and risks involved), and should consult their own advisors to determine the merits and
risks of such an investment.
Angel Broking Limited, its affiliates, directors, its proprietary trading and investment businesses may, from time to time, make
investment decisions that are inconsistent with or contradictory to the recommendations expressed herein. The views contained in this
document are those of the analyst, and the company may or may not subscribe to all the views expressed within.
Reports based on technical and derivative analysis center on studying charts of a stock's price movement, outstanding positions and
trading volume, as opposed to focusing on a company's fundamentals and, as such, may not match with a report on a company's
fundamentals.
The information in this document has been printed on the basis of publicly available information, internal data and other reliable
sources believed to be true, but we do not represent that it is accurate or complete and it should not be relied on as such, as this
document is for general guidance only. Angel Broking Limited or any of its affiliates/ group companies shall not be in any way
responsible for any loss or damage that may arise to any person from any inadvertent error in the information contained in this report.
Angel Broking Limited has not independently verified all the information contained within this document. Accordingly, we cannot testify,
nor make any representation or warranty, express or implied, to the accuracy, contents or data contained within this document. While
Angel Broking Limited endeavours to update on a reasonable basis the information discussed in this material, there may be regulatory,
compliance, or other reasons that prevent us from doing so.
This document is being supplied to you solely for your information, and its contents, information or data may not be reproduced,
redistributed or passed on, directly or indirectly.
Angel Broking Limited and its affiliates may seek to provide or have engaged in providing corporate finance, investment banking or
other advisory services in a merger or specific transaction to the companies referred to in this report, as on the date of this report or in
the past.
Neither Angel Broking Limited, nor its directors, employees or affiliates shall be liable for any loss or damage that may arise from or in
connection with the use of this information.
Note: Please refer to the important `Stock Holding Disclosure' report on the Angel website (Research Section). Also, please
refer to the latest update on respective stocks for the disclosure status in respect of those stocks. Angel Broking Limited and
its affiliates may have investment positions in the stocks recommended in this report.