Download to read offline
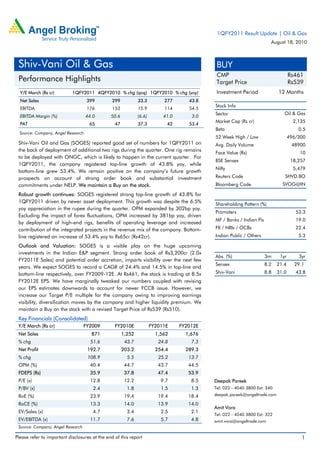
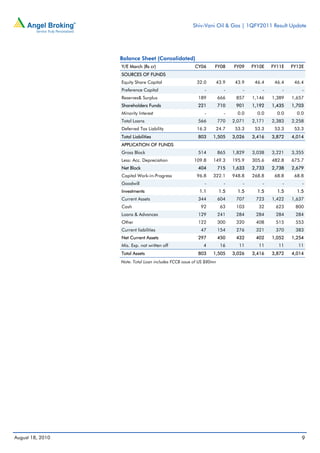

Shiv-Vani Oil and Gas (SOGES) reported strong results for the first quarter of fiscal year 2011. Revenue grew 43.8% over the previous year to Rs399 crore, driven by the deployment of two additional drilling rigs. Operating profit margin expanded 302 basis points to 44% despite rupee appreciation. Net profit increased 53.4% to Rs65 crore. The company maintained a strong order backlog of Rs3,200 crore, providing visibility for continued growth. The analyst expects SOGES to grow revenues and profits at a compounded annual growth rate of 24.4% and 14.5% respectively over the fiscal years 2009 to 2012. The stock remains rated a "Buy" with


