Downloaded 127 times
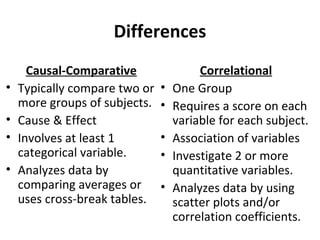


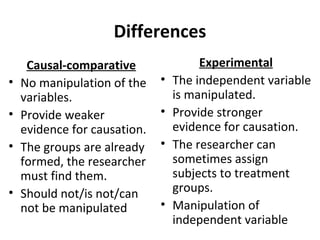
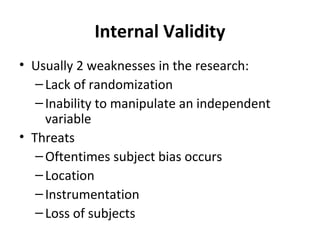
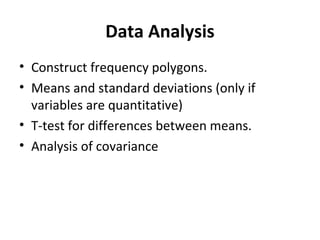
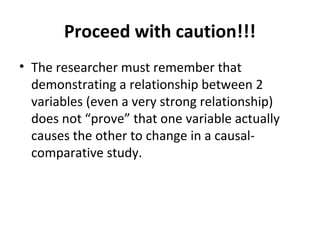
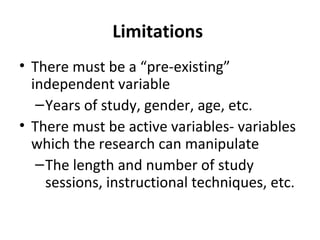


This document discusses causal-comparative and correlational research. Causal-comparative research attempts to identify cause-and-effect relationships by comparing two or more groups that differ on some independent variable. Correlational research explores associations between two or more quantitative variables within one group. Both lack manipulation but can provide guidance for experimental research. Key differences are that causal-comparative research involves categorical variables and group comparisons, while correlational research involves quantitative variables and association measures within one group.


