This document discusses key concepts about populations including:
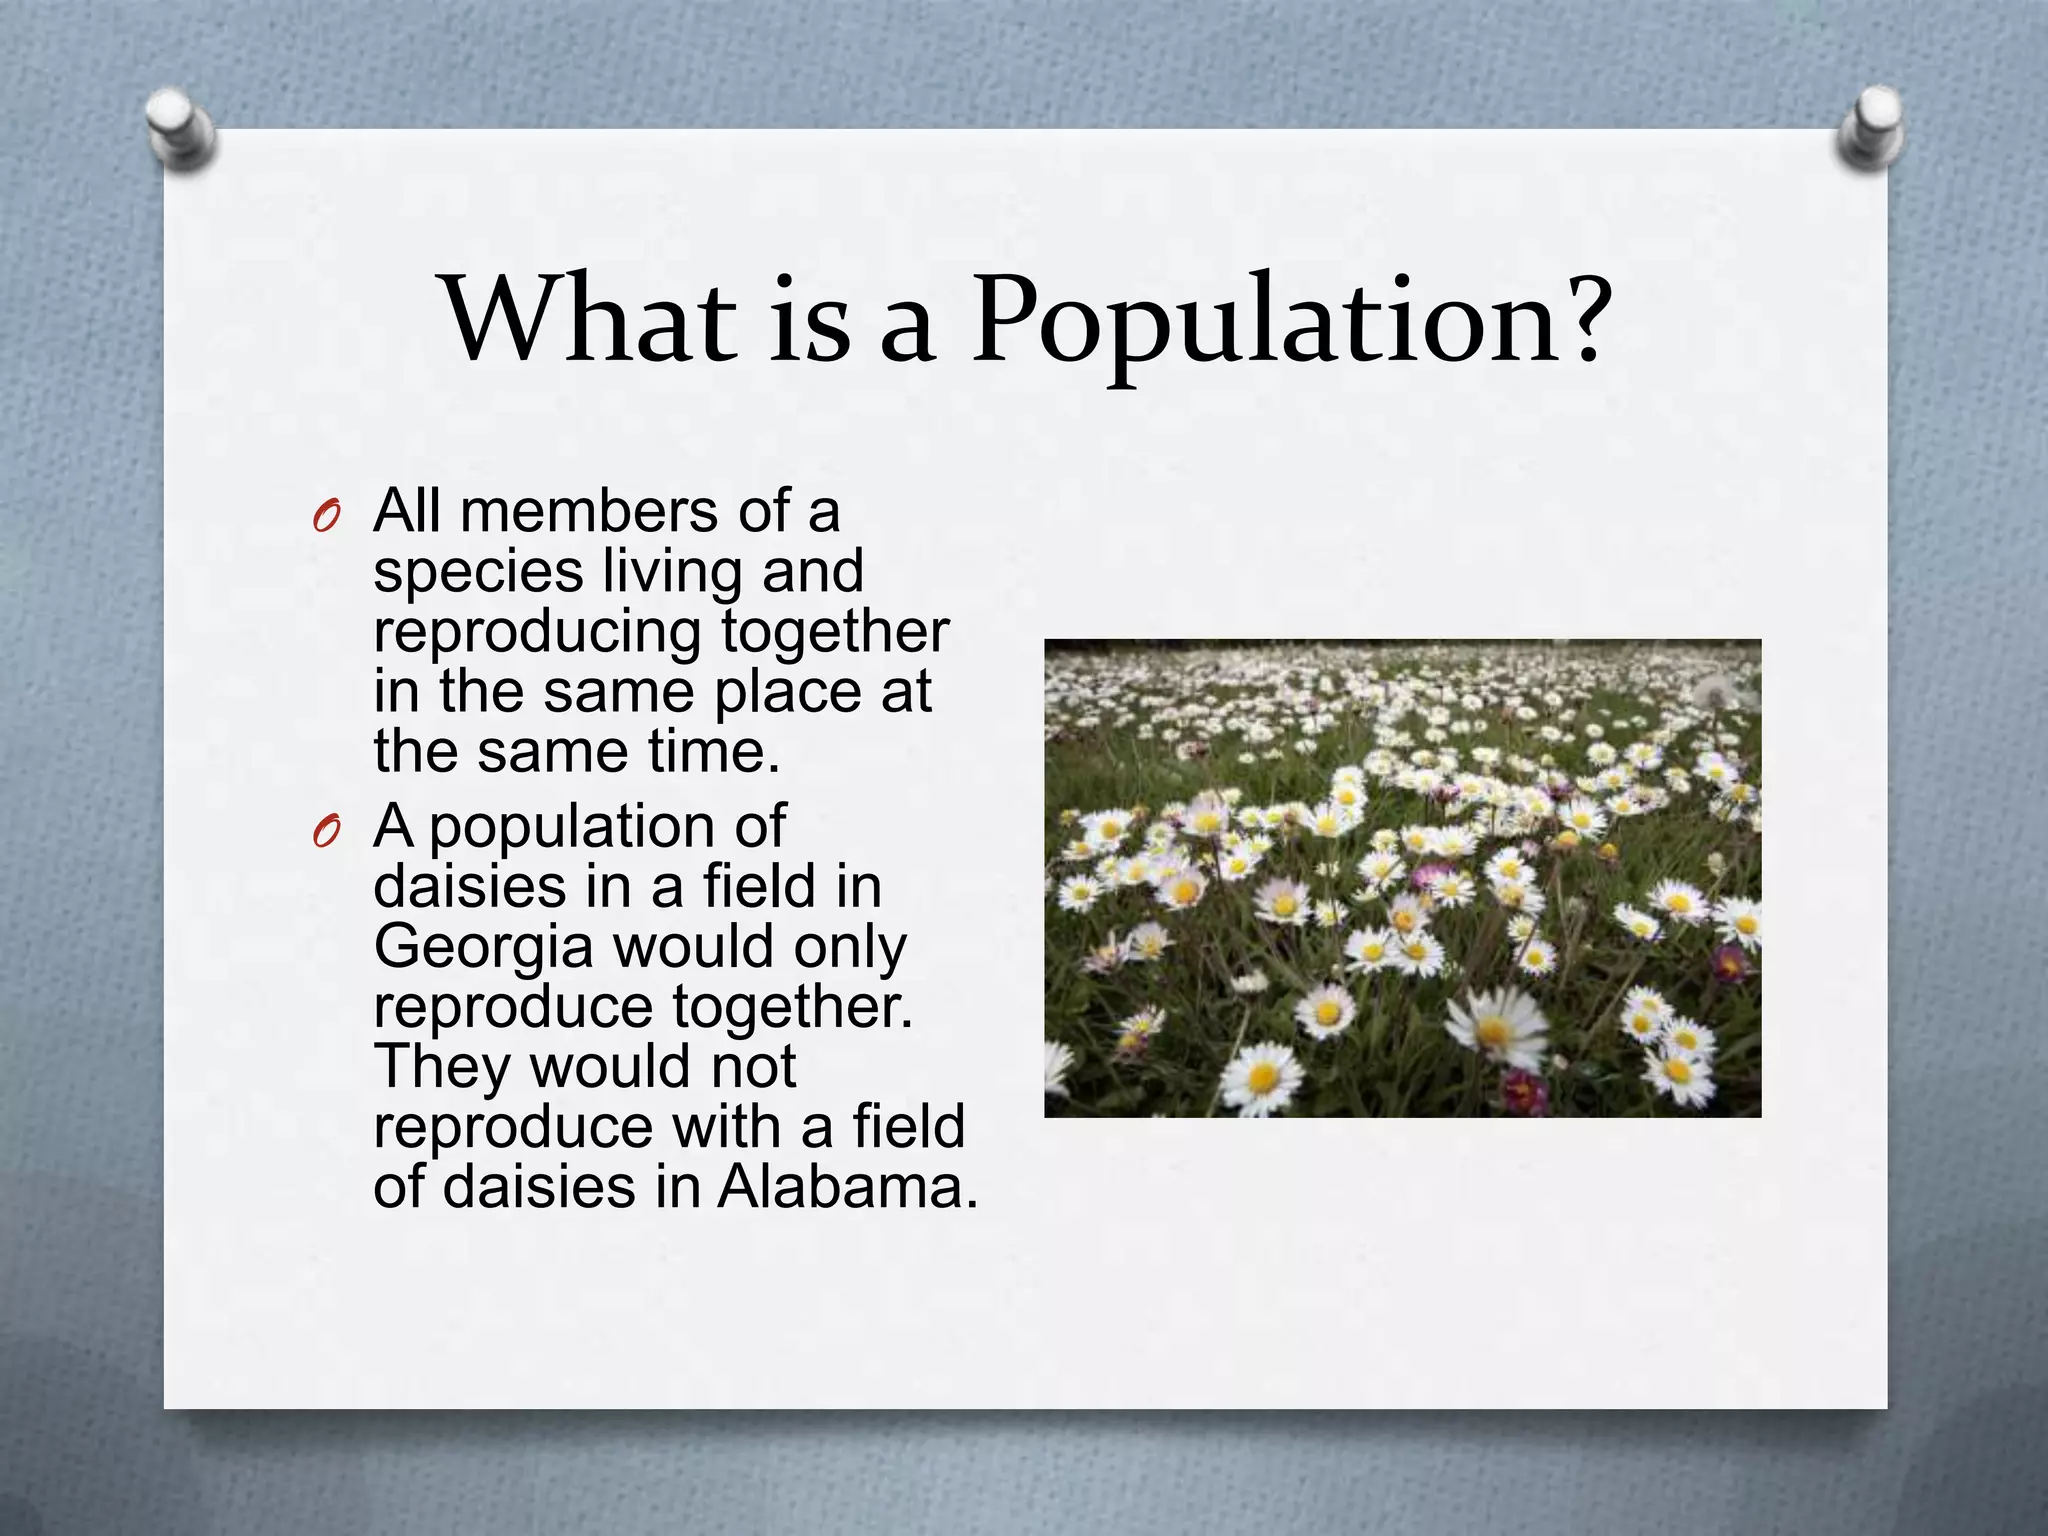
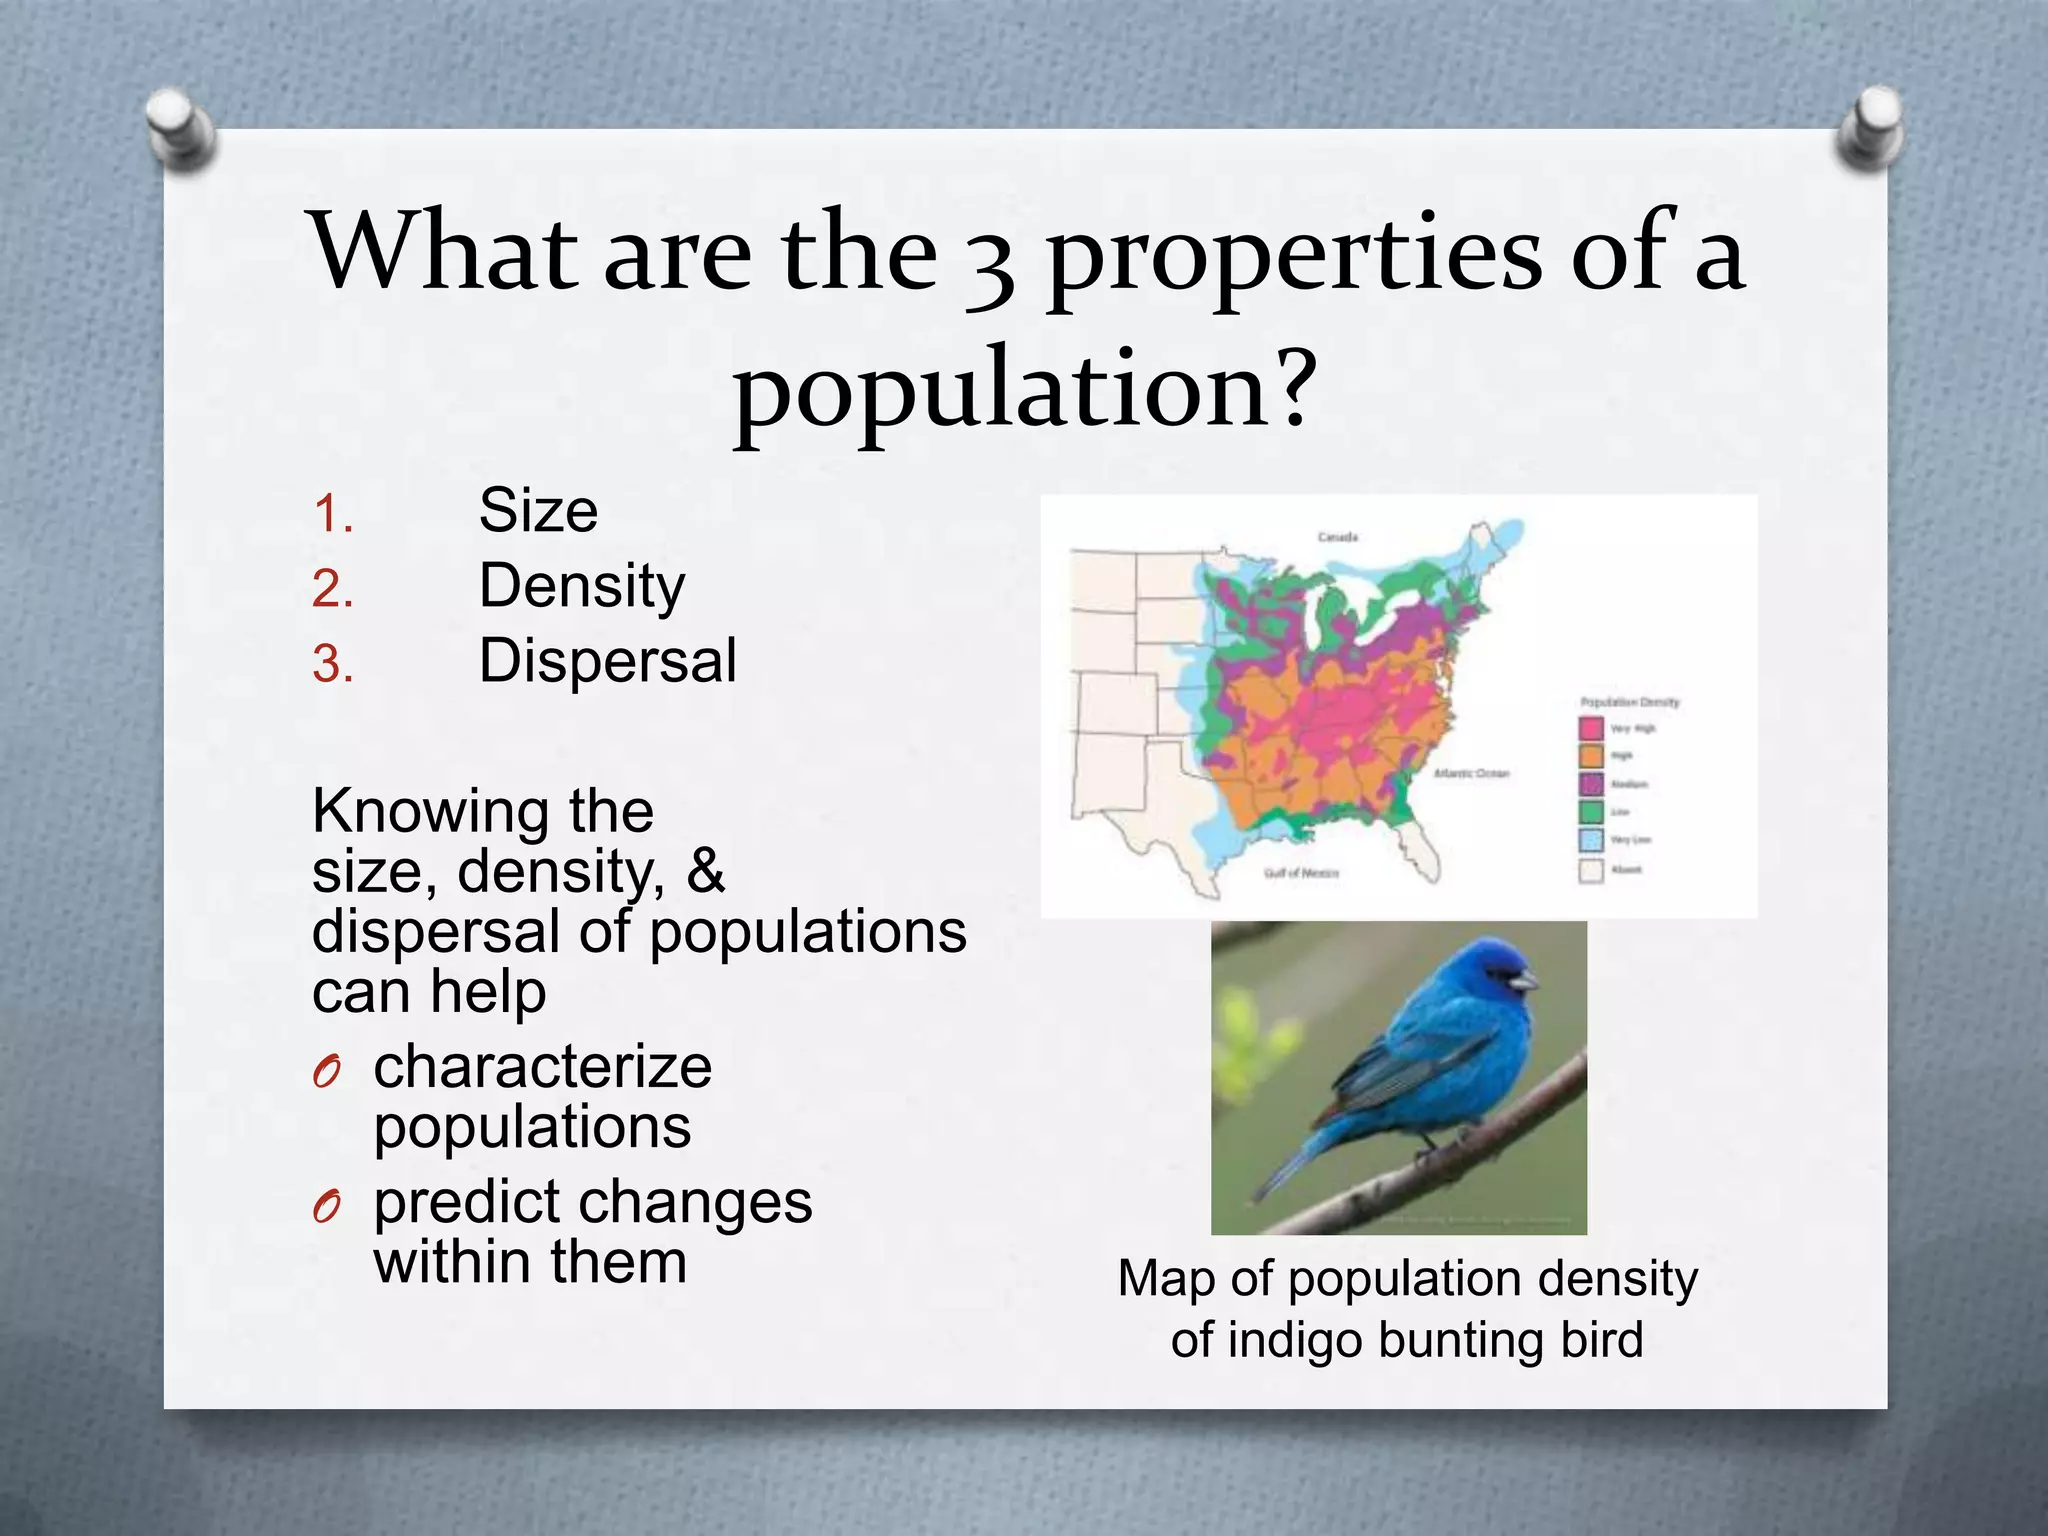
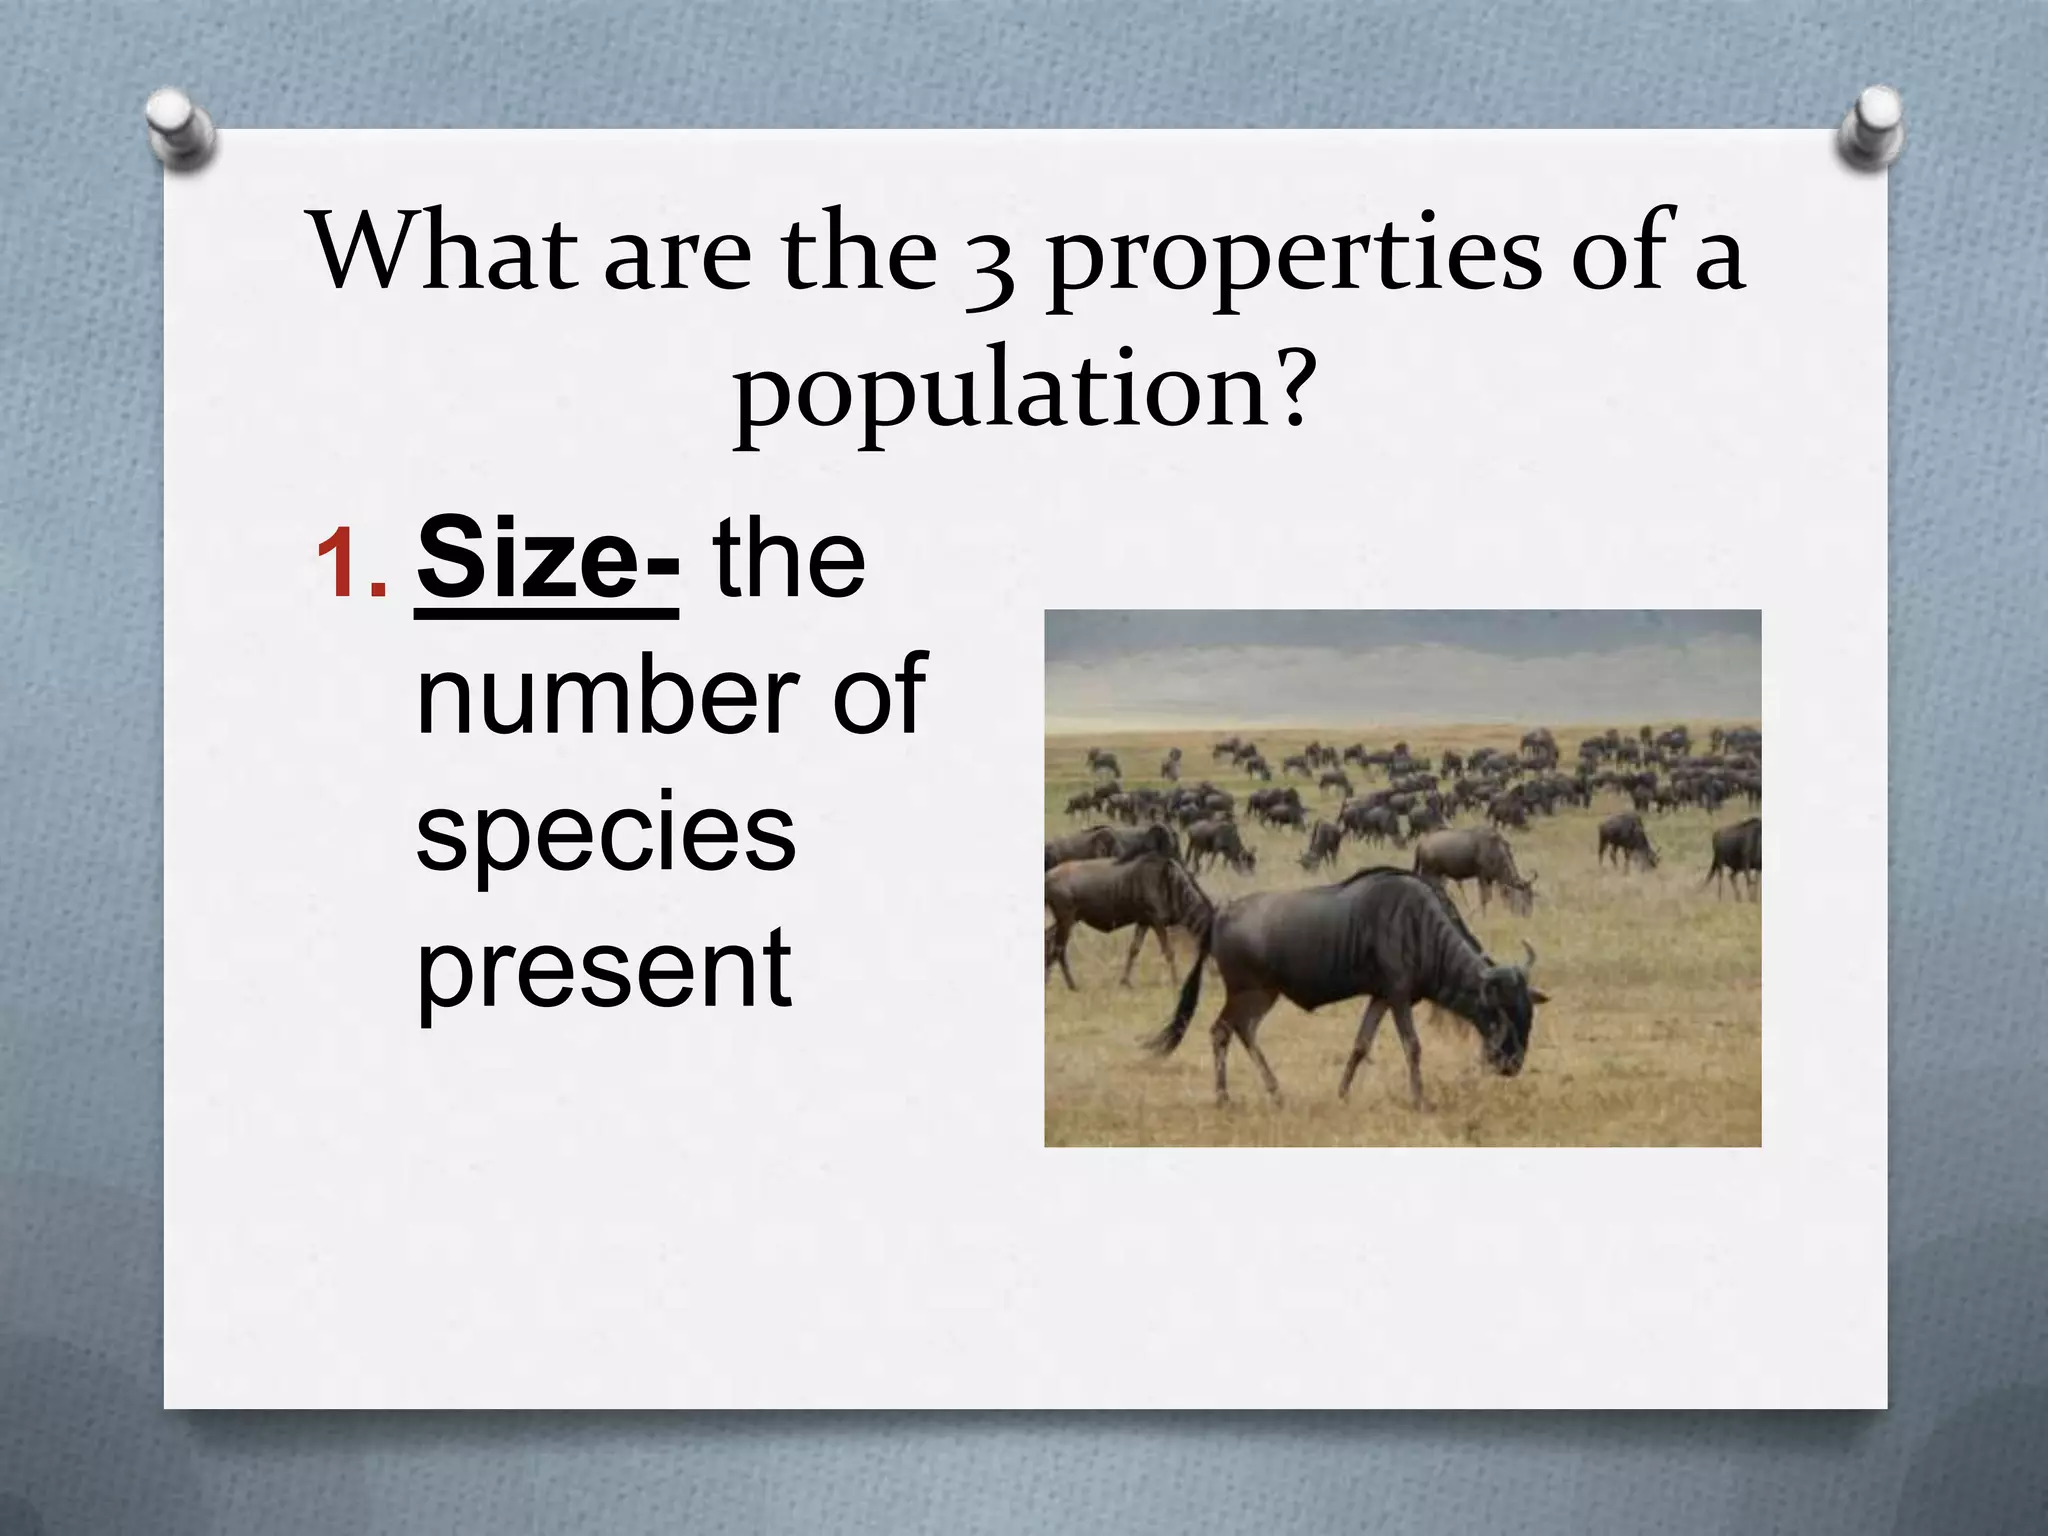
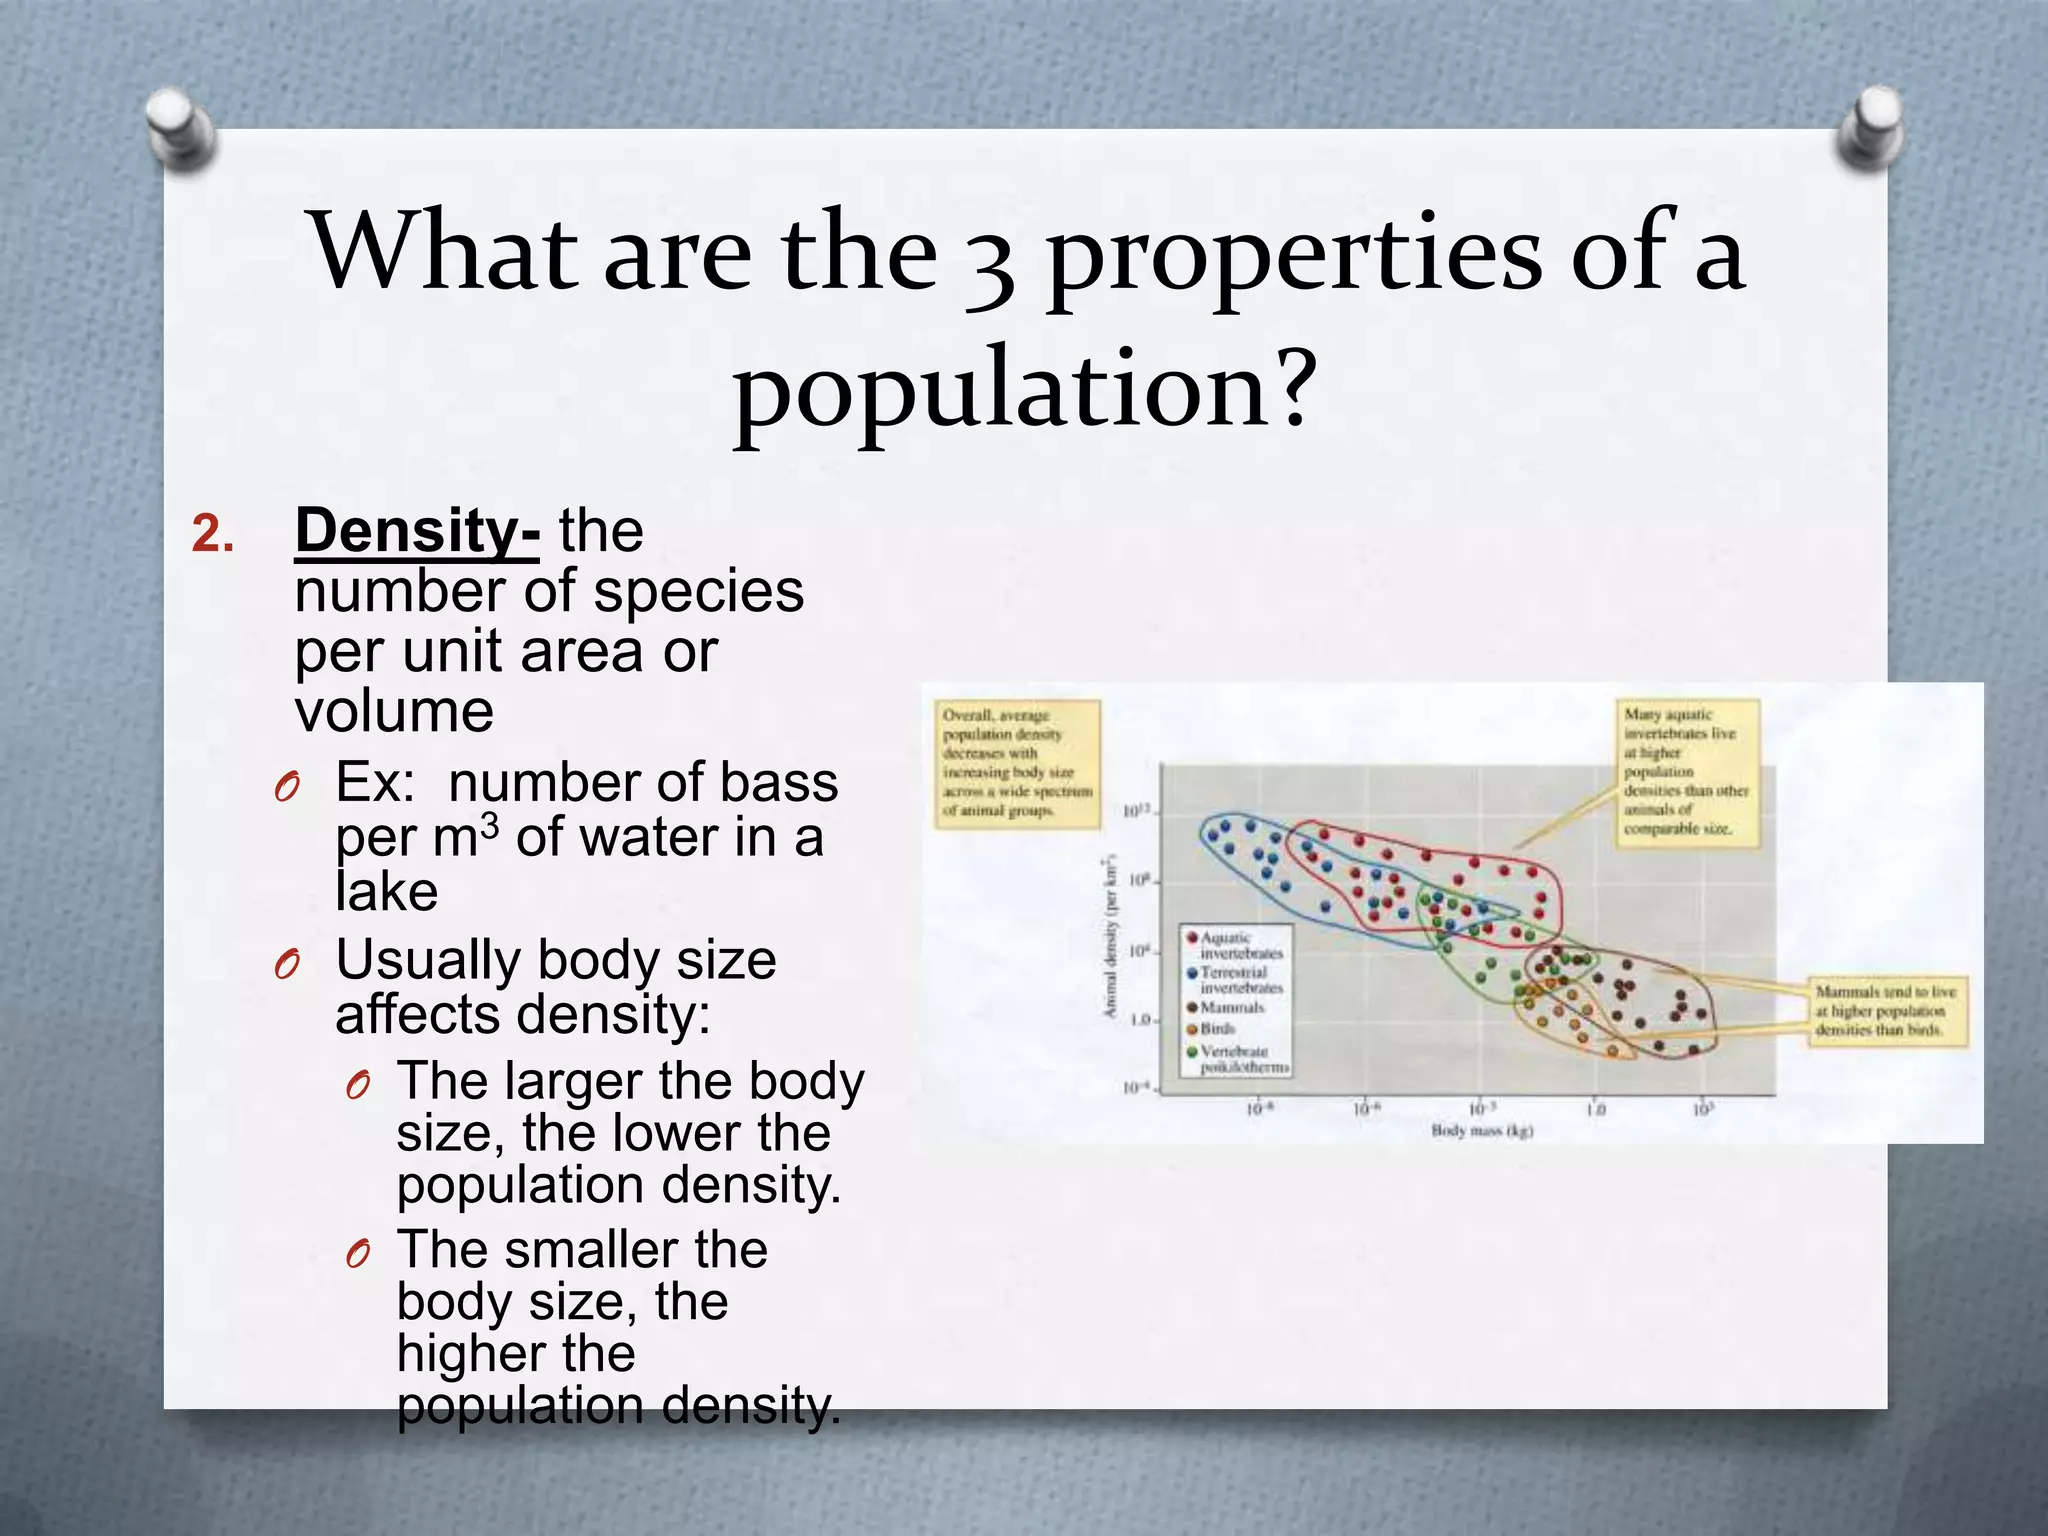
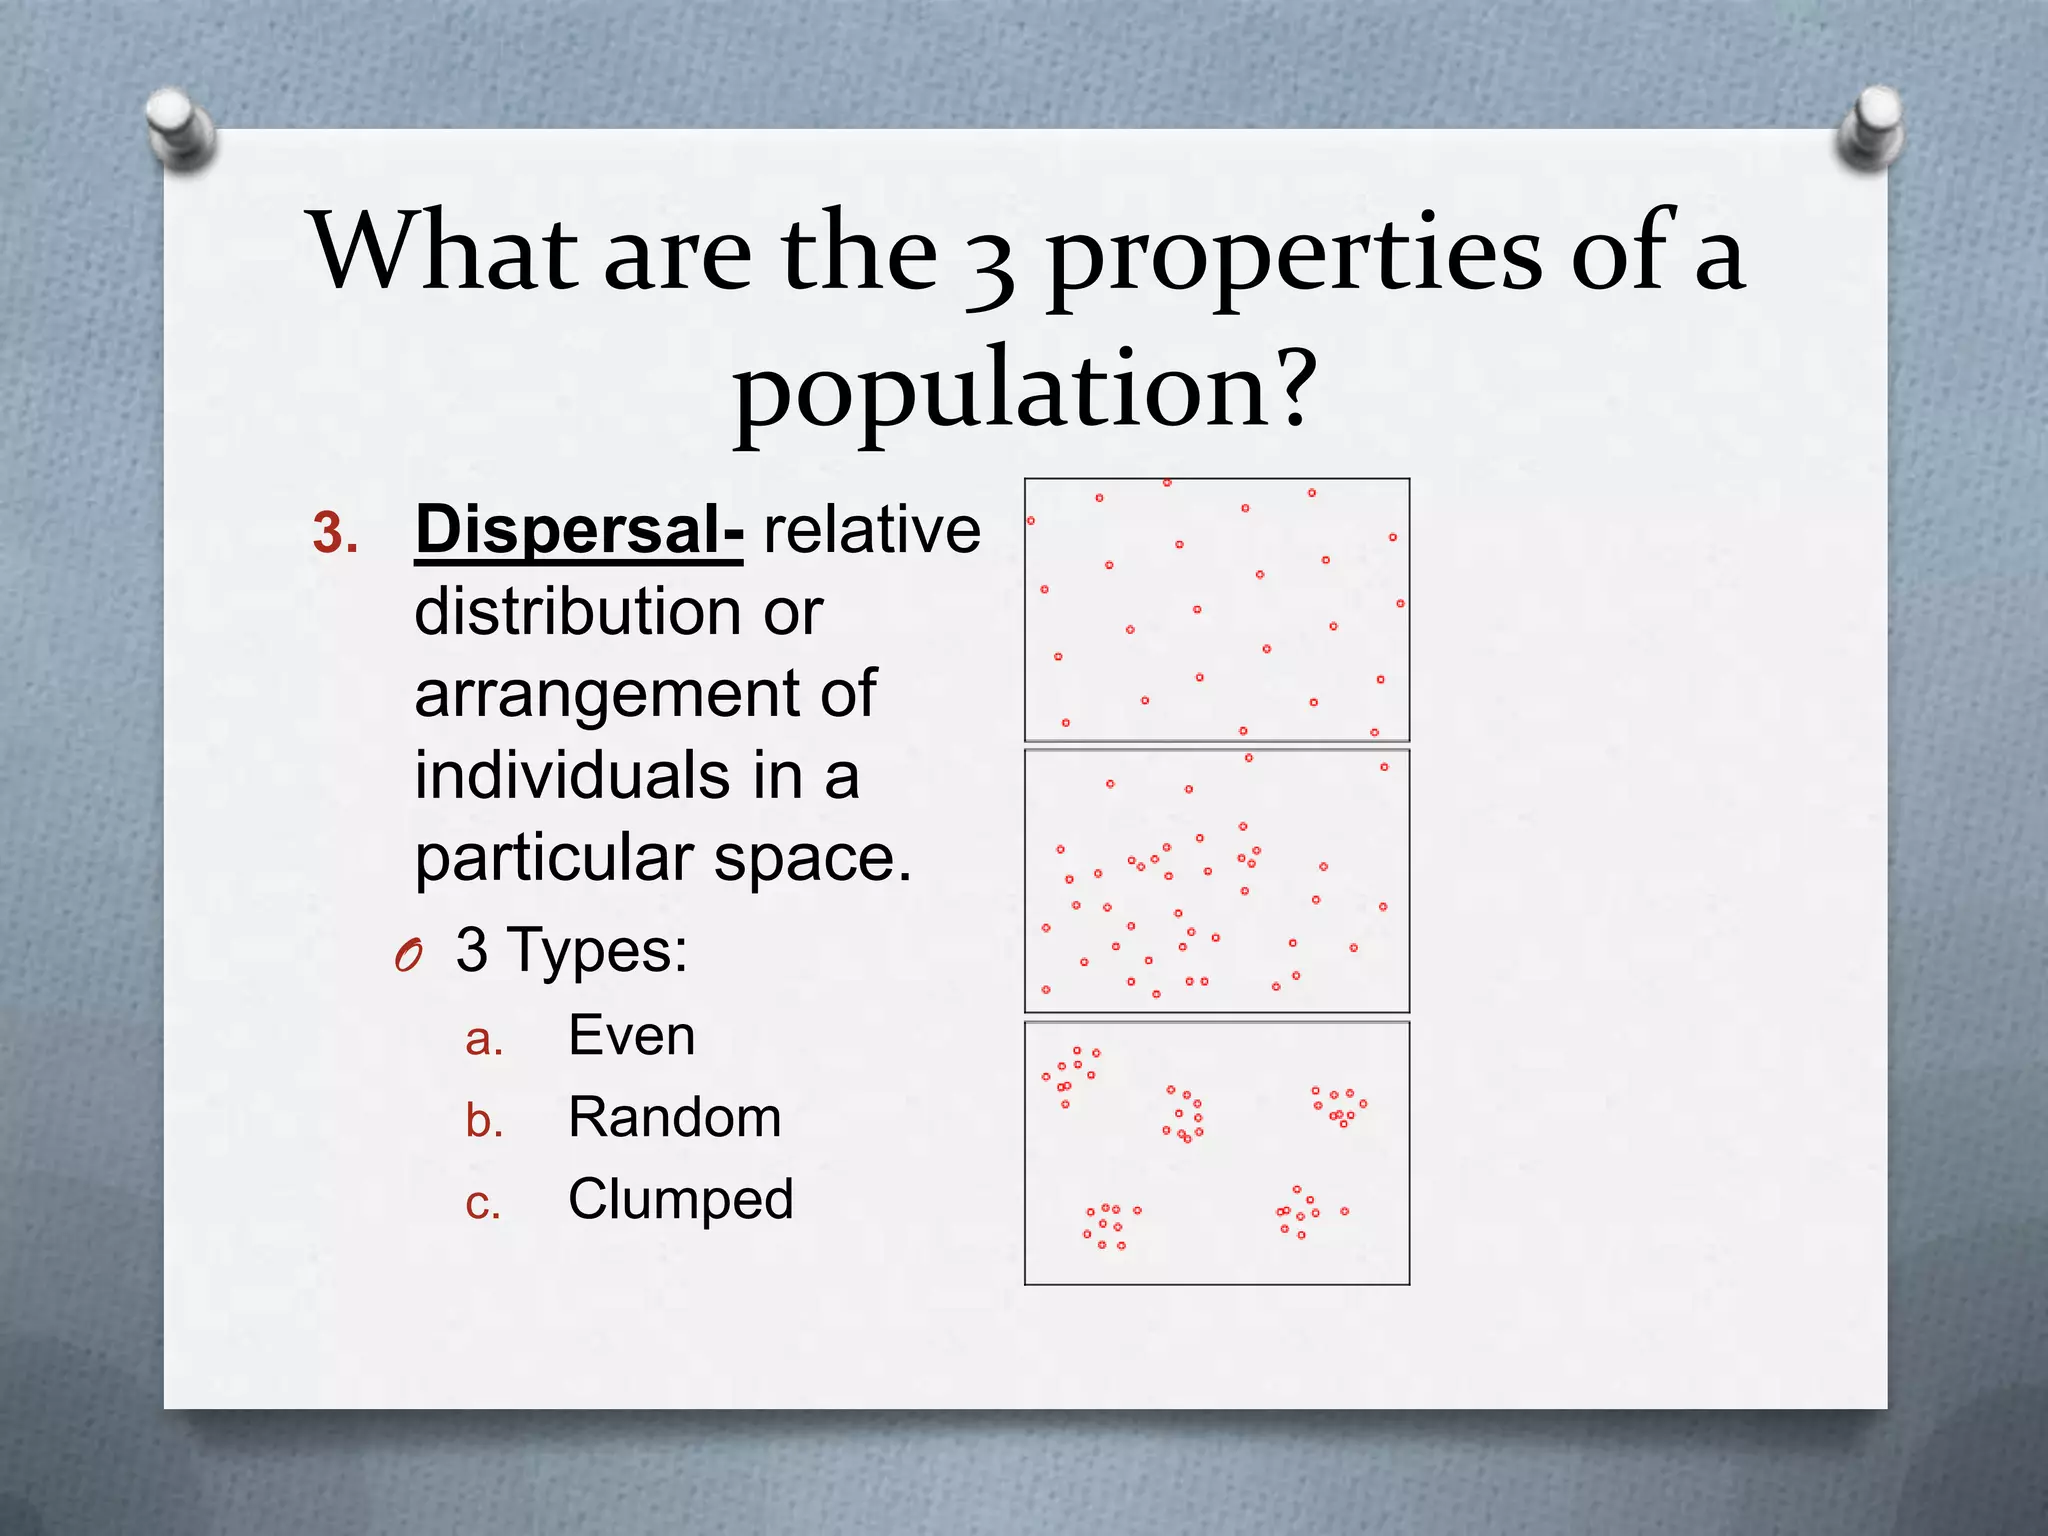
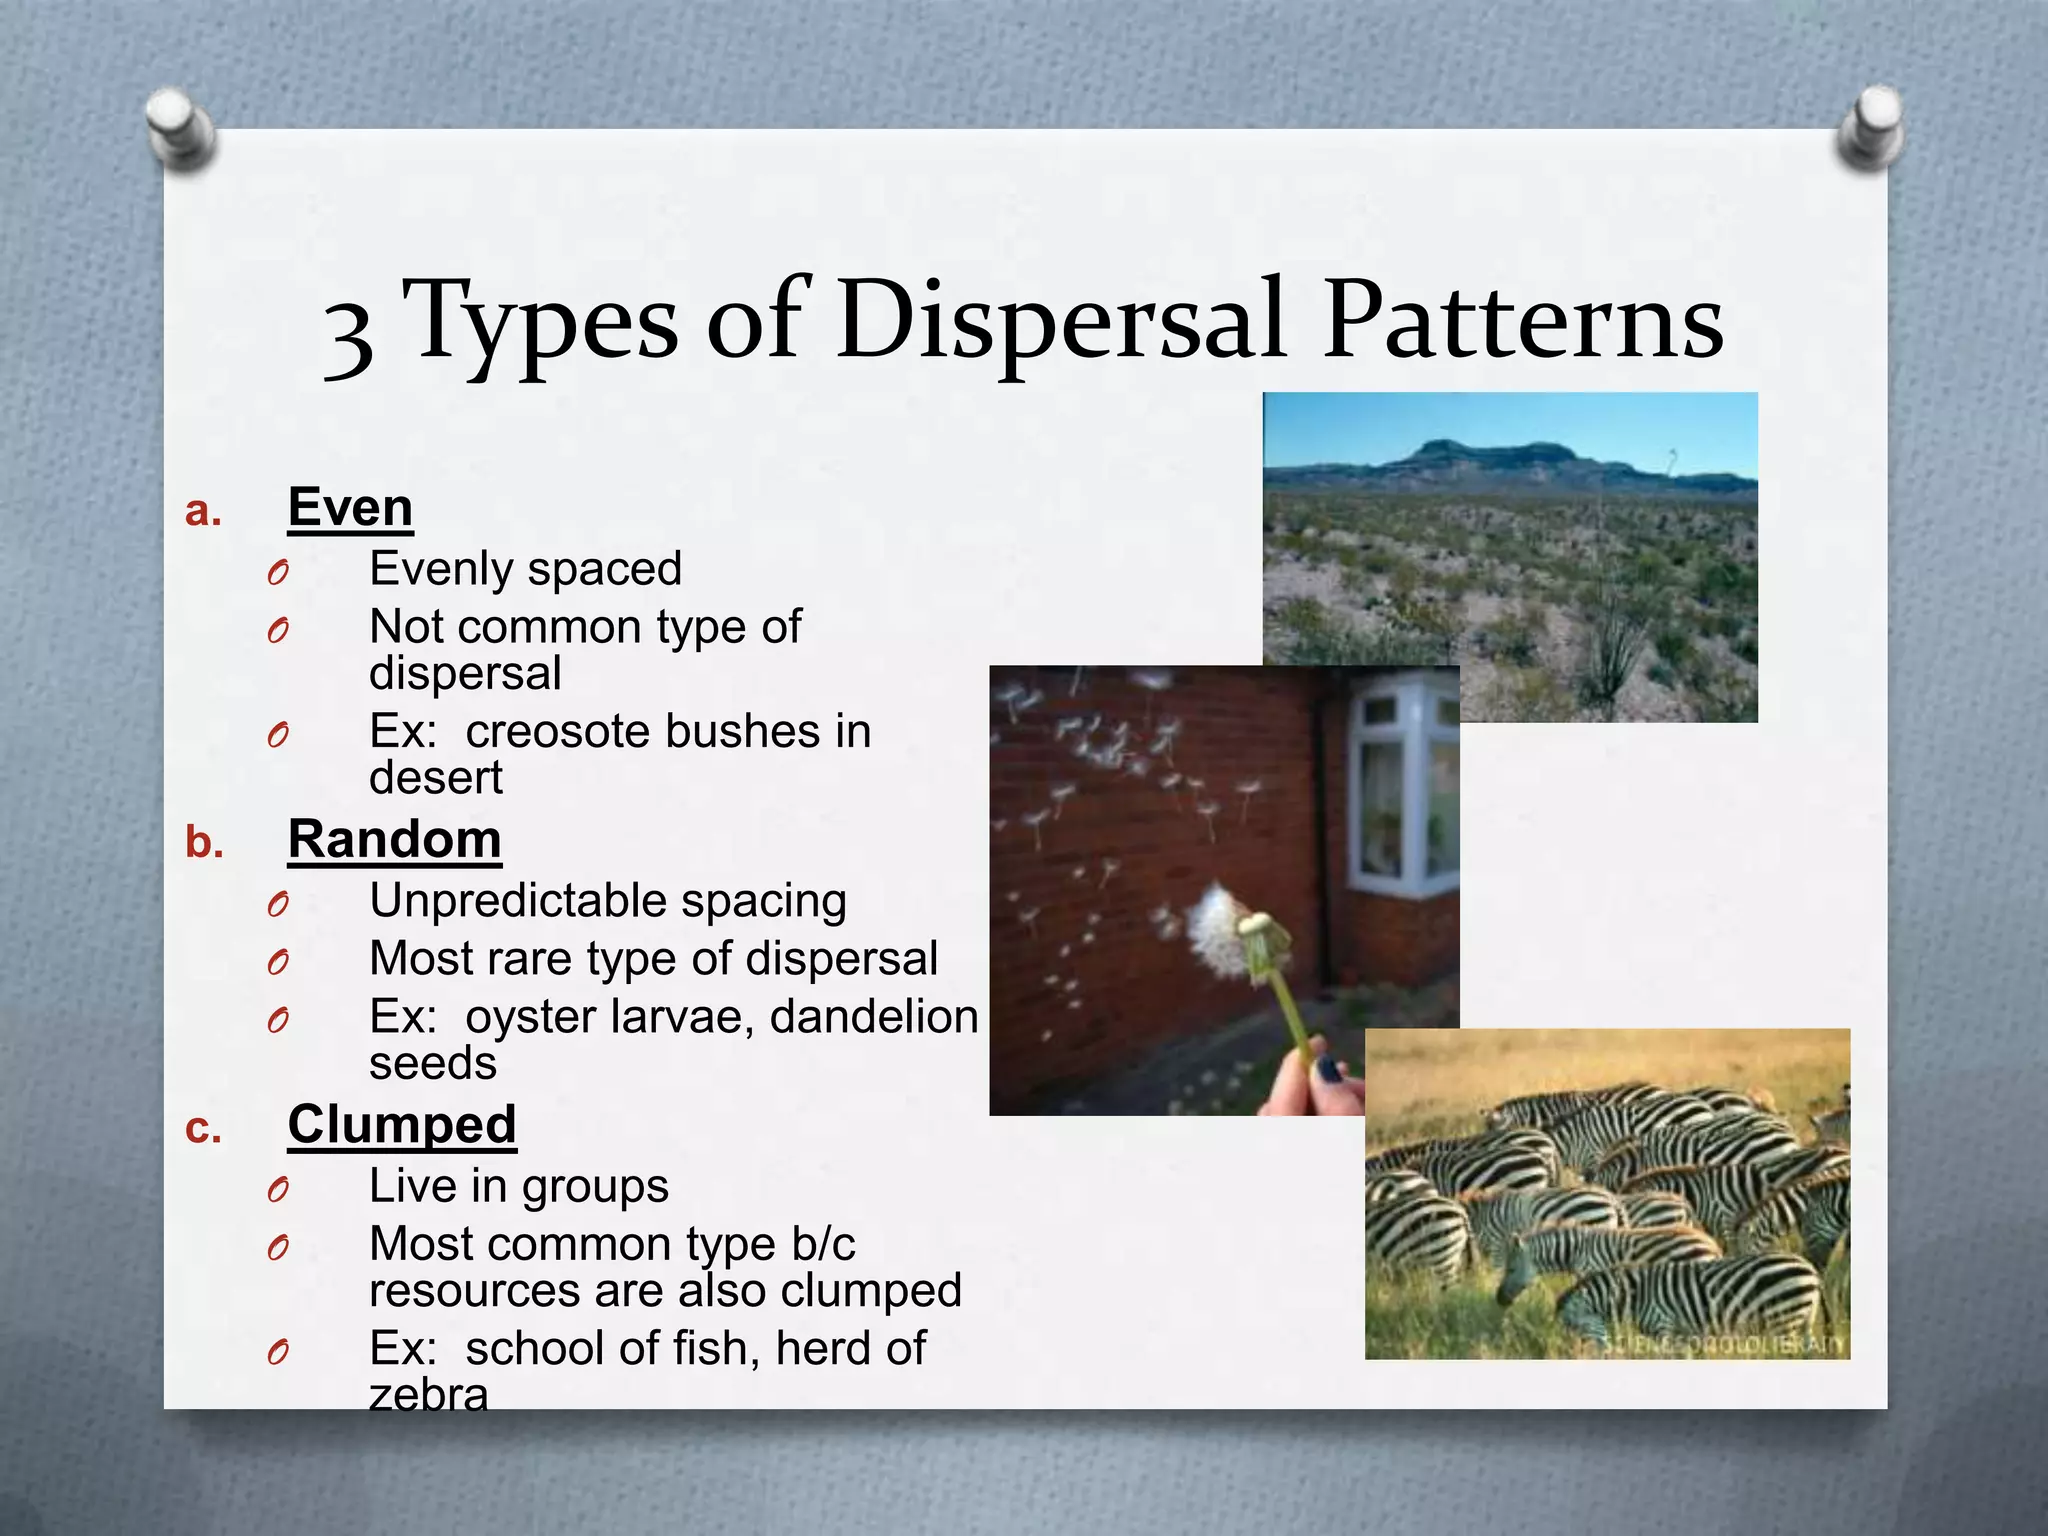
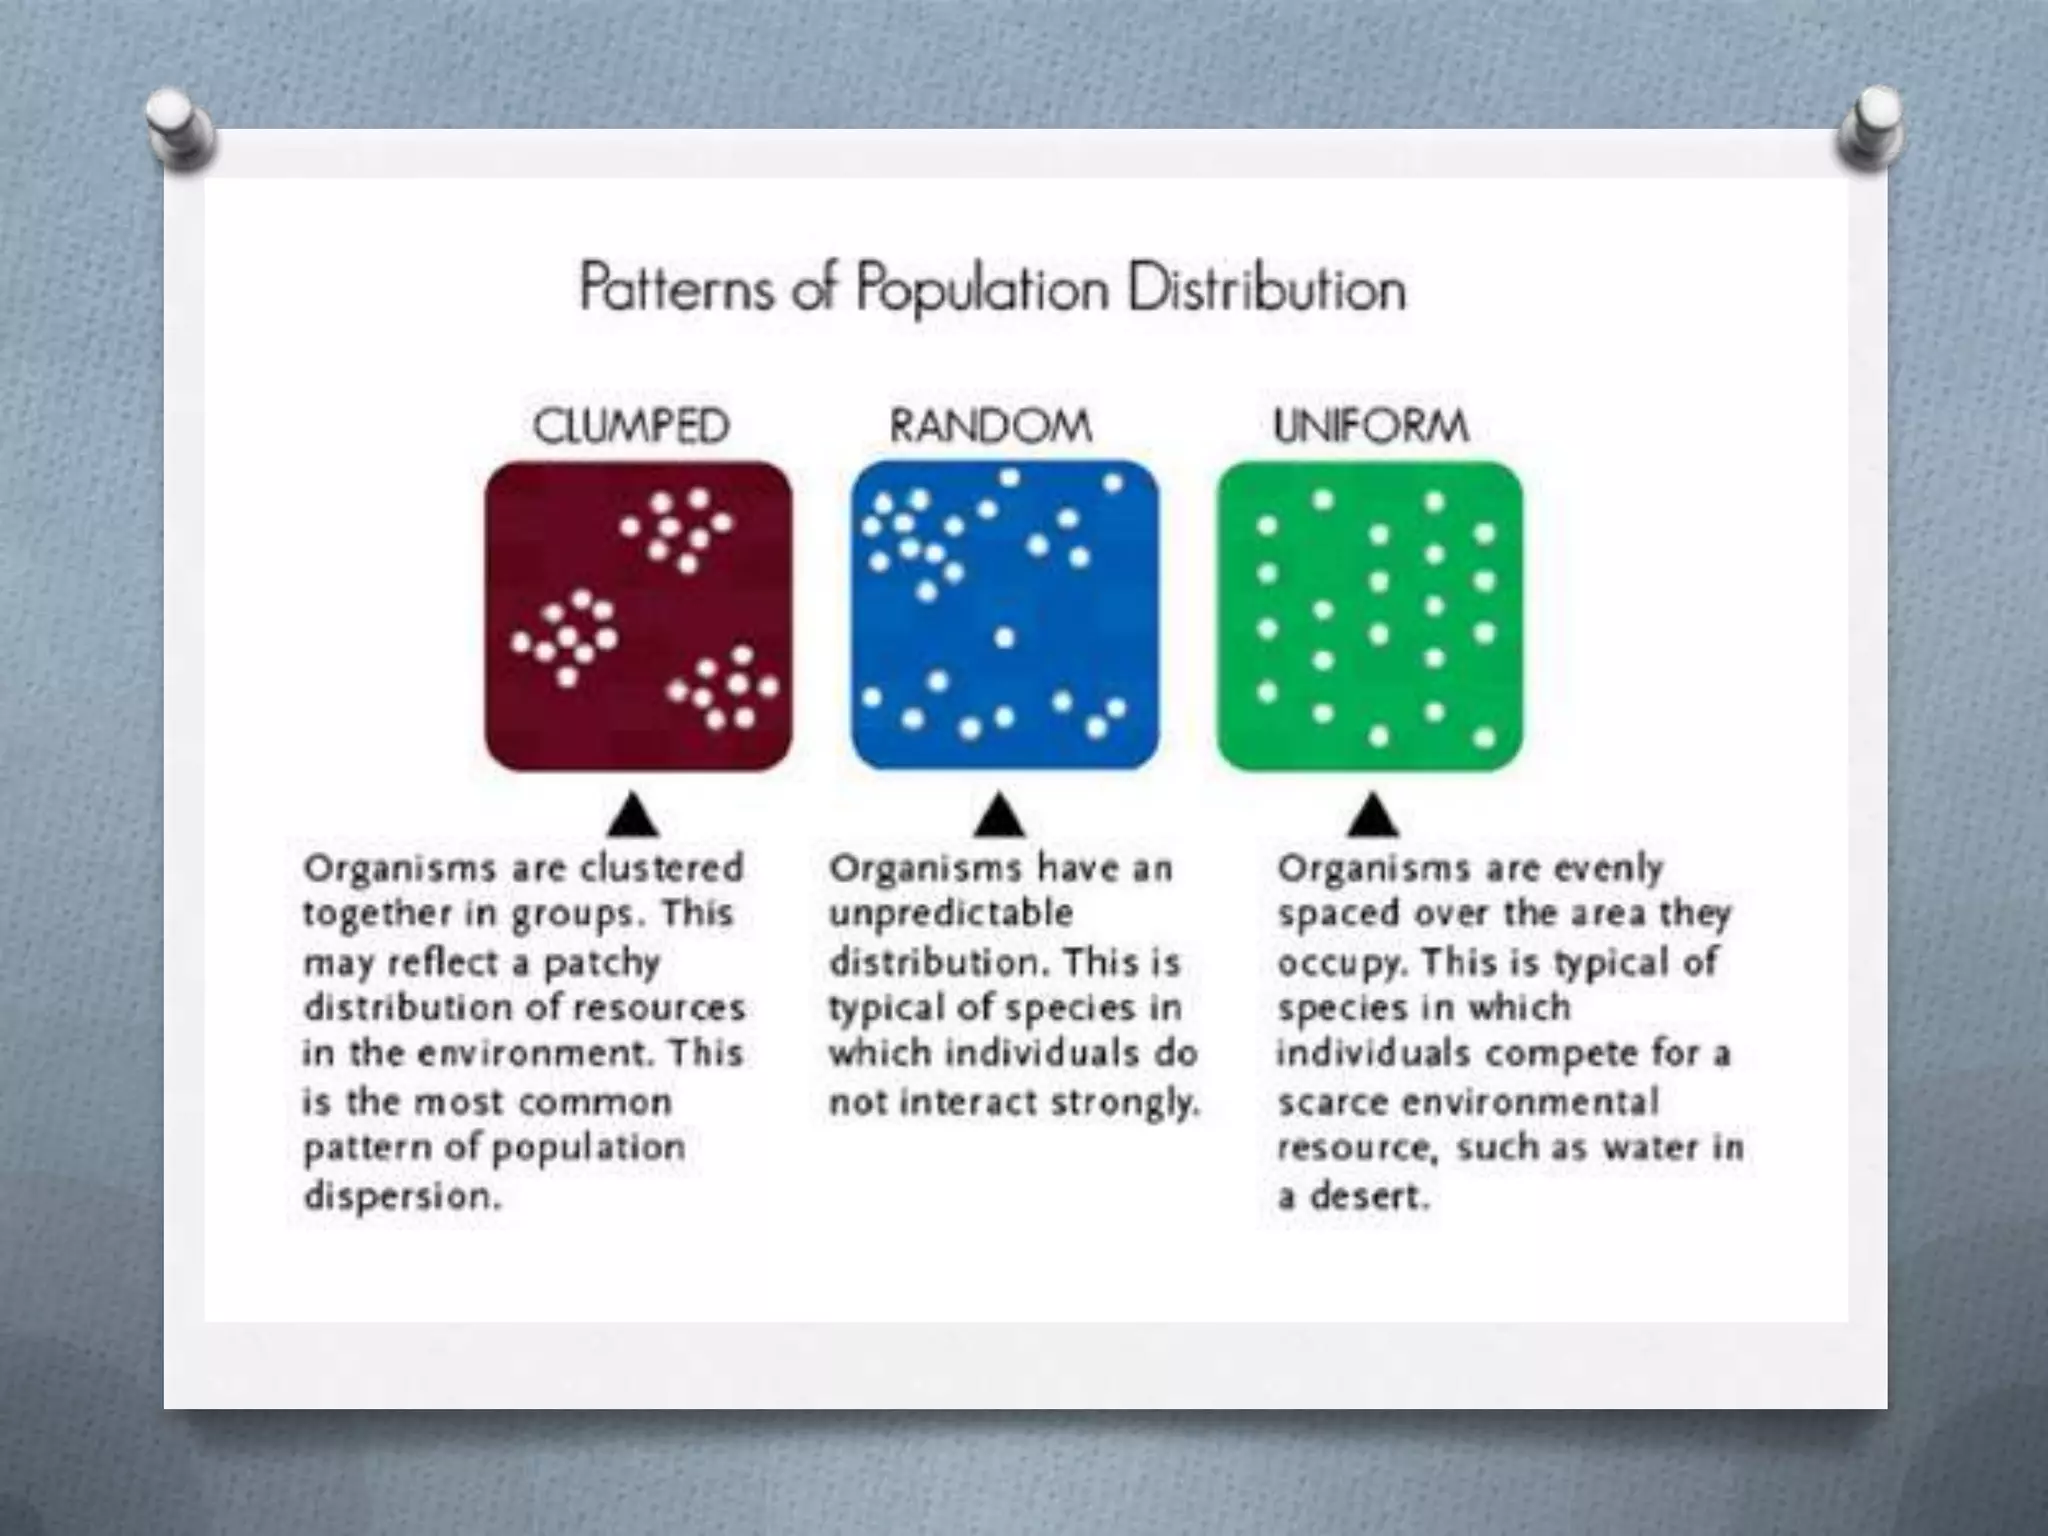
1) A population is defined as all members of a species living together in the same area and capable of interbreeding. The 3 properties of a population are its size, density, and dispersal pattern.
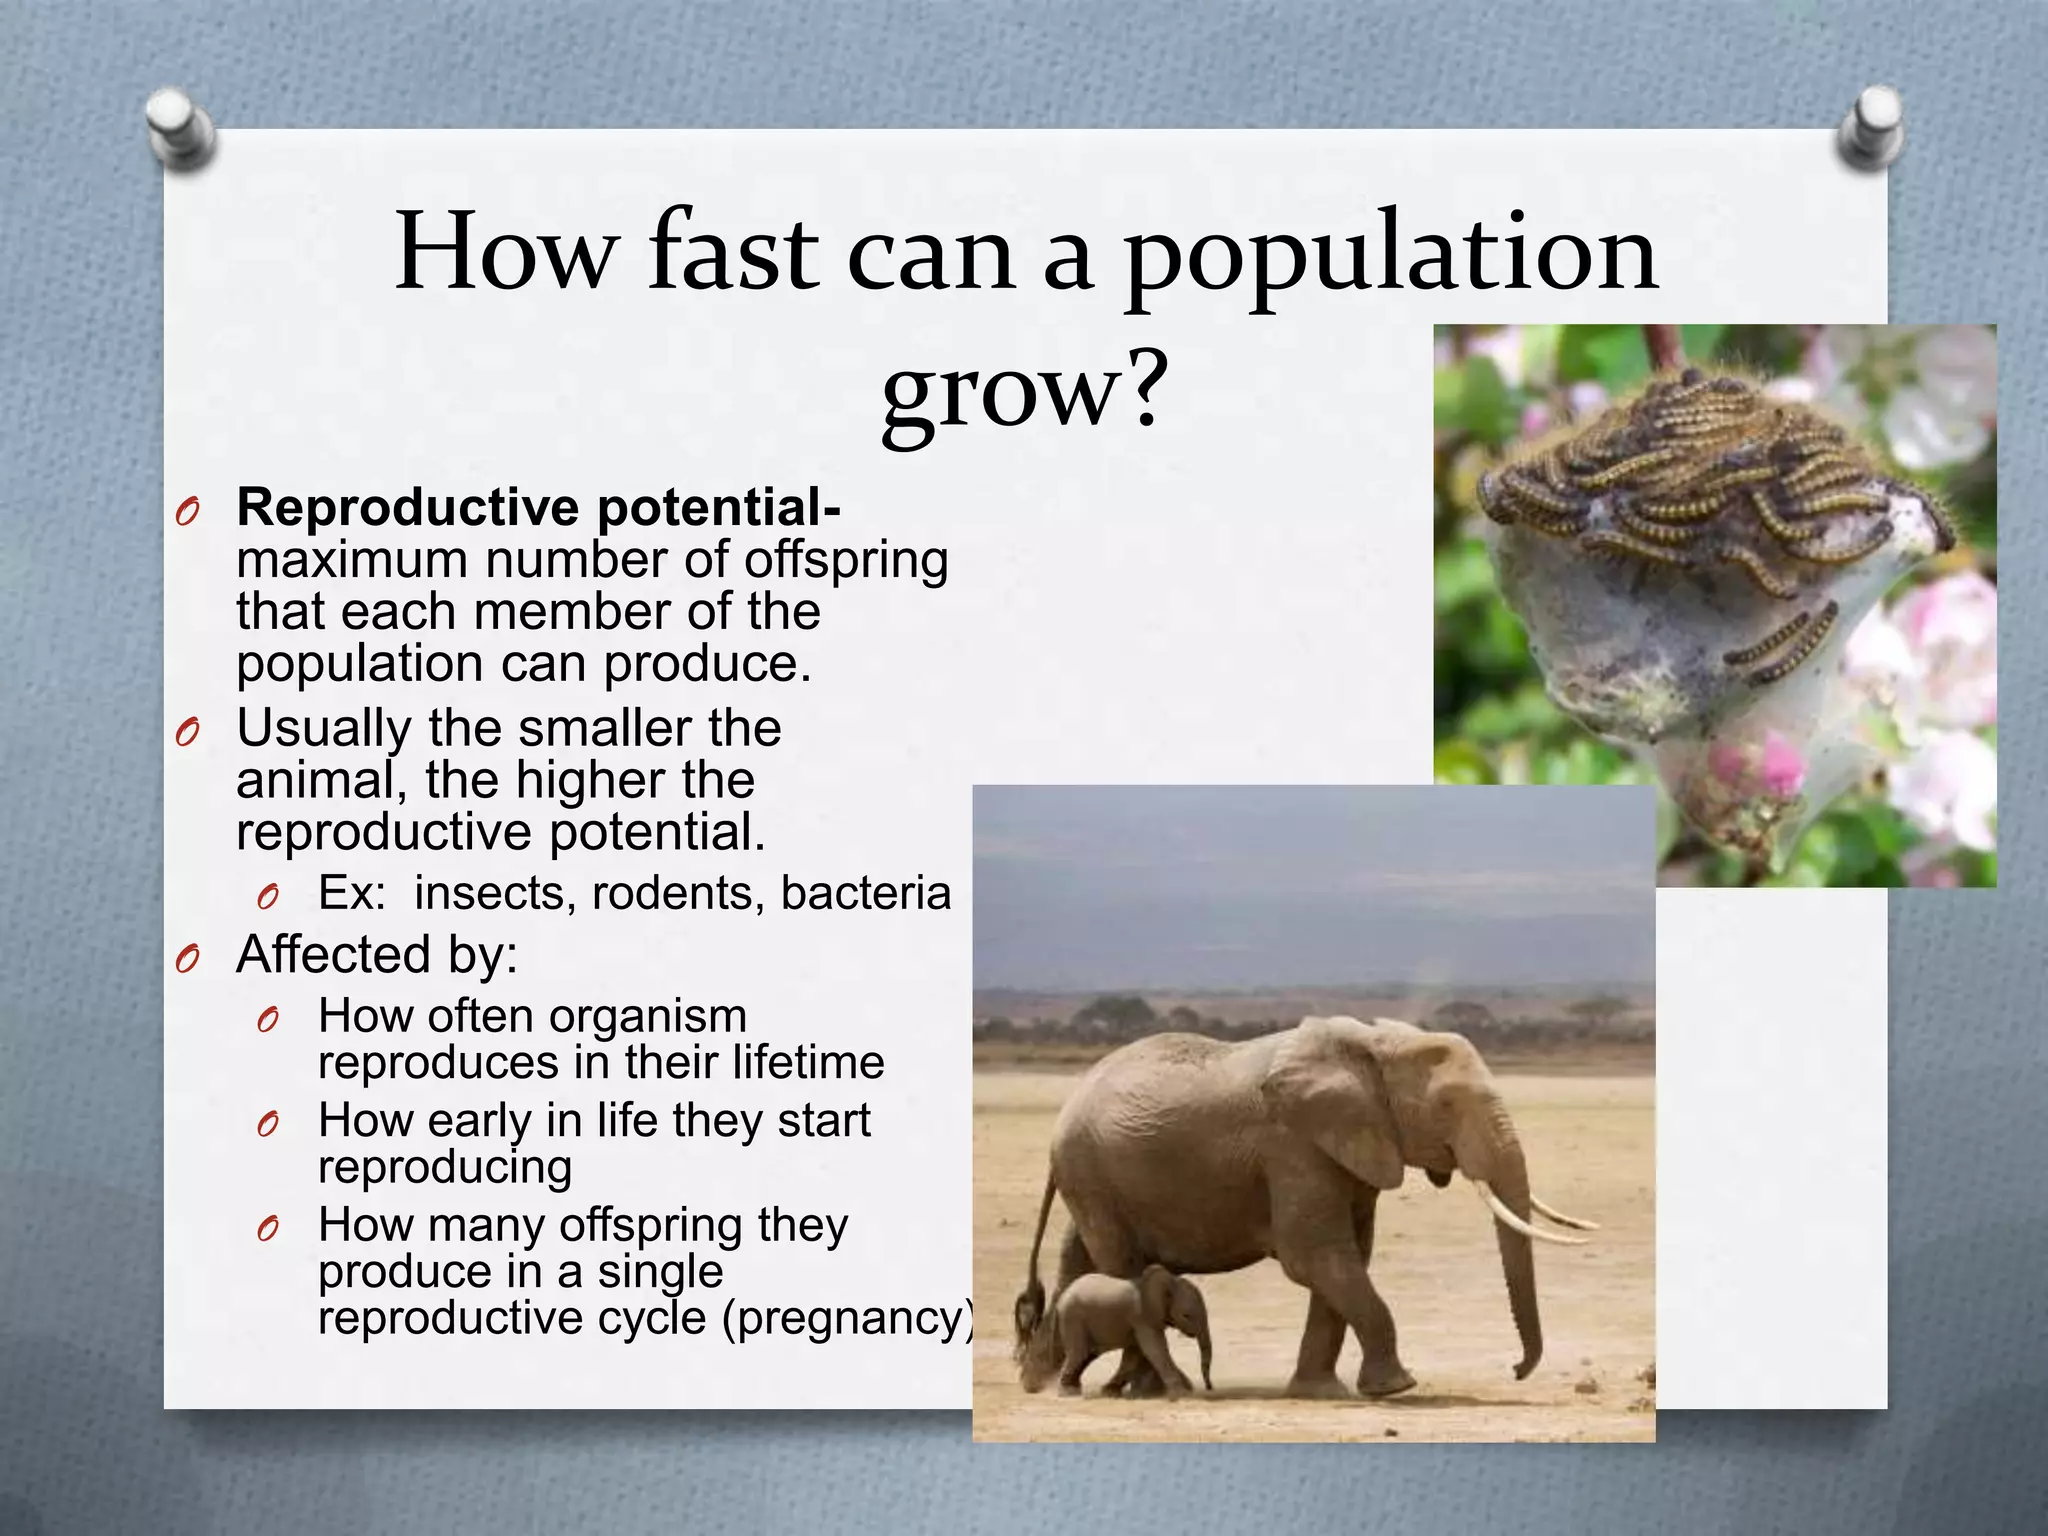
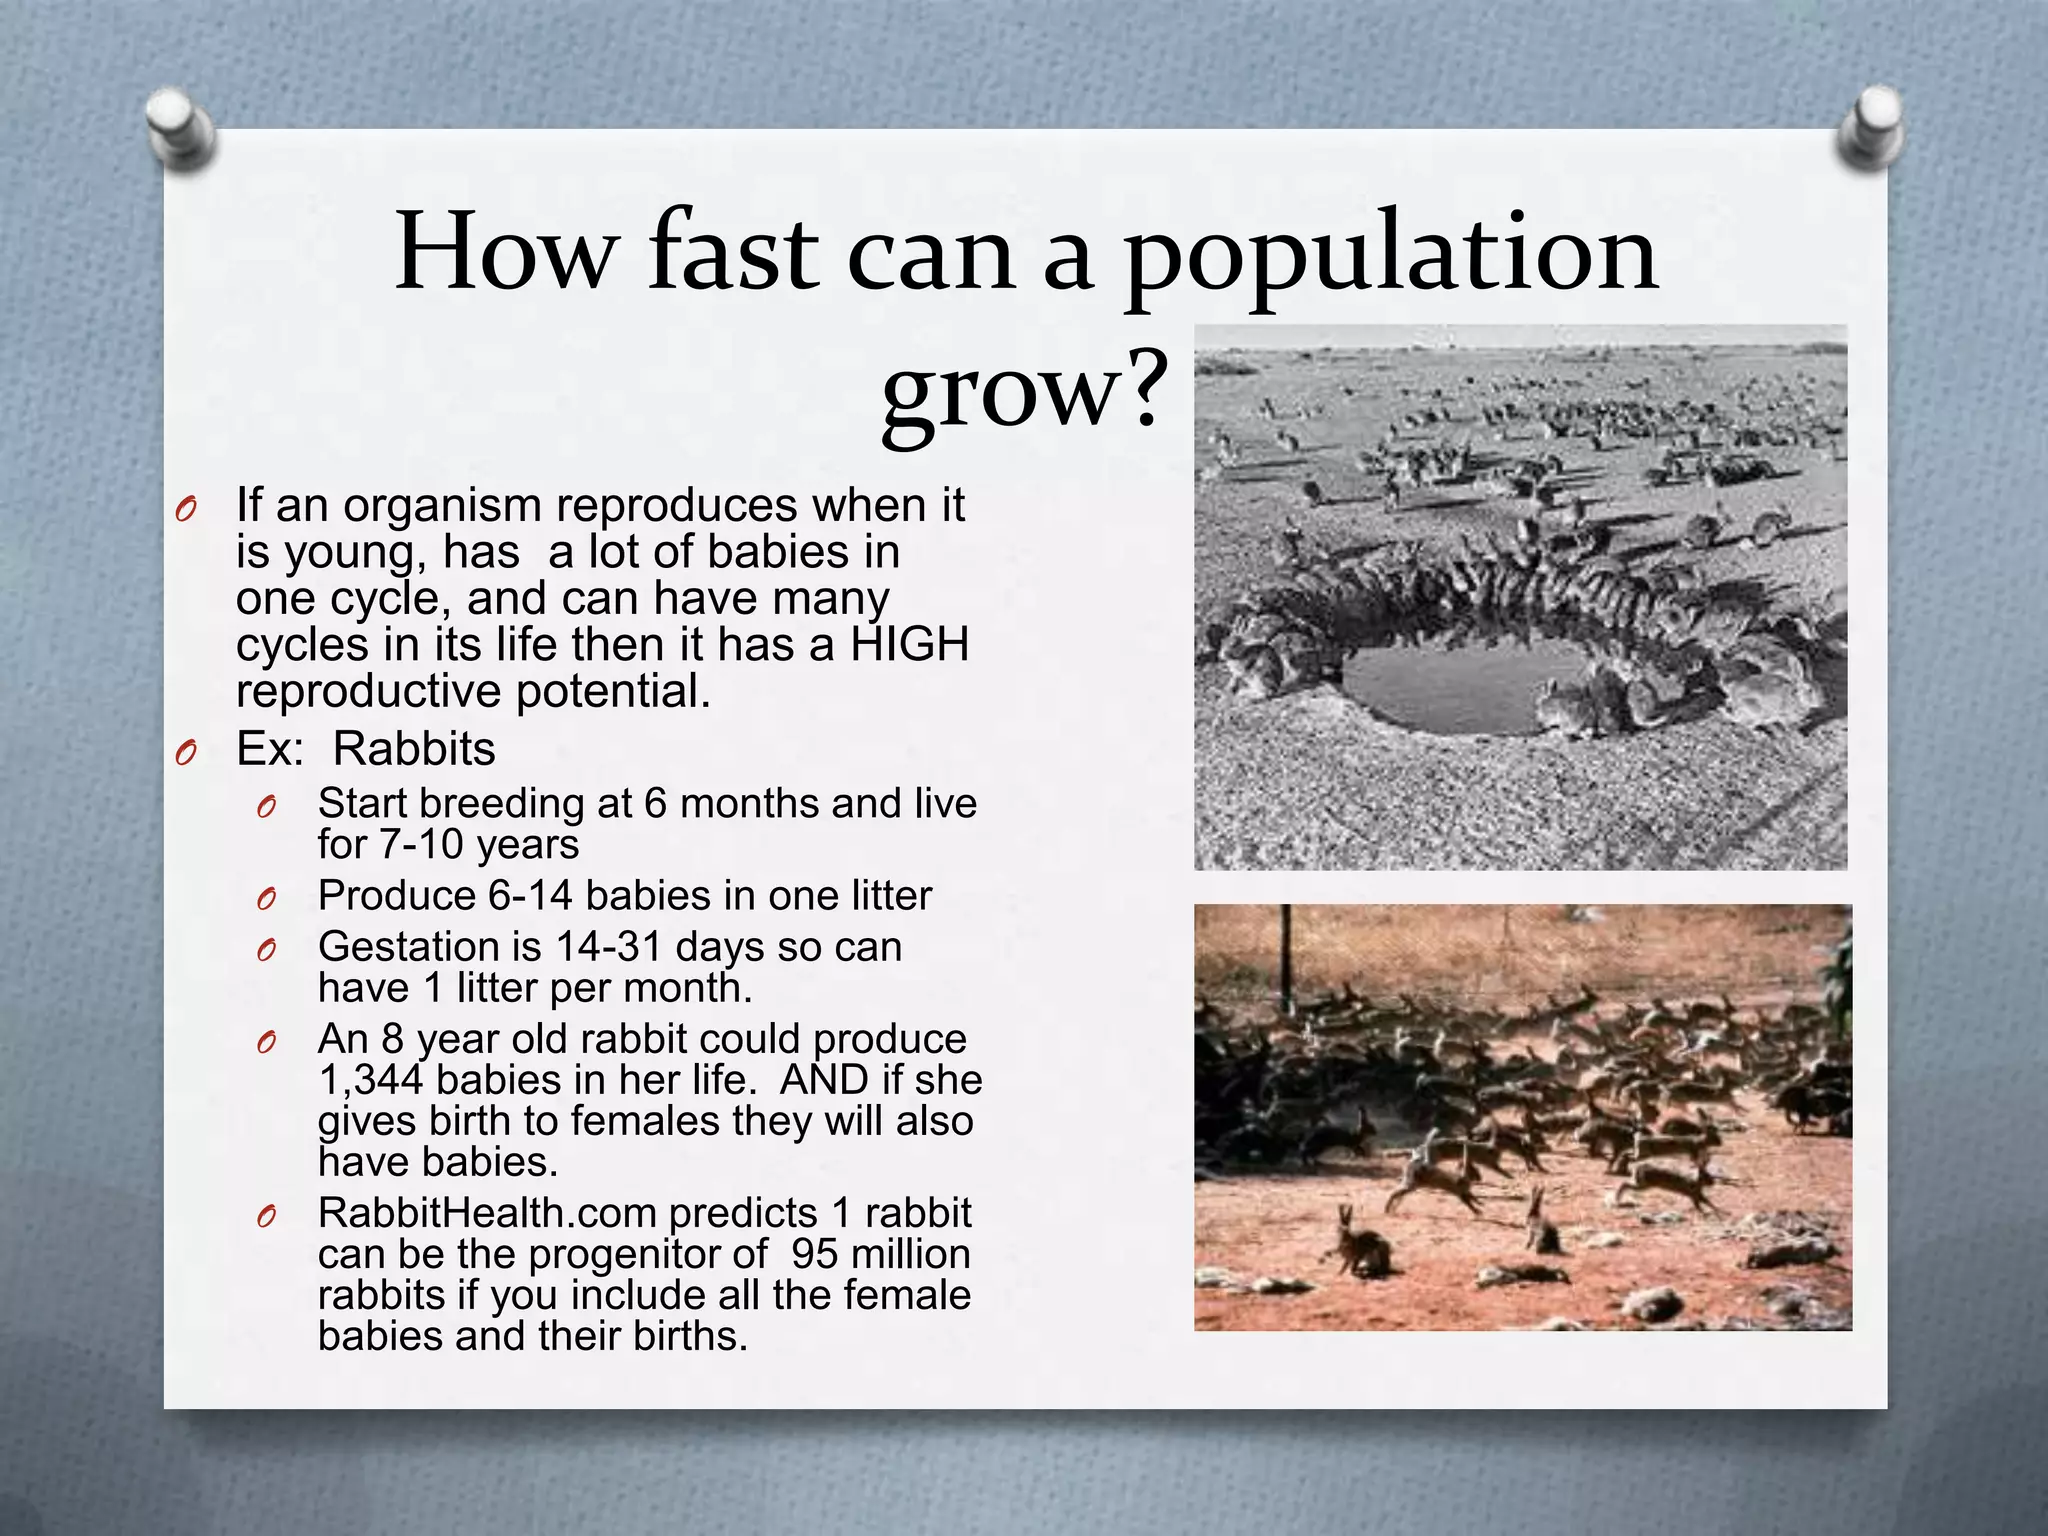
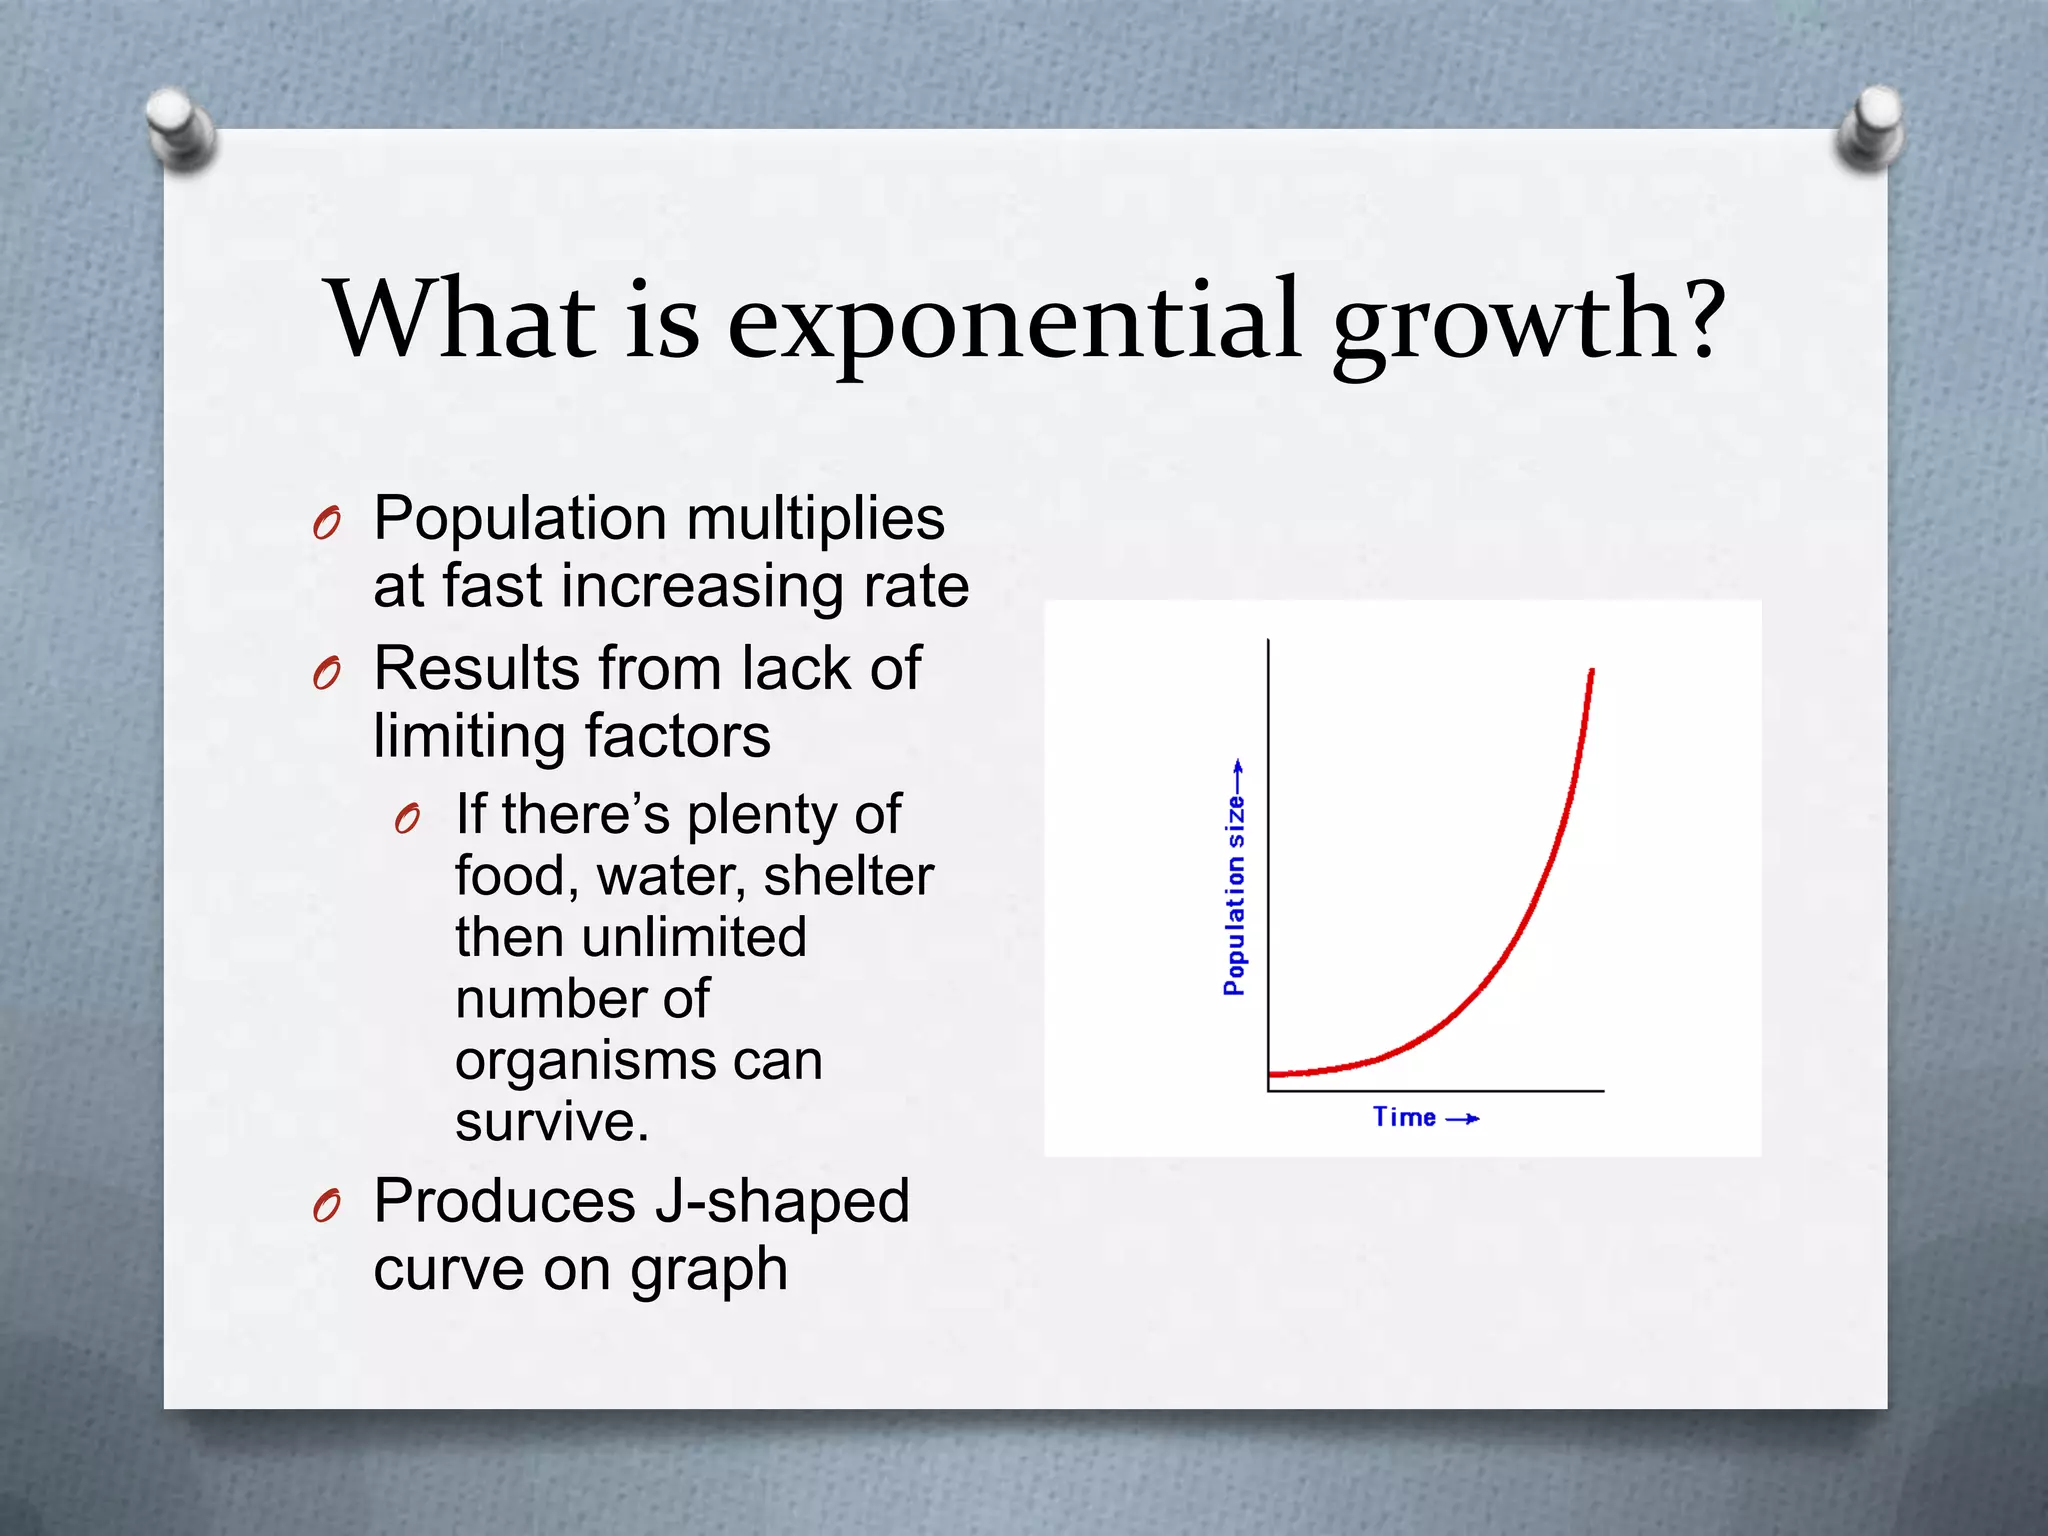
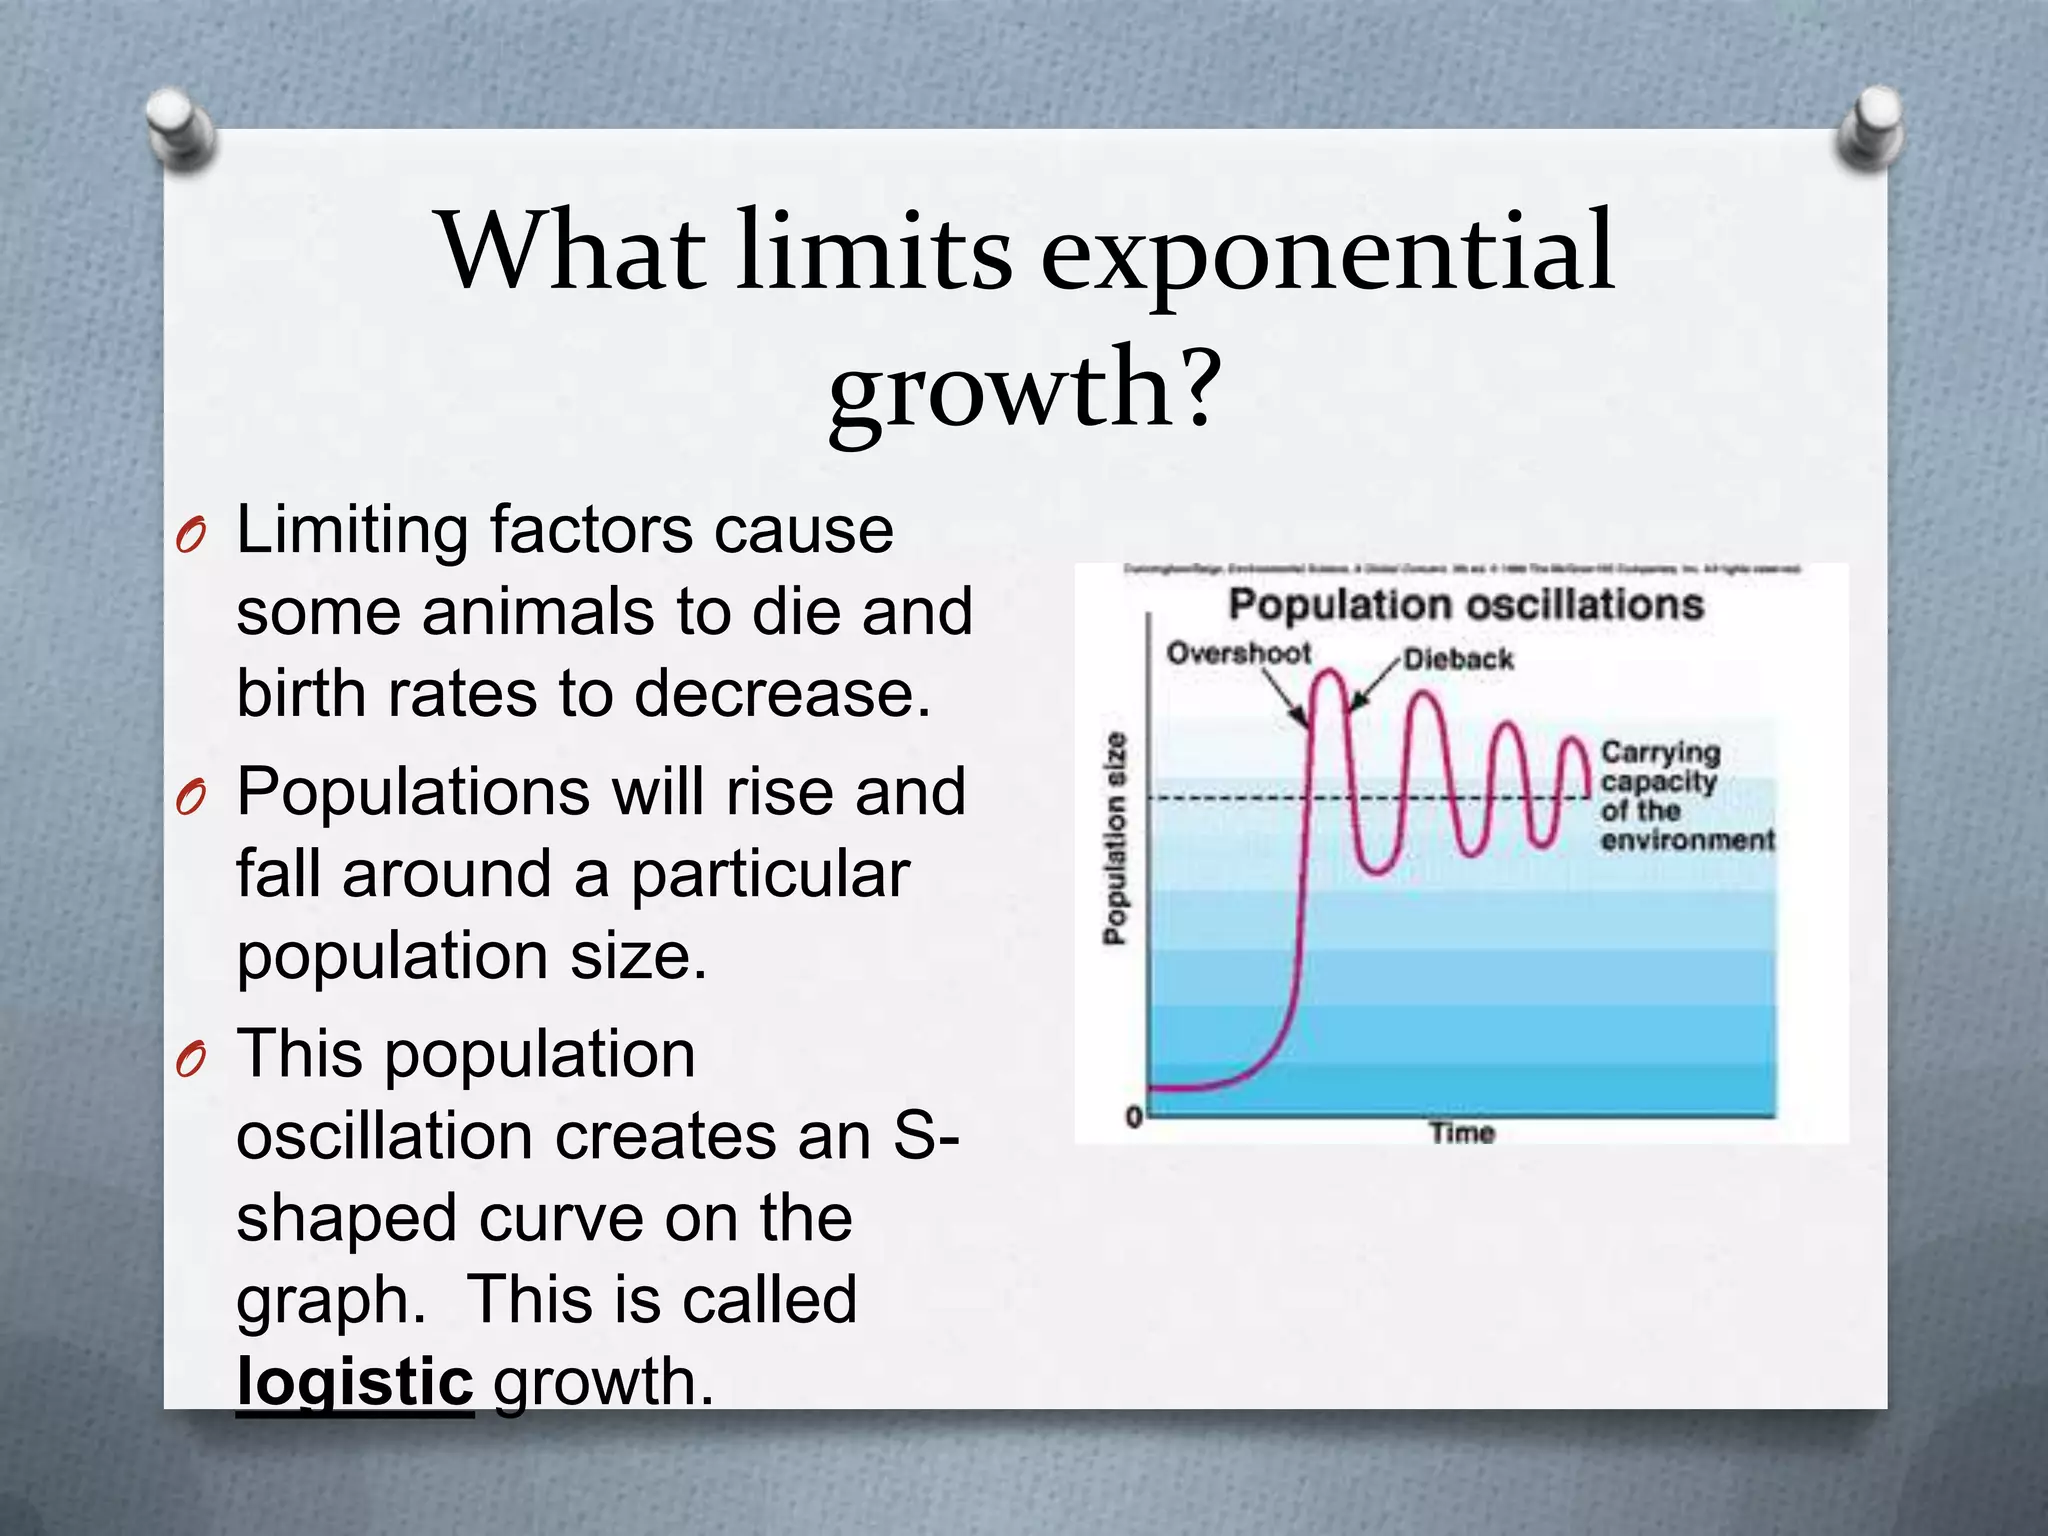
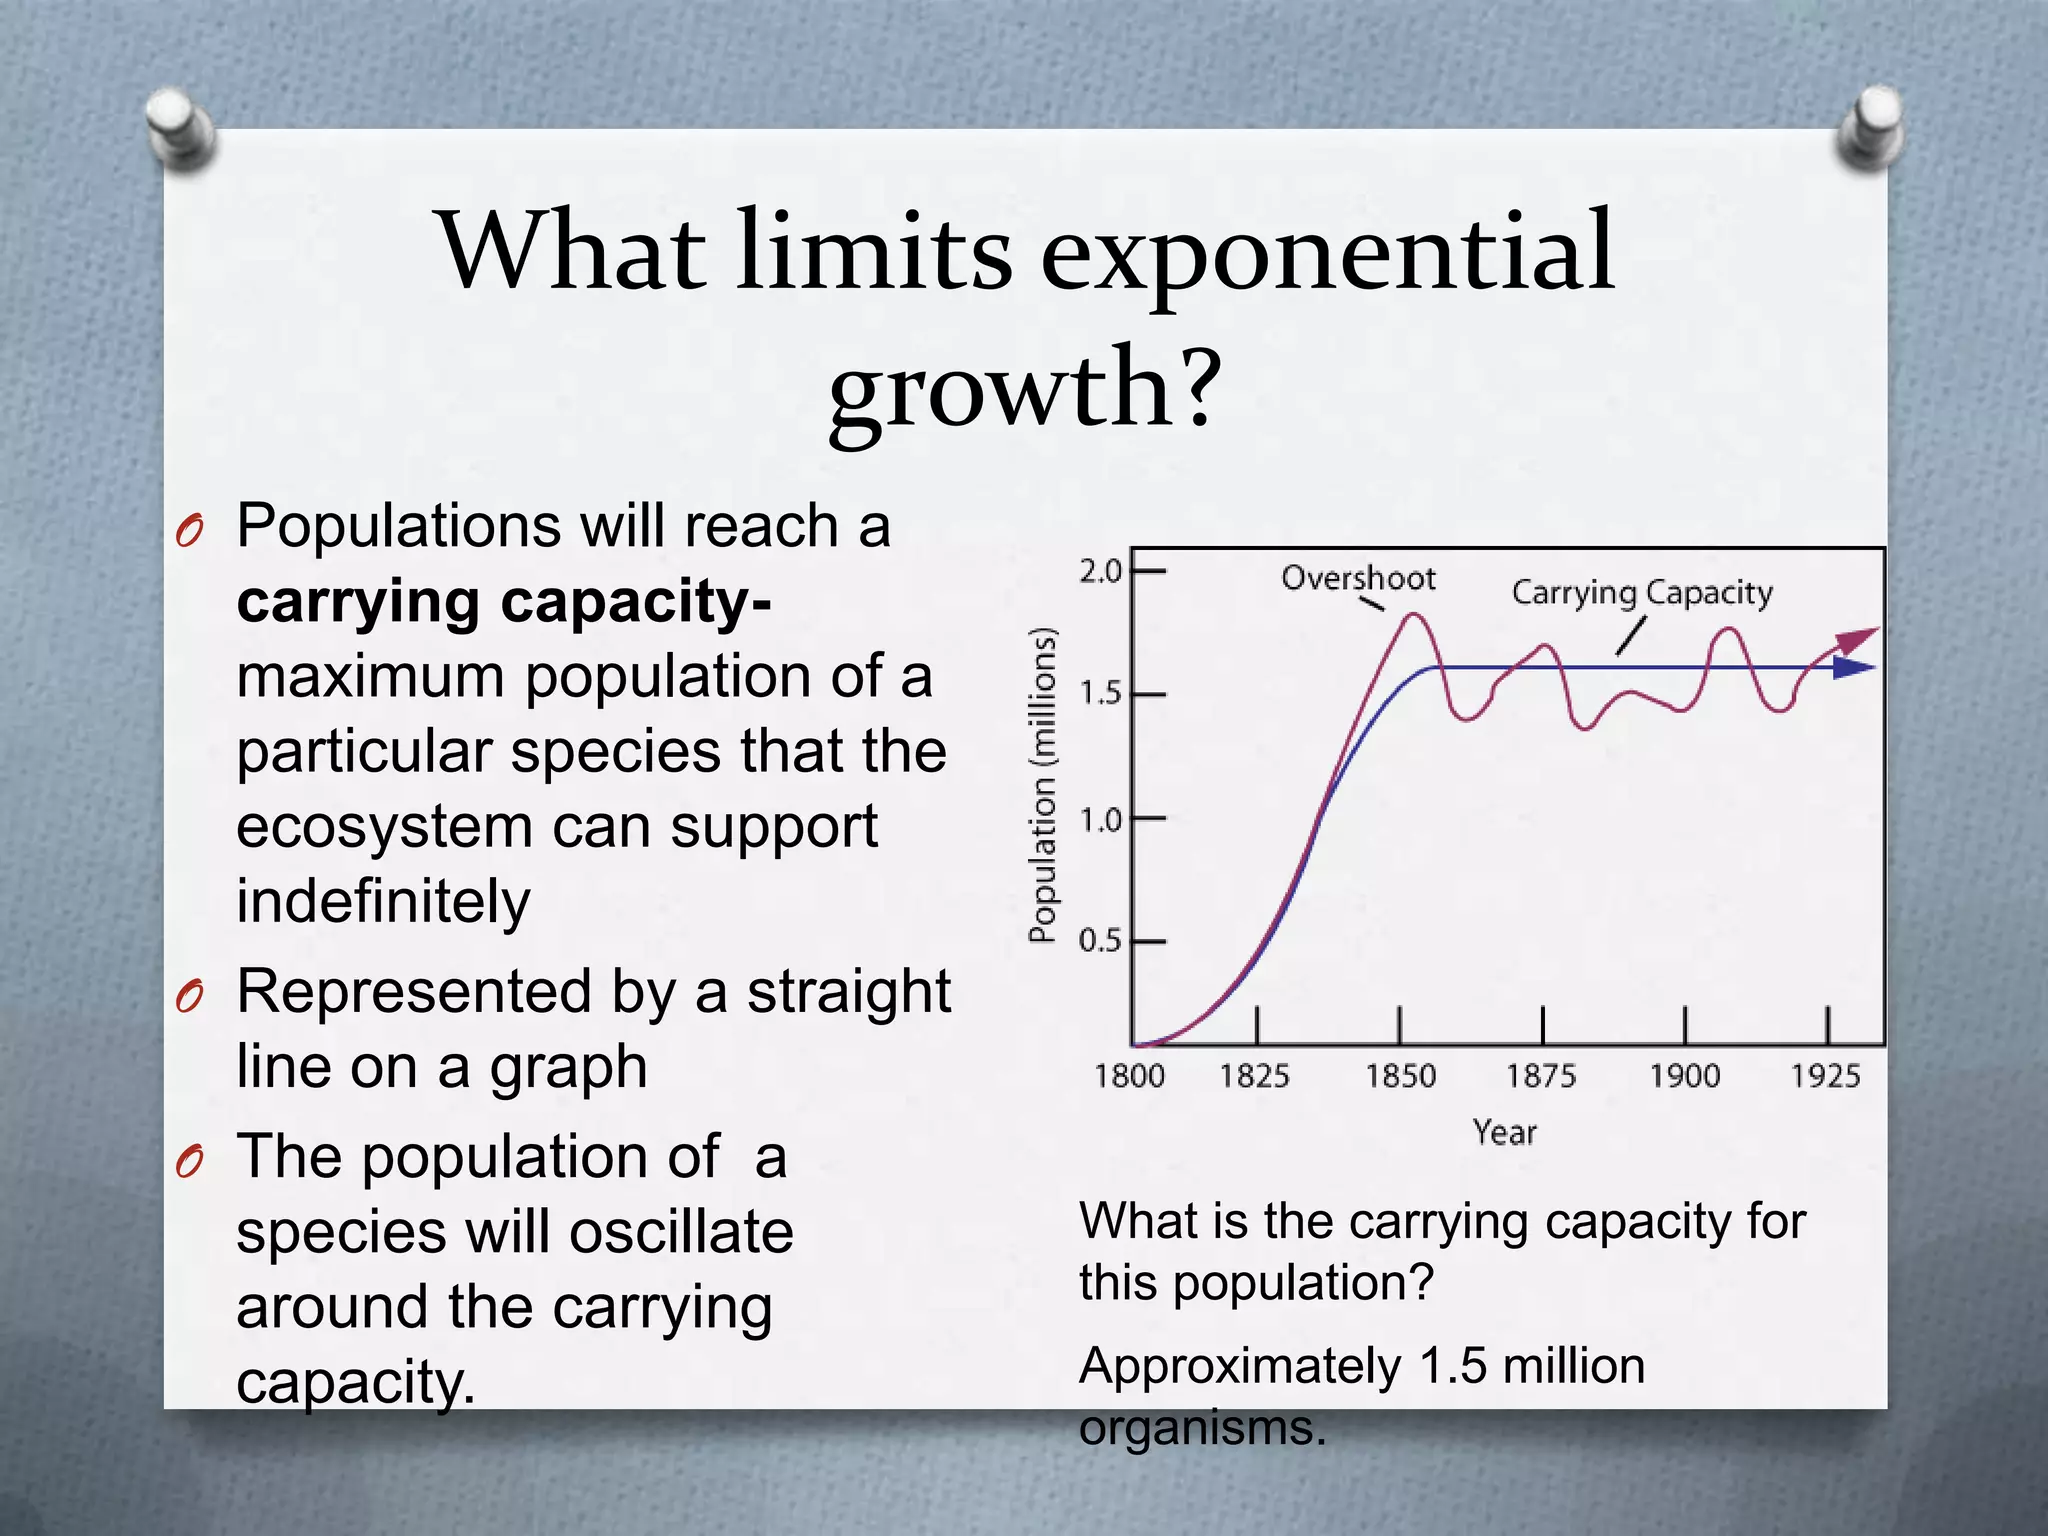
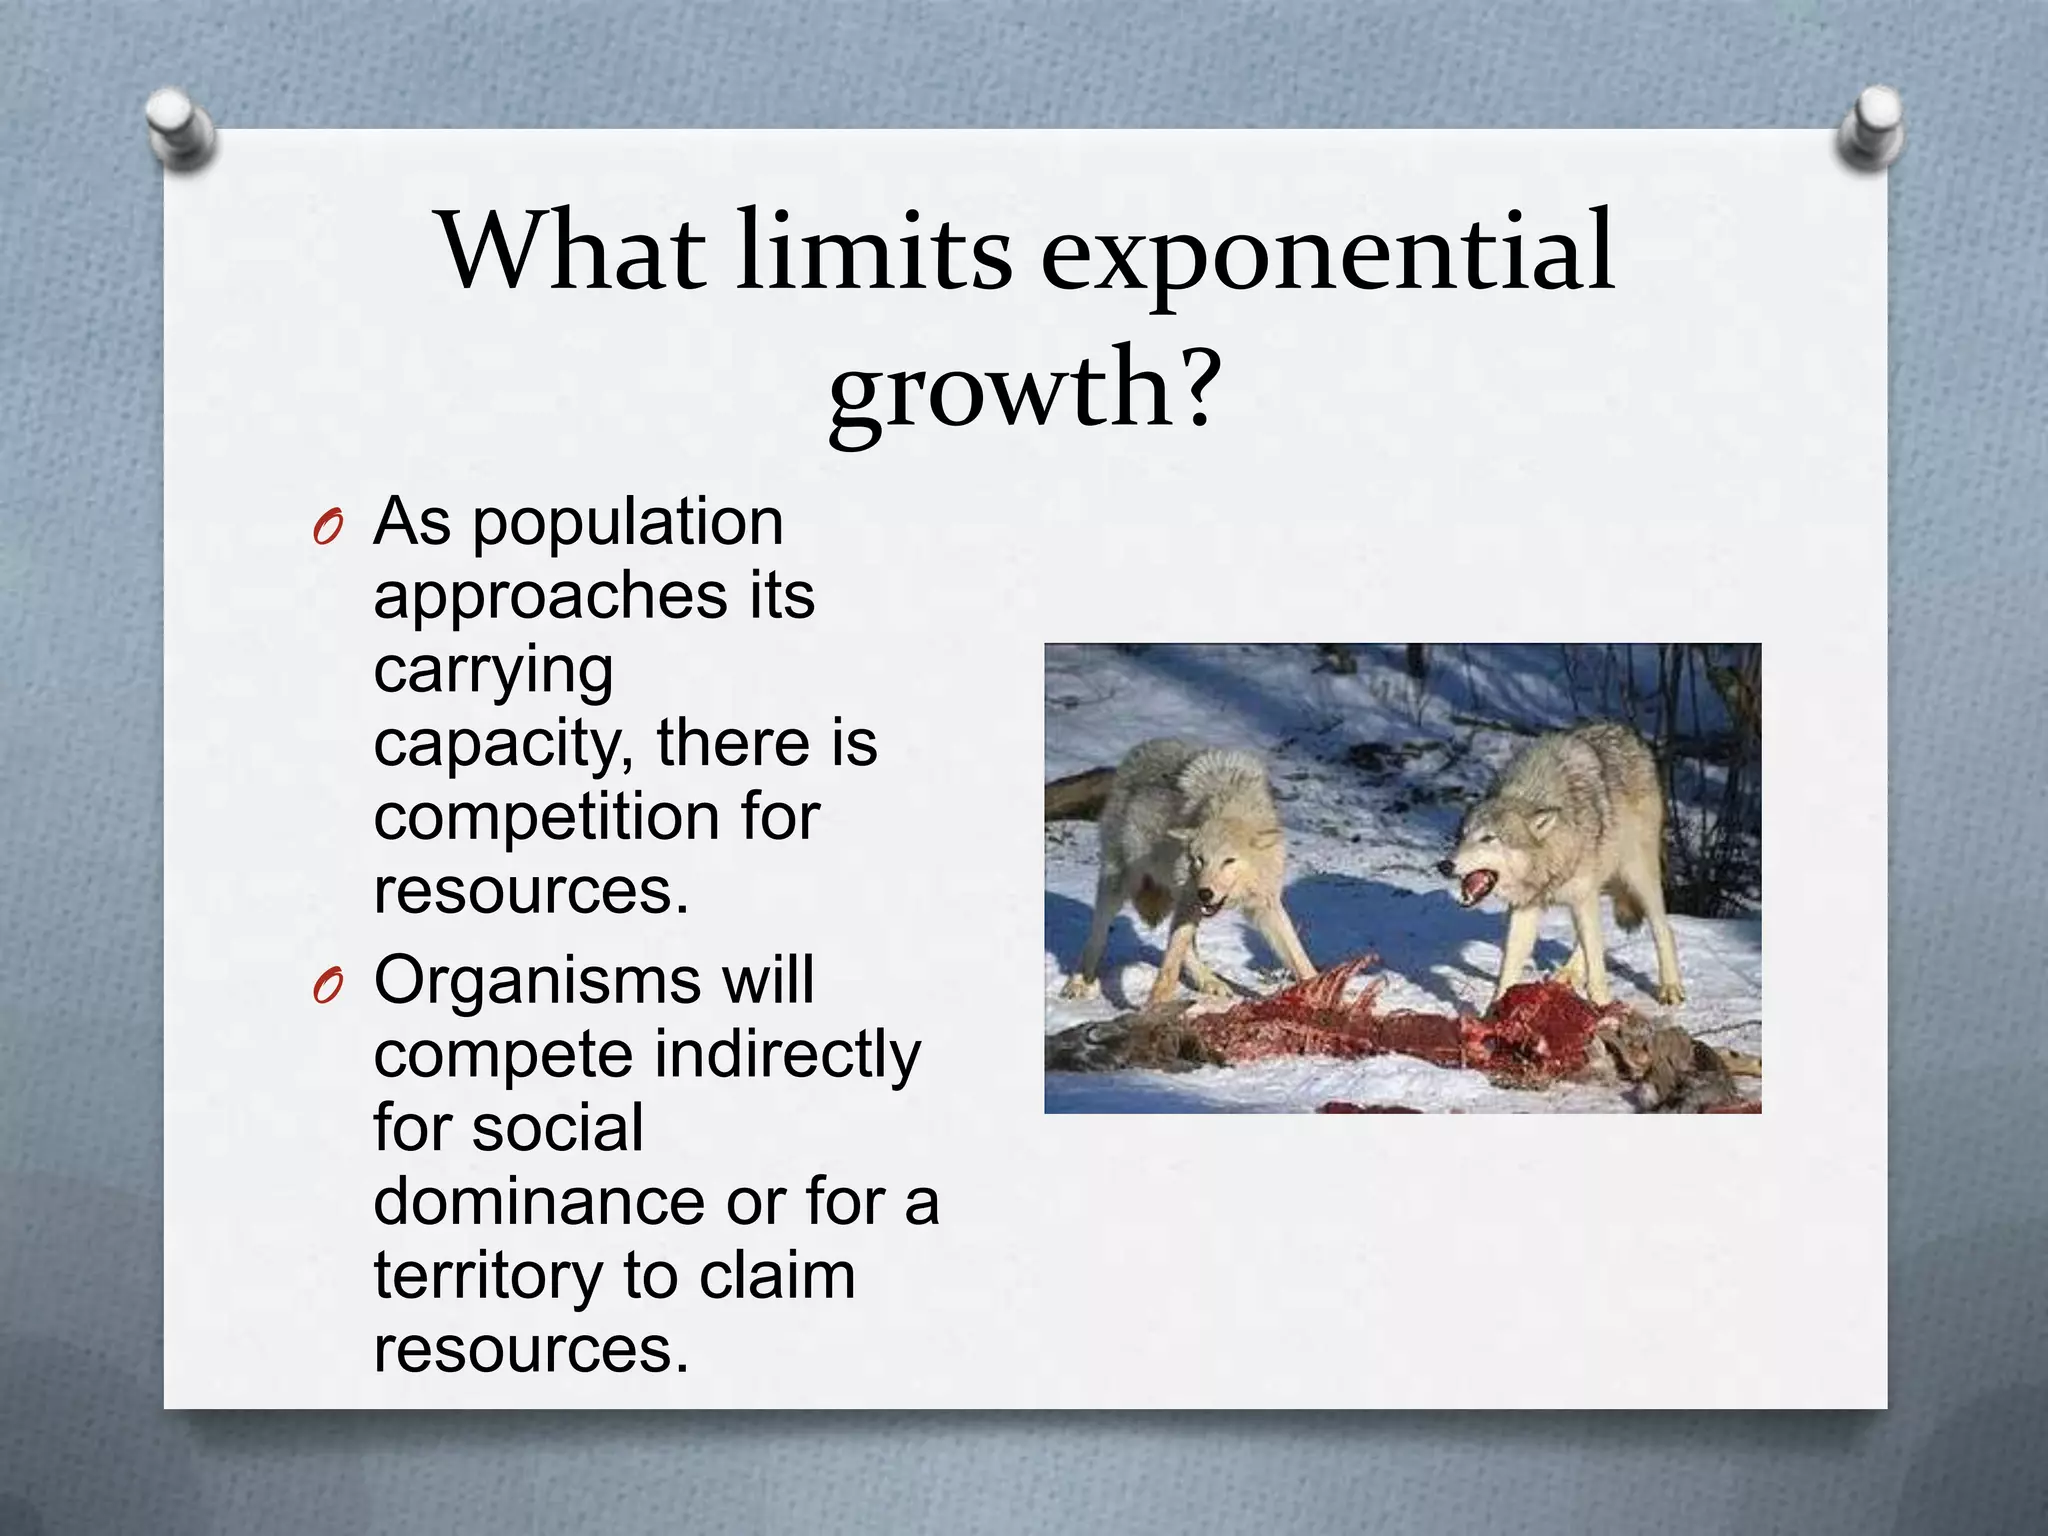
2) Populations can experience exponential growth in the absence of limiting factors, but will typically reach logistic growth as resources become constrained, leveling off at the carrying capacity.
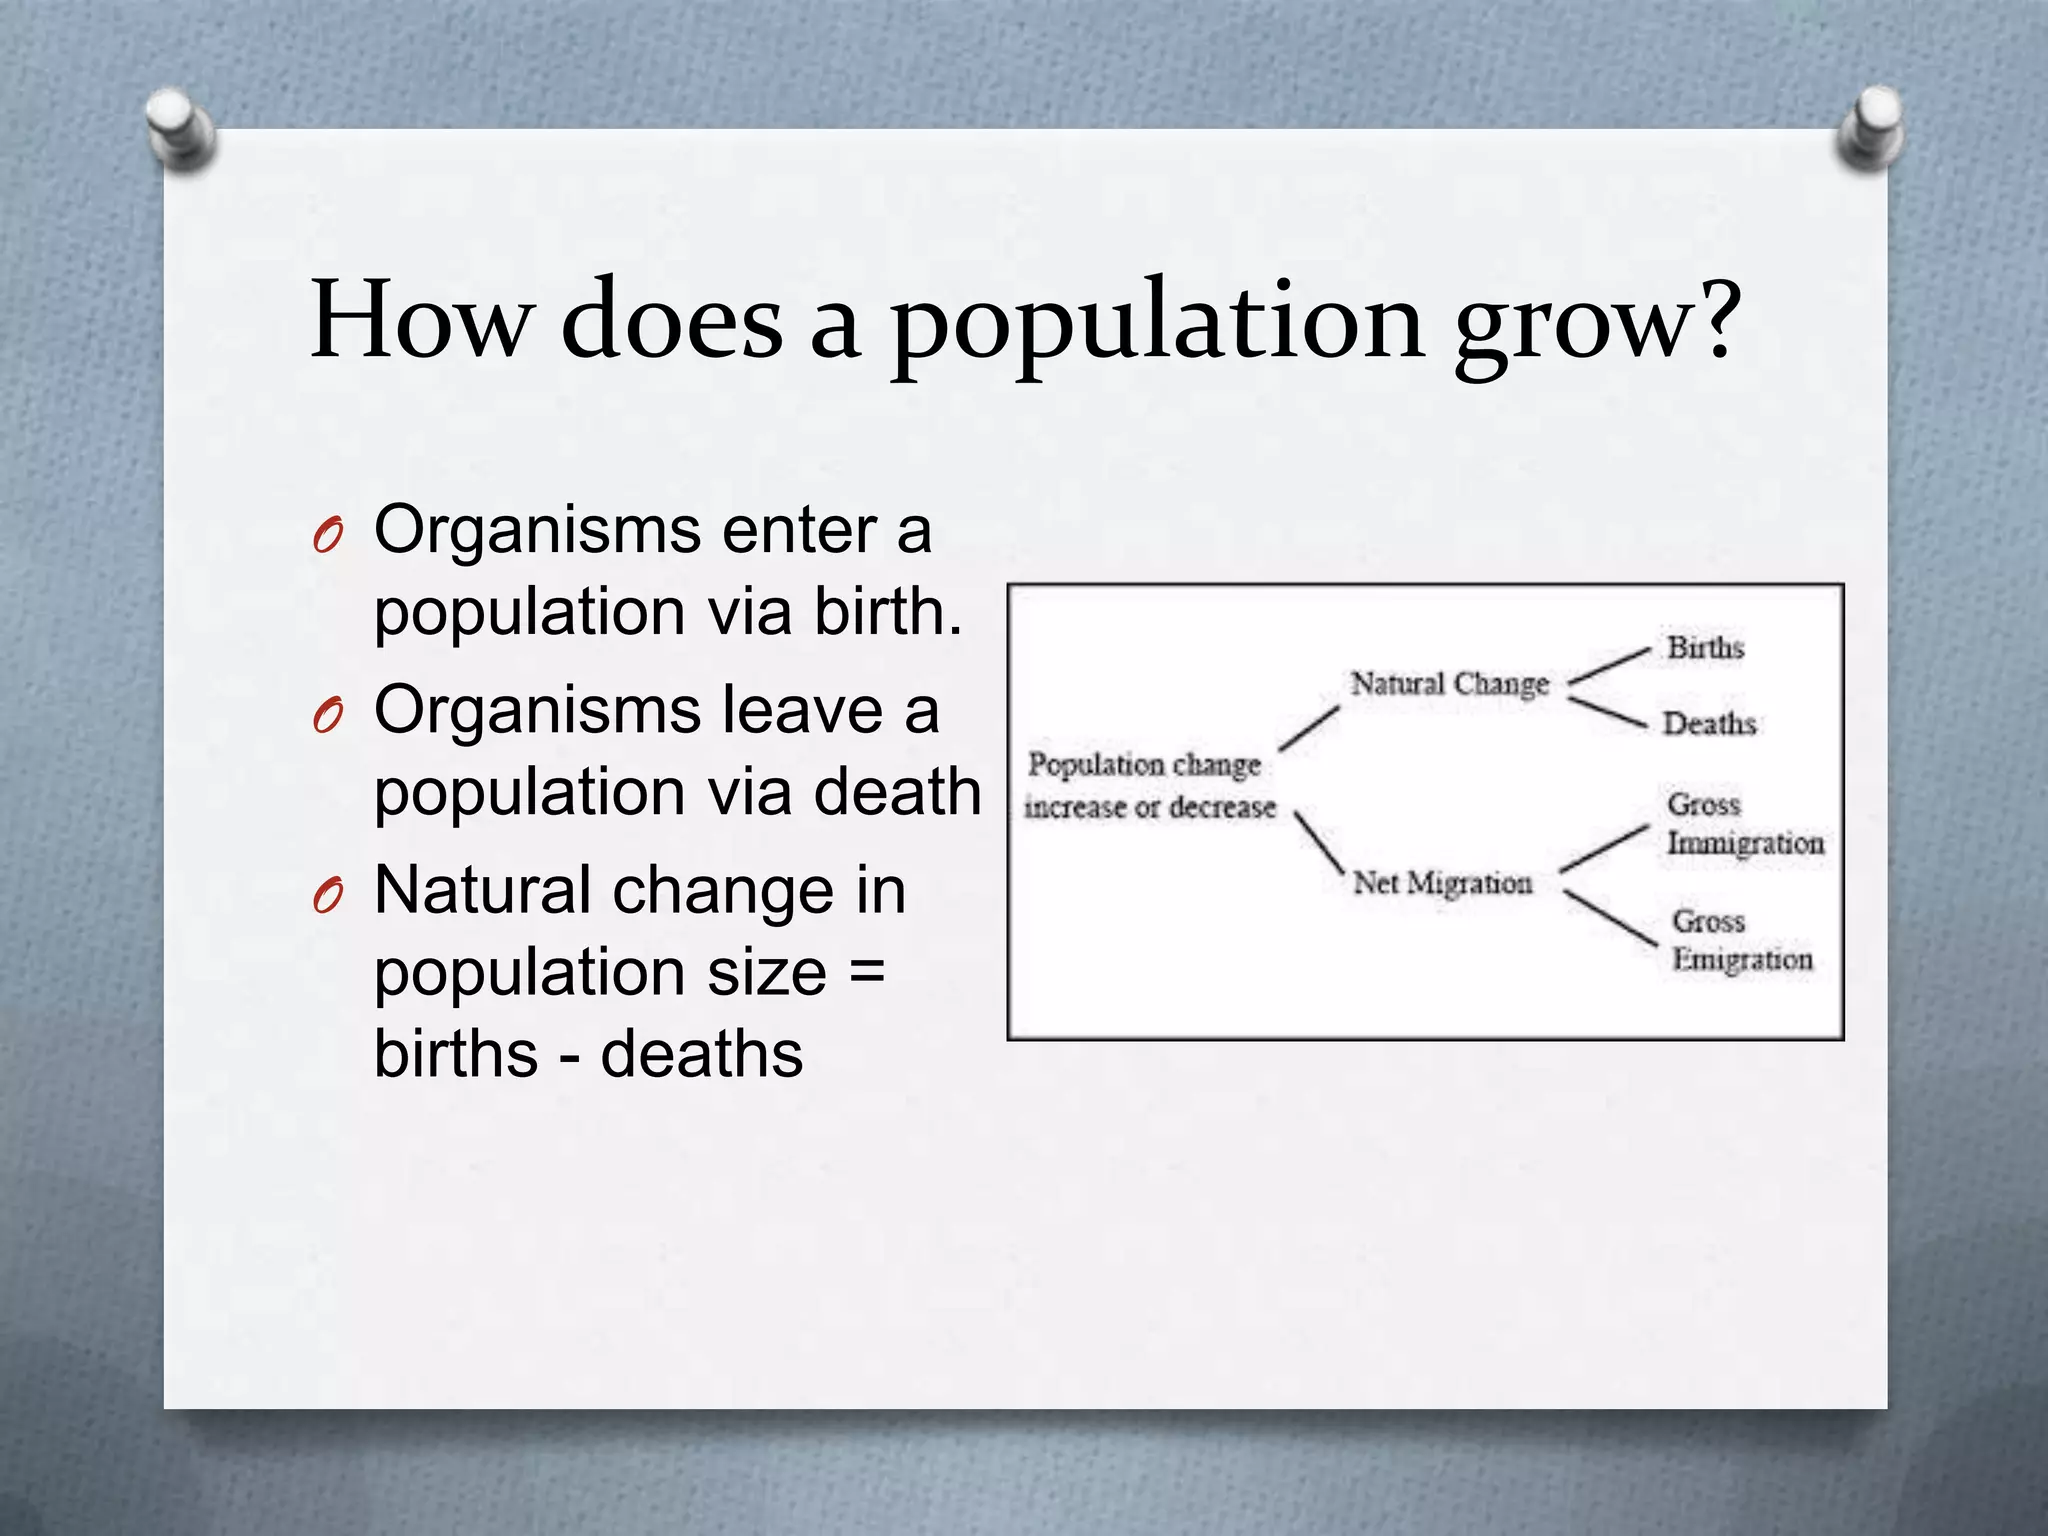
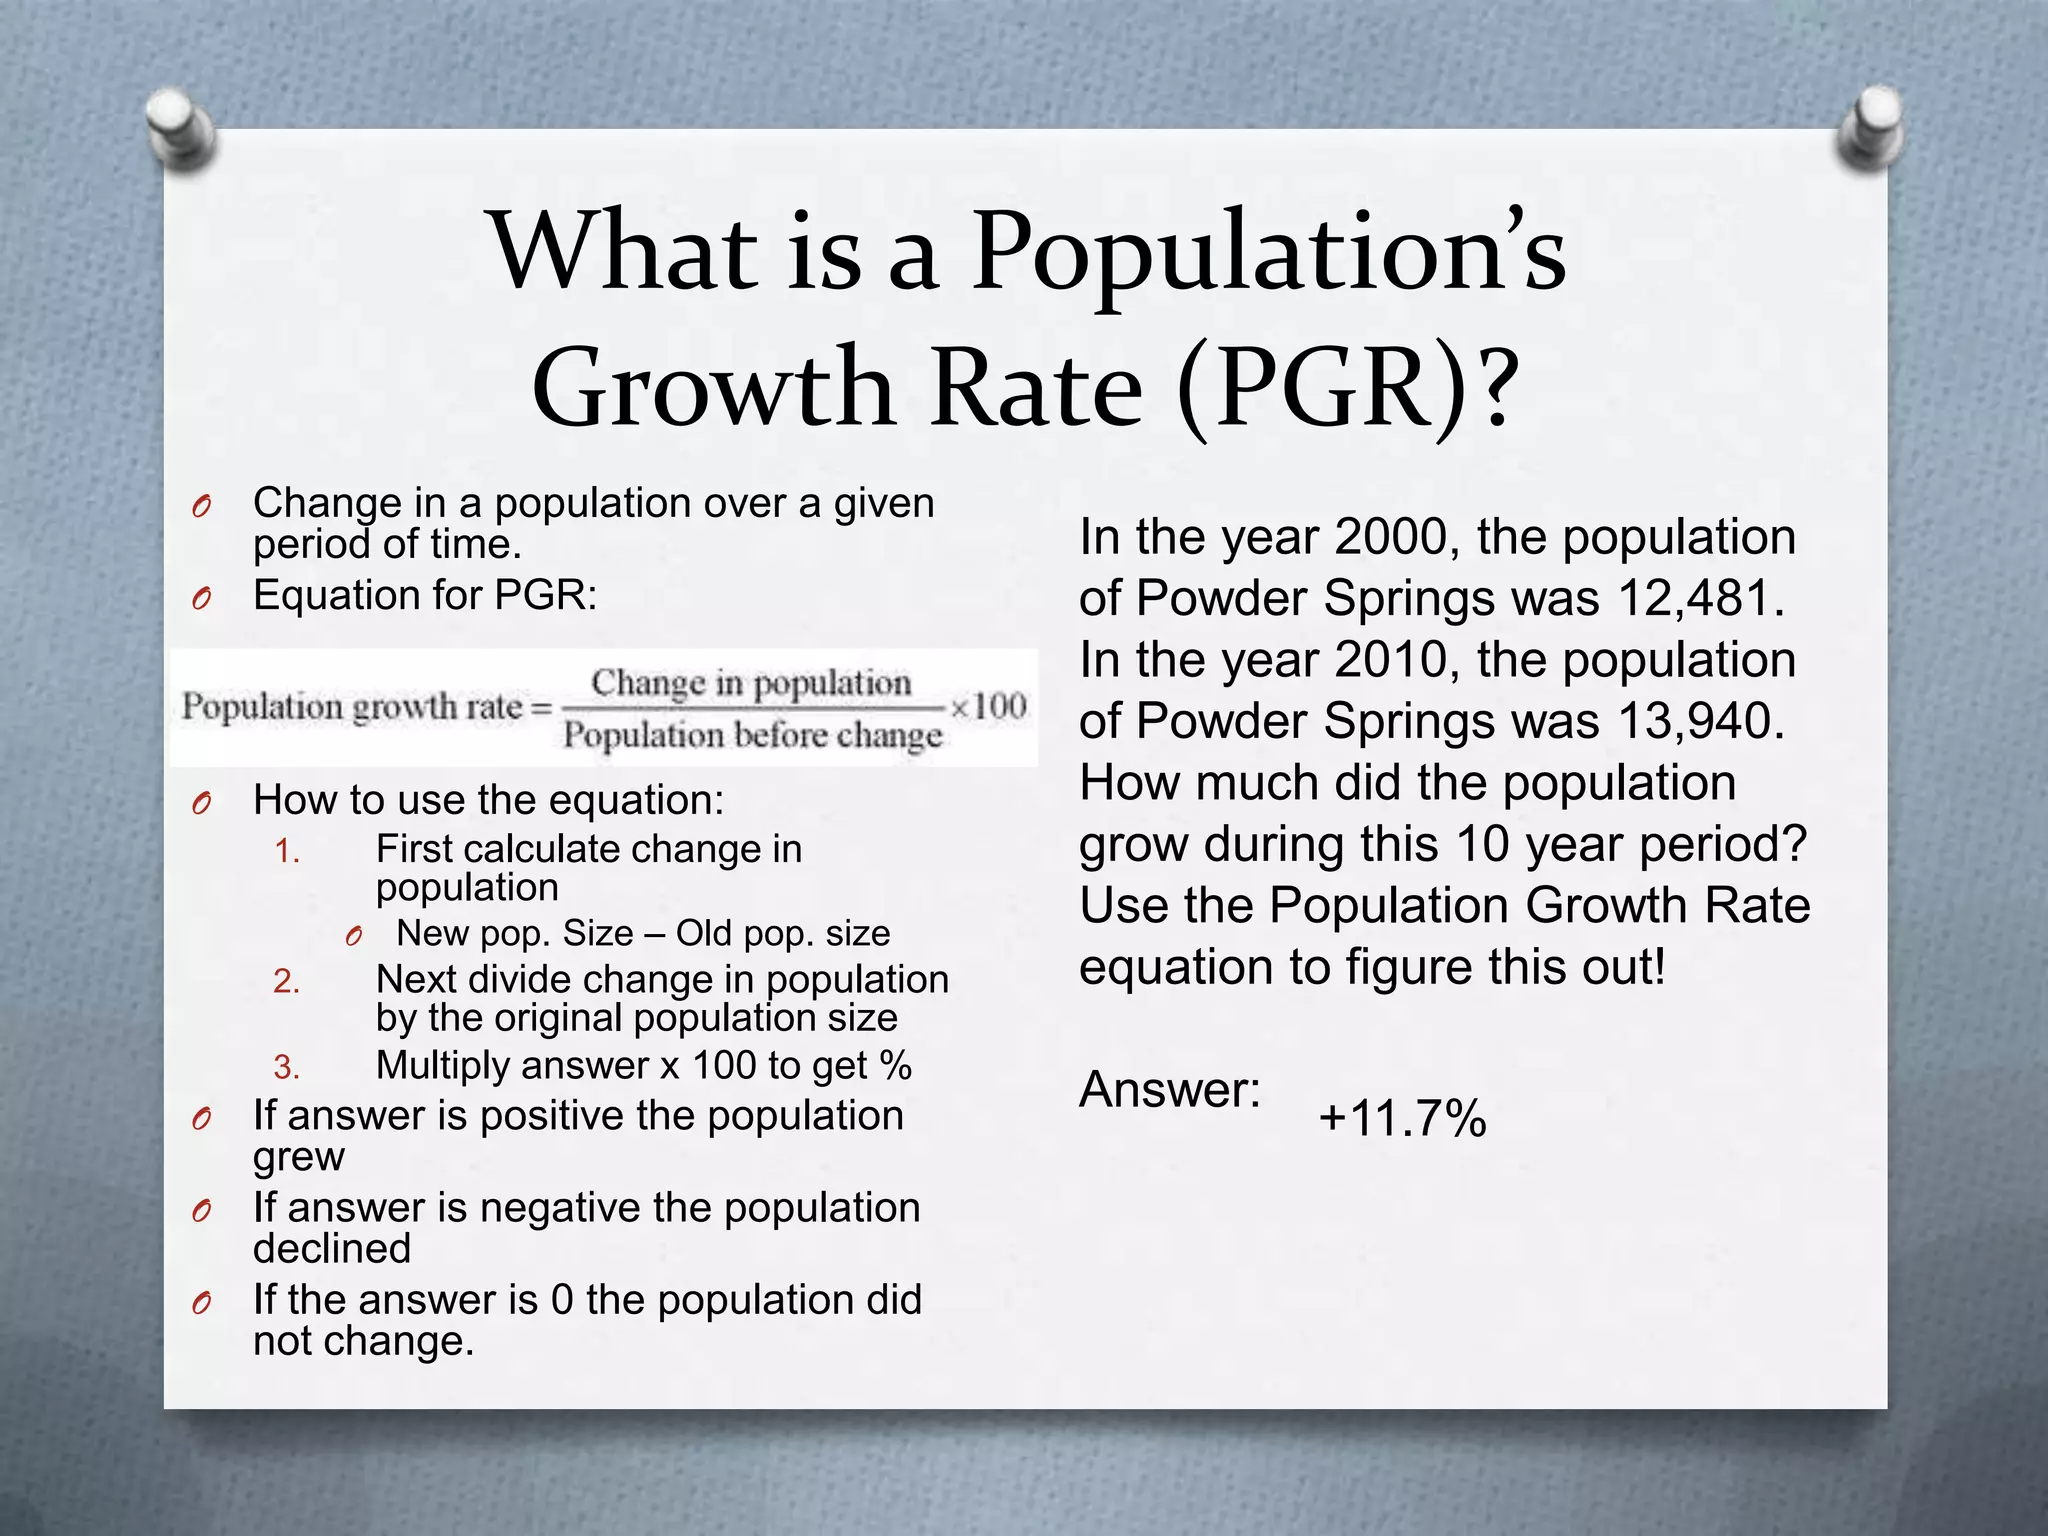
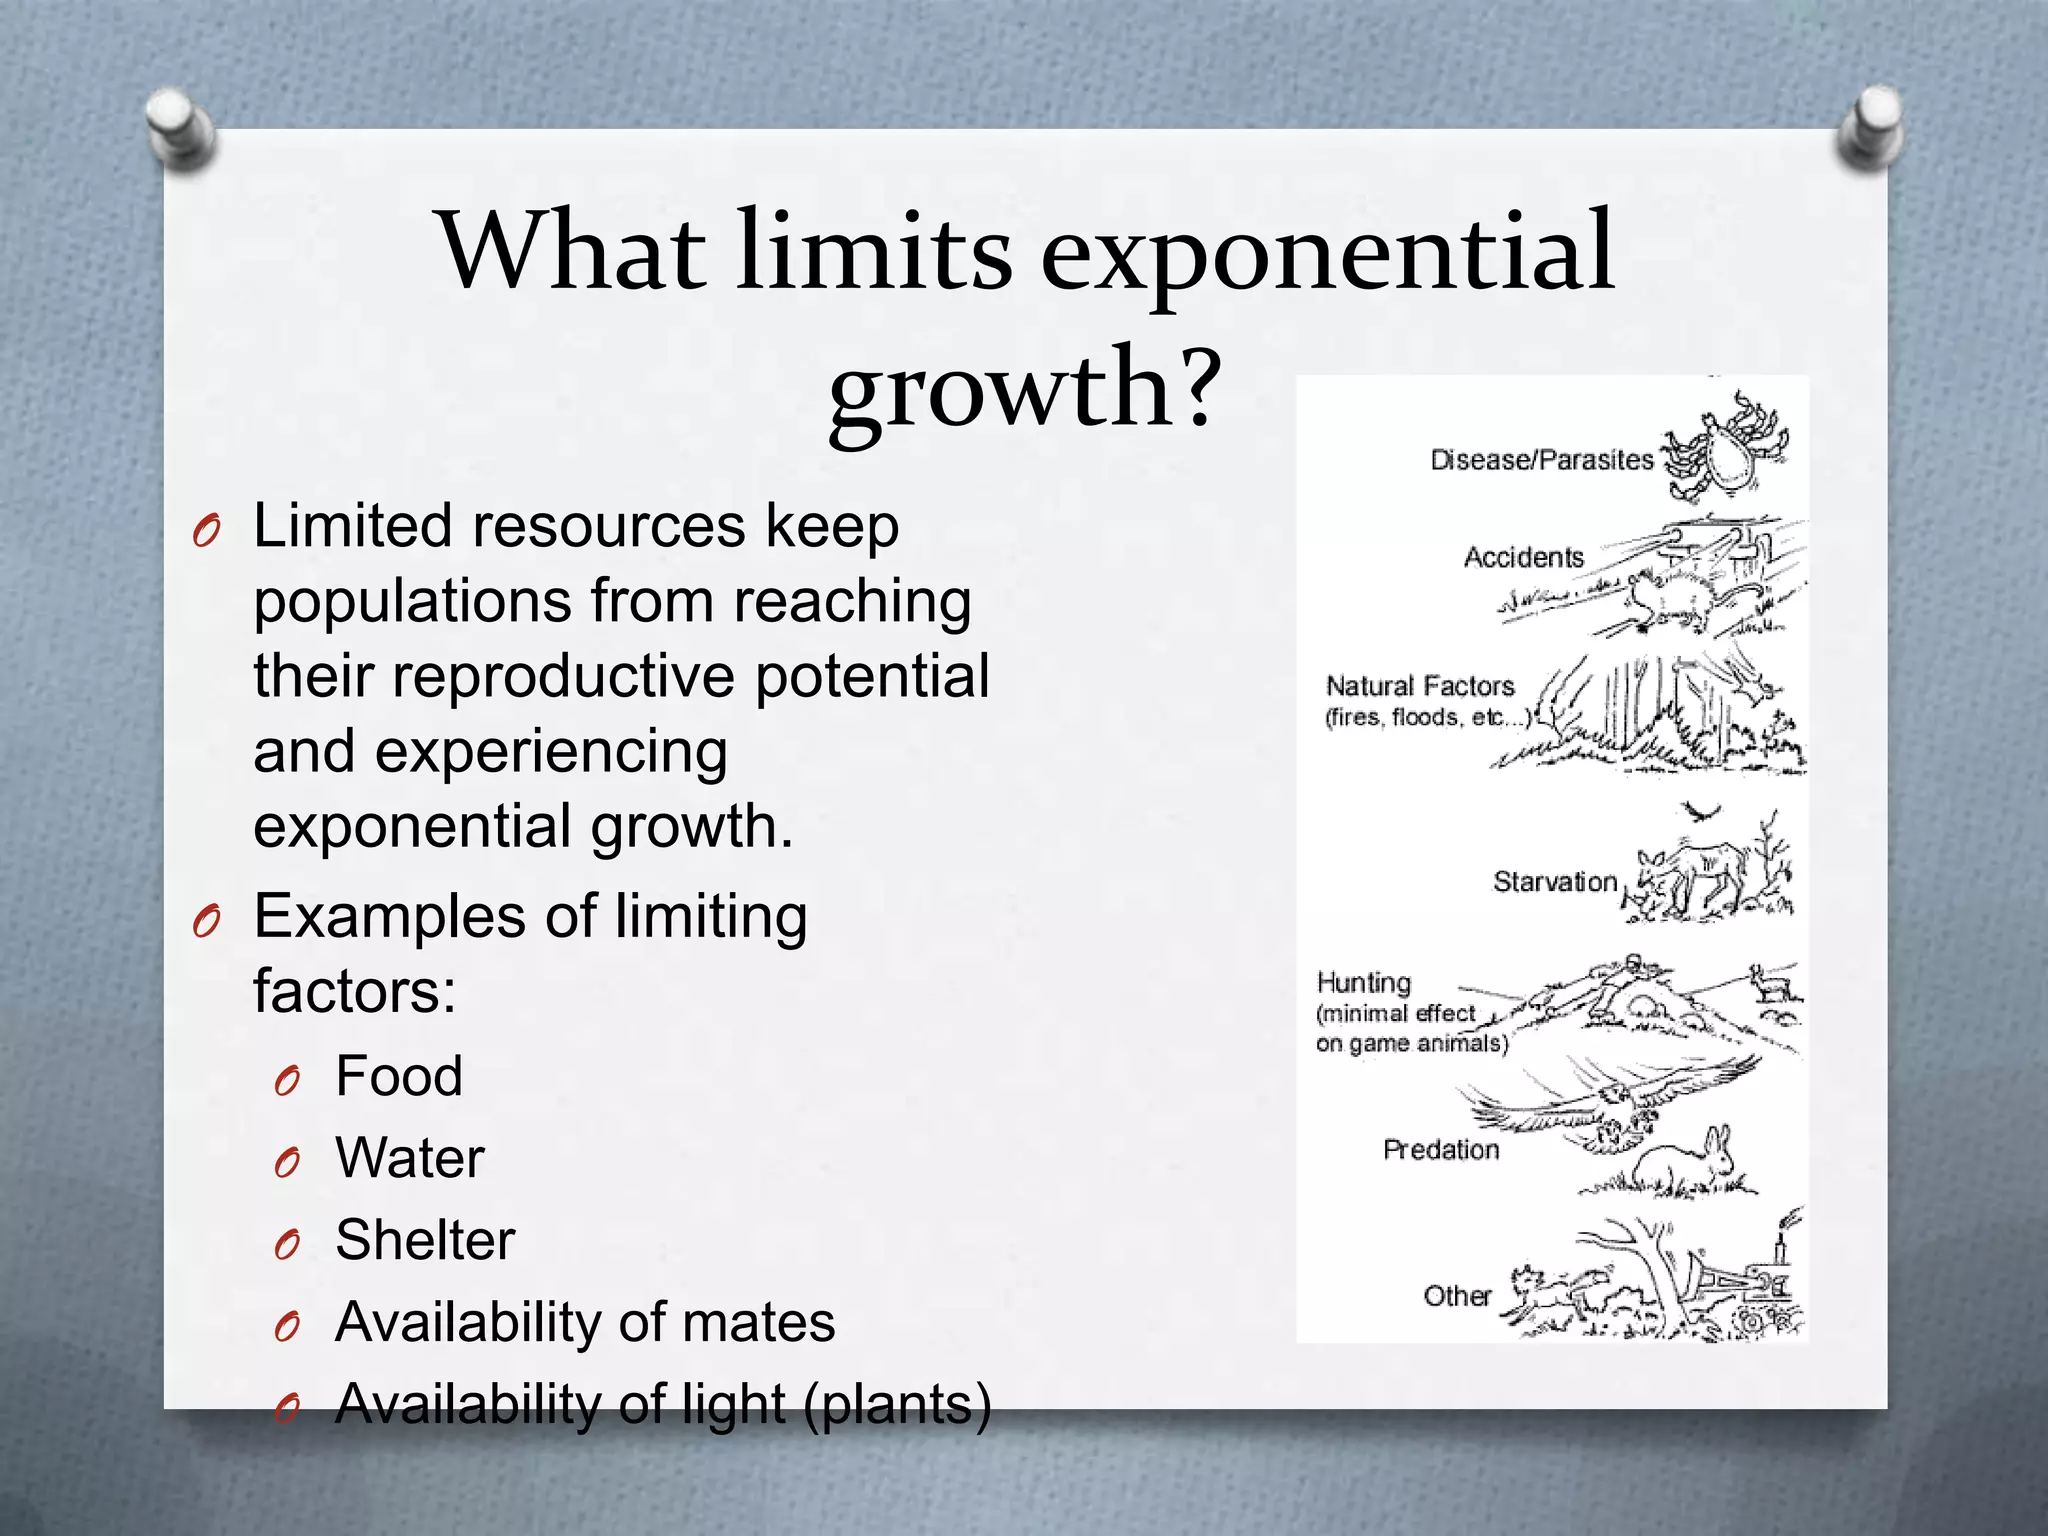
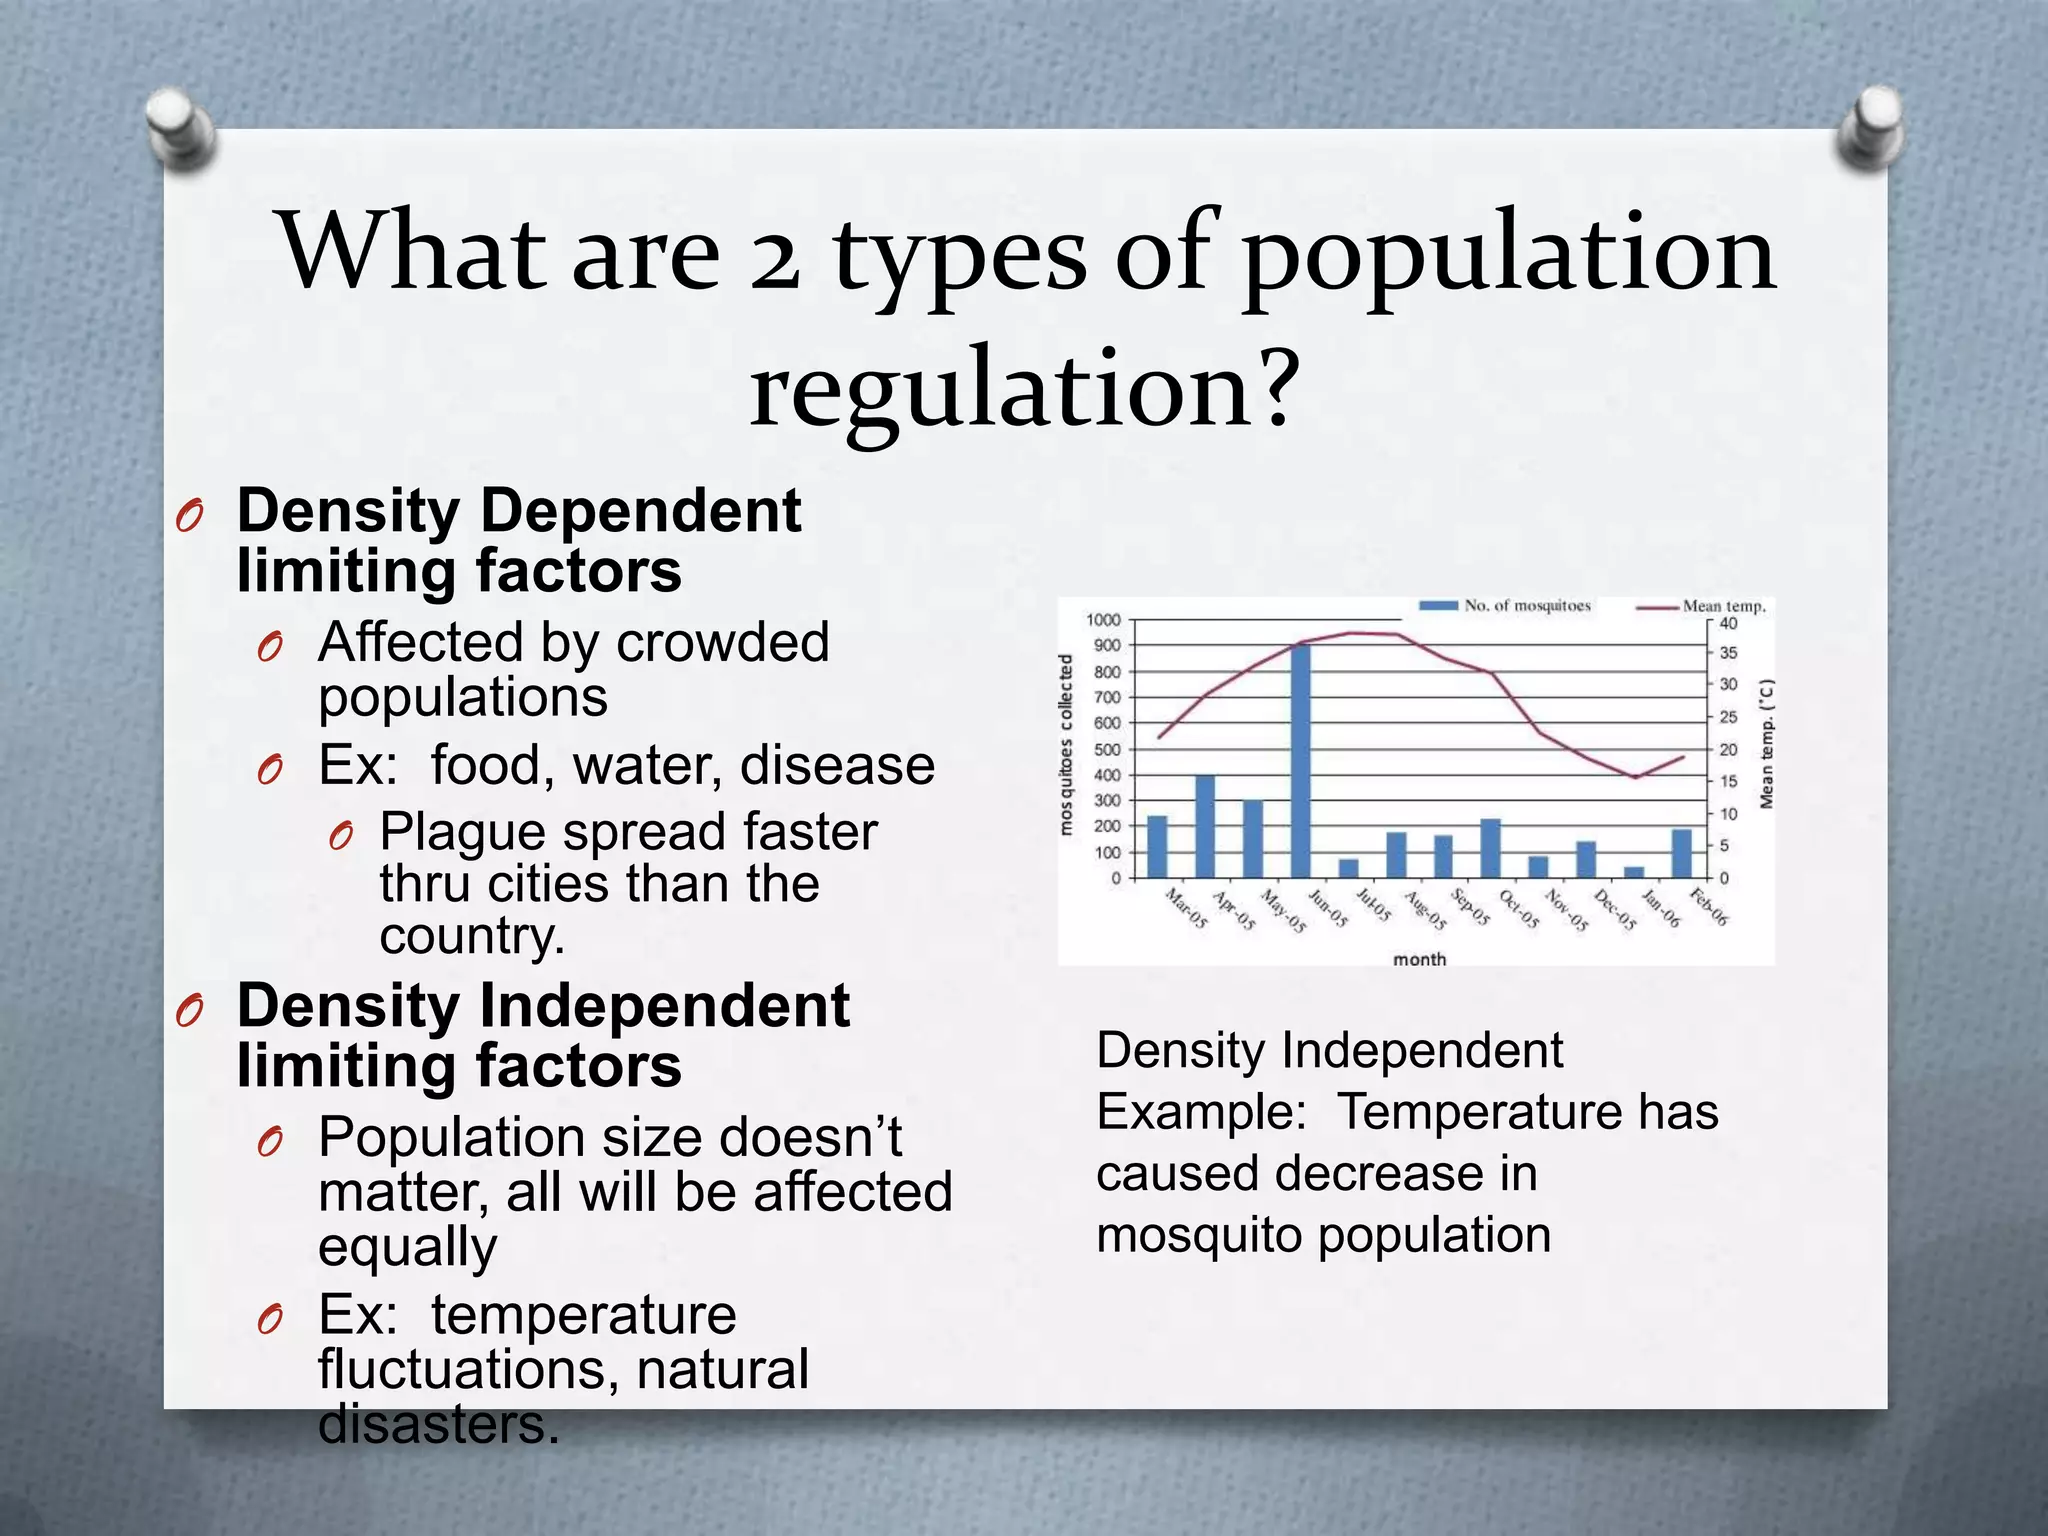
3) Population growth rate is calculated by comparing population sizes over time. Limiting factors like food and space regulate population size through density-dependent and density-independent factors.