Downloaded 114 times
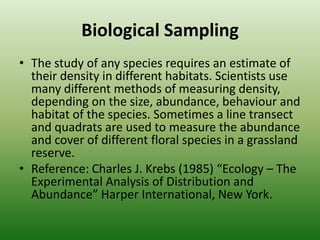
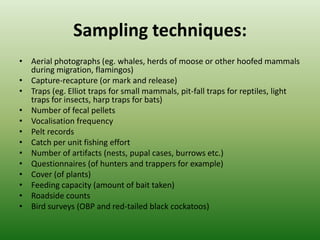


This document discusses various methods used to measure biodiversity, including biological sampling techniques to estimate species density and abundance. Some key methods mentioned are line transects, quadrats, capture-recapture, traps, aerial photographs, and counts of artifacts. It also discusses indices to quantify biodiversity, such as Simpson's Index and Shannon-Wiener Index, and gives examples of their calculation and interpretation. Finally, it covers topics like endemism levels in Australia and measures of extinction risk.