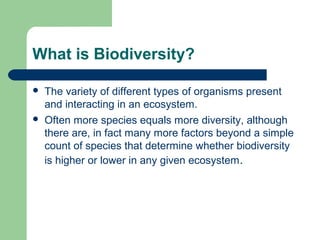
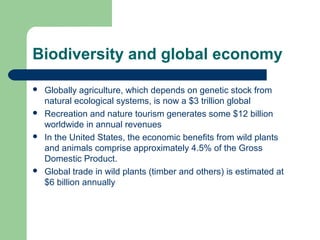
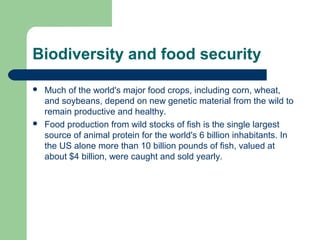
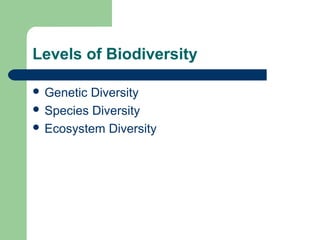
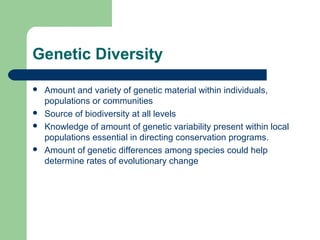
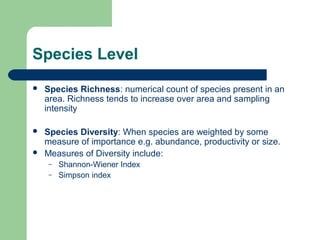
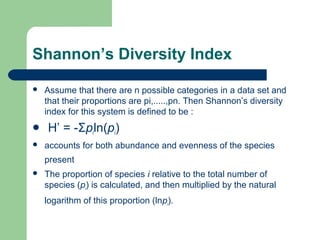
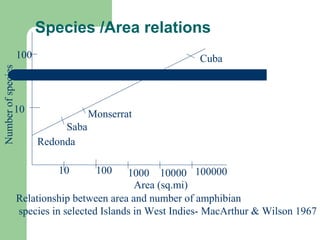
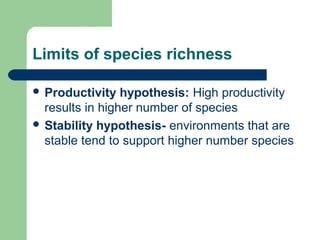
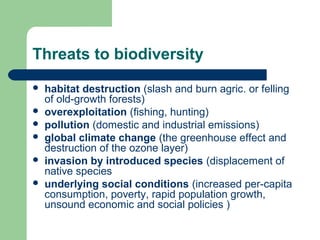
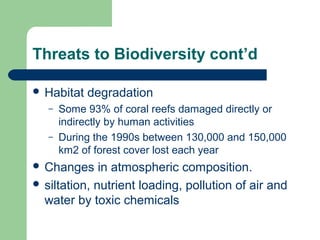
 What is Biodiversity
 Importance of Biodiversity
 Levels of Biodiversity
 Threats to Biodiversity
 Patterns of Biodiversity
What is Biodiversity?
 The variety of different types of organisms present
and interacting in an ecosystem.
 Often more species equals more diversity, although
there are, in fact many more factors beyond a simple
count of species that determine whether biodiversity
is higher or lower in any given ecosystem.
Biodiversity and global economy
 Globally agriculture, which depends on genetic stock from
natural ecological systems, is now a $3 trillion global
 Recreation and nature tourism generates some $12 billion
worldwide in annual revenues
 In the United States, the economic benefits from wild plants
and animals comprise approximately 4.5% of the Gross
Domestic Product.
 Global trade in wild plants (timber and others) is estimated at
$6 billion annually
Biodiversity and food security
 Much of the world's major food crops, including corn, wheat,
and soybeans, depend on new genetic material from the wild to
remain productive and healthy.
 Food production from wild stocks of fish is the single largest
source of animal protein for the world's 6 billion inhabitants. In
the US alone more than 10 billion pounds of fish, valued at
about $4 billion, were caught and sold yearly.
Levels of Biodiversity
 Genetic Diversity
 Species Diversity
 Ecosystem Diversity
Genetic Diversity
 Amount and variety of genetic material within individuals,
populations or communities
 Source of biodiversity at all levels
 Knowledge of amount of genetic variability present within local
populations essential in directing conservation programs.
 Amount of genetic differences among species could help
determine rates of evolutionary change
Species Level
 Species Richness: numerical count of species present in an
area. Richness tends to increase over area and sampling
intensity
 Species Diversity: When species are weighted by some
measure of importance e.g. abundance, productivity or size.
 Measures of Diversity include:
– Shannon-Wiener Index
– Simpson index
Shannon’s Diversity Index
 Assume that there are n possible categories in a data set and
that their proportions are pi,.....,pn. Then Shannon’s diversity
index for this system is defined to be :
 H’ = -Σpiln(pi)
 accounts for both abundance and evenness of the species
present
 The proportion of species i relative to the total number of
species (pi) is calculated, and then multiplied by the natural
logarithm of this proportion (lnpi).
Simpson’s Diversity Index, D
 Simpson's diversity index (D) characterizes species
diversity in a community.
 Simpson's diversity index (D) characterizes species
diversity in a community.
 D = 1/(Σpi
2
)
 The proportion of species i relative to the total
number of species (pi) is calculated and squared.
The squared proportions for all the species are
summed, and the reciprocal is taken.
Ecosystem and Biome diversity
 Ecosystems are the collection of all the plants and
animals within a particular area
 Ecosystems may differ in species composition,
physical structure and function as a result of
differences in physical structure and composition
 Biomes are large ecological units on the basis of
dominant vegetation
 Preserving a variety of ecosystems and biomes are
necessary for preserving species diversity
Temporal Patterns of Species richness
 Fossil record indicate variation of species
richness over time and space
 Largest number of phyla in the Cambrian
and pre-Cambrian period
 Total number of phyla has since declined but
overall richness has increased
Spatial patterns of species richness
 Point Richness: number of species that can be
found in a single point in space
 Alpha (α-) richness: number of species found in a
small homogenous area
 Beta (β-) richness: rate of change in species in
species composition across habitats
 Gamma (γ-) richness: change across large
landscape gradients
 Richness is directly related to physical environment,
productivity and structural complexity of communities
10000010 100 1000 10000
10
100
Redonda
Saba
Monserrat
Jamaica
Cuba
Area (sq.mi)
Numberofspecies
Relationship between area and number of amphibian
species in selected Islands in West Indies- MacArthur & Wilson 1967
Species /Area relations
Limits of species richness
 Productivity hypothesis: High productivity
results in higher number of species
 Stability hypothesis- environments that are
stable tend to support higher number species
Threats to biodiversity
 habitat destruction (slash and burn agric. or felling
of old-growth forests)
 overexploitation (fishing, hunting)
 pollution (domestic and industrial emissions)
 global climate change (the greenhouse effect and
destruction of the ozone layer)
 invasion by introduced species (displacement of
native species
 underlying social conditions (increased per-capita
consumption, poverty, rapid population growth,
unsound economic and social policies )
Threats to Biodiversity cont’d
 Habitat degradation
– Some 93% of coral reefs damaged directly or
indirectly by human activities
– During the 1990s between 130,000 and 150,000
km2 of forest cover lost each year
 Changes in atmospheric composition.
 siltation, nutrient loading, pollution of air and
water by toxic chemicals
Patterns of species vulnerability
 Rare Species
 Long-lived species
 Keystone species
Rare species
 May be the result of many factors small
range, high habitat specificity or small
population density
 Human-induced rarity may be more
damaging
Long-lived species
 Well-suited to long-term predictability
 Often not equipped to adapt to rapid changes
brought by human-induced changes
 Often population declines may take many
years to recover
Keystone species
 A species or group of species that makes
and unusual contribution to a community
structure or processes
 May be predators, food source or species
that maintains critical ecosystem processes
 A loss of a keystone species may lead to
loss of others that depend on it.
Biodiversity Management
Conservation vs Preservation?
 All about management of Genetic Variation
– Aim is to allow continued evolutionary change in the
populations and species concerned
– Since ecological systems are not static- management
should allow for change- Conservation rather than
preservation.
– 3 Time scales of concern: extinction avoidance (short-term);
ability to adapt or evolve (medium term) and potential for
continued speciation (long-term)
– Units of conservation: What are the units of conservation?
How do we determine the most appropriate unit?
Next week
 Habitat fragmentation and biological
consequences
 Population dynamics on heterogeneous
landscapes
Today’s lab
 Review of two short papers.
 Stuart Chapin III et al 2000. Consequences of changing
biodiversity Nature Vol. 405 pp. 234 http://www.nature.com/cgi-
taf/DynaPage.taf?file=/nature/journal/v405/n6783/full/405234a0_fs.html&content_filetype=pdf
 Franklin, J.F. 1993. Preserving Biodiversity: Species,
Ecosystems or Landscapes? Ecological Applications, 3(2), pp.
202 - 205. http://www.jstor.org/cgi-bin/jstor/printpage/10510761/di960380/96p0004u/0.pd f?
userID=a027019f@columbia.edu/01cc9933410050dc70eb&backcontext=table-
ofcontents&config=jstor&dowhat=Acrobat&0.pdf

Biodiversity ist lecture

  • 1.
     What isBiodiversity  Importance of Biodiversity  Levels of Biodiversity  Threats to Biodiversity  Patterns of Biodiversity
  • 2.
    What is Biodiversity? The variety of different types of organisms present and interacting in an ecosystem.  Often more species equals more diversity, although there are, in fact many more factors beyond a simple count of species that determine whether biodiversity is higher or lower in any given ecosystem.
  • 3.
    Biodiversity and globaleconomy  Globally agriculture, which depends on genetic stock from natural ecological systems, is now a $3 trillion global  Recreation and nature tourism generates some $12 billion worldwide in annual revenues  In the United States, the economic benefits from wild plants and animals comprise approximately 4.5% of the Gross Domestic Product.  Global trade in wild plants (timber and others) is estimated at $6 billion annually
  • 4.
    Biodiversity and foodsecurity  Much of the world's major food crops, including corn, wheat, and soybeans, depend on new genetic material from the wild to remain productive and healthy.  Food production from wild stocks of fish is the single largest source of animal protein for the world's 6 billion inhabitants. In the US alone more than 10 billion pounds of fish, valued at about $4 billion, were caught and sold yearly.
  • 5.
    Levels of Biodiversity Genetic Diversity  Species Diversity  Ecosystem Diversity
  • 6.
    Genetic Diversity  Amountand variety of genetic material within individuals, populations or communities  Source of biodiversity at all levels  Knowledge of amount of genetic variability present within local populations essential in directing conservation programs.  Amount of genetic differences among species could help determine rates of evolutionary change
  • 7.
    Species Level  SpeciesRichness: numerical count of species present in an area. Richness tends to increase over area and sampling intensity  Species Diversity: When species are weighted by some measure of importance e.g. abundance, productivity or size.  Measures of Diversity include: – Shannon-Wiener Index – Simpson index
  • 8.
    Shannon’s Diversity Index Assume that there are n possible categories in a data set and that their proportions are pi,.....,pn. Then Shannon’s diversity index for this system is defined to be :  H’ = -Σpiln(pi)  accounts for both abundance and evenness of the species present  The proportion of species i relative to the total number of species (pi) is calculated, and then multiplied by the natural logarithm of this proportion (lnpi).
  • 9.
    Simpson’s Diversity Index,D  Simpson's diversity index (D) characterizes species diversity in a community.  Simpson's diversity index (D) characterizes species diversity in a community.  D = 1/(Σpi 2 )  The proportion of species i relative to the total number of species (pi) is calculated and squared. The squared proportions for all the species are summed, and the reciprocal is taken.
  • 10.
    Ecosystem and Biomediversity  Ecosystems are the collection of all the plants and animals within a particular area  Ecosystems may differ in species composition, physical structure and function as a result of differences in physical structure and composition  Biomes are large ecological units on the basis of dominant vegetation  Preserving a variety of ecosystems and biomes are necessary for preserving species diversity
  • 11.
    Temporal Patterns ofSpecies richness  Fossil record indicate variation of species richness over time and space  Largest number of phyla in the Cambrian and pre-Cambrian period  Total number of phyla has since declined but overall richness has increased
  • 12.
    Spatial patterns ofspecies richness  Point Richness: number of species that can be found in a single point in space  Alpha (α-) richness: number of species found in a small homogenous area  Beta (β-) richness: rate of change in species in species composition across habitats  Gamma (γ-) richness: change across large landscape gradients  Richness is directly related to physical environment, productivity and structural complexity of communities
  • 13.
    10000010 100 100010000 10 100 Redonda Saba Monserrat Jamaica Cuba Area (sq.mi) Numberofspecies Relationship between area and number of amphibian species in selected Islands in West Indies- MacArthur & Wilson 1967 Species /Area relations
  • 14.
    Limits of speciesrichness  Productivity hypothesis: High productivity results in higher number of species  Stability hypothesis- environments that are stable tend to support higher number species
  • 15.
    Threats to biodiversity habitat destruction (slash and burn agric. or felling of old-growth forests)  overexploitation (fishing, hunting)  pollution (domestic and industrial emissions)  global climate change (the greenhouse effect and destruction of the ozone layer)  invasion by introduced species (displacement of native species  underlying social conditions (increased per-capita consumption, poverty, rapid population growth, unsound economic and social policies )
  • 16.
    Threats to Biodiversitycont’d  Habitat degradation – Some 93% of coral reefs damaged directly or indirectly by human activities – During the 1990s between 130,000 and 150,000 km2 of forest cover lost each year  Changes in atmospheric composition.  siltation, nutrient loading, pollution of air and water by toxic chemicals
  • 17.
    Patterns of speciesvulnerability  Rare Species  Long-lived species  Keystone species
  • 18.
    Rare species  Maybe the result of many factors small range, high habitat specificity or small population density  Human-induced rarity may be more damaging
  • 19.
    Long-lived species  Well-suitedto long-term predictability  Often not equipped to adapt to rapid changes brought by human-induced changes  Often population declines may take many years to recover
  • 20.
    Keystone species  Aspecies or group of species that makes and unusual contribution to a community structure or processes  May be predators, food source or species that maintains critical ecosystem processes  A loss of a keystone species may lead to loss of others that depend on it.
  • 21.
    Biodiversity Management Conservation vsPreservation?  All about management of Genetic Variation – Aim is to allow continued evolutionary change in the populations and species concerned – Since ecological systems are not static- management should allow for change- Conservation rather than preservation. – 3 Time scales of concern: extinction avoidance (short-term); ability to adapt or evolve (medium term) and potential for continued speciation (long-term) – Units of conservation: What are the units of conservation? How do we determine the most appropriate unit?
  • 22.
    Next week  Habitatfragmentation and biological consequences  Population dynamics on heterogeneous landscapes
  • 23.
    Today’s lab  Reviewof two short papers.  Stuart Chapin III et al 2000. Consequences of changing biodiversity Nature Vol. 405 pp. 234 http://www.nature.com/cgi- taf/DynaPage.taf?file=/nature/journal/v405/n6783/full/405234a0_fs.html&content_filetype=pdf  Franklin, J.F. 1993. Preserving Biodiversity: Species, Ecosystems or Landscapes? Ecological Applications, 3(2), pp. 202 - 205. http://www.jstor.org/cgi-bin/jstor/printpage/10510761/di960380/96p0004u/0.pd f? userID=a027019f@columbia.edu/01cc9933410050dc70eb&backcontext=table- ofcontents&config=jstor&dowhat=Acrobat&0.pdf

Editor's Notes

  • #4 World Resources Institute, The World Conservation Union, and United Nations Environment Program. 1992. Global Biodiversity Strategy. Washington, D.C.: World Resources Institute World Conservation Monitoring Center (WCMC). 1992. Global Biodiversity: Status of the Earth's Living Resources. Redding, U.K.: WCMC.
  • #5 National Oceanic and Atmospheric Administration (NOAA). 1995. Fisheries of the United States, 1994. Washington, D.C.: U.S. Government Printing Office.
  • #8 Shannon-Wiener index H’ = Sum(pi)Ln(pi) Simpson index D = 1/(sum (pi2)