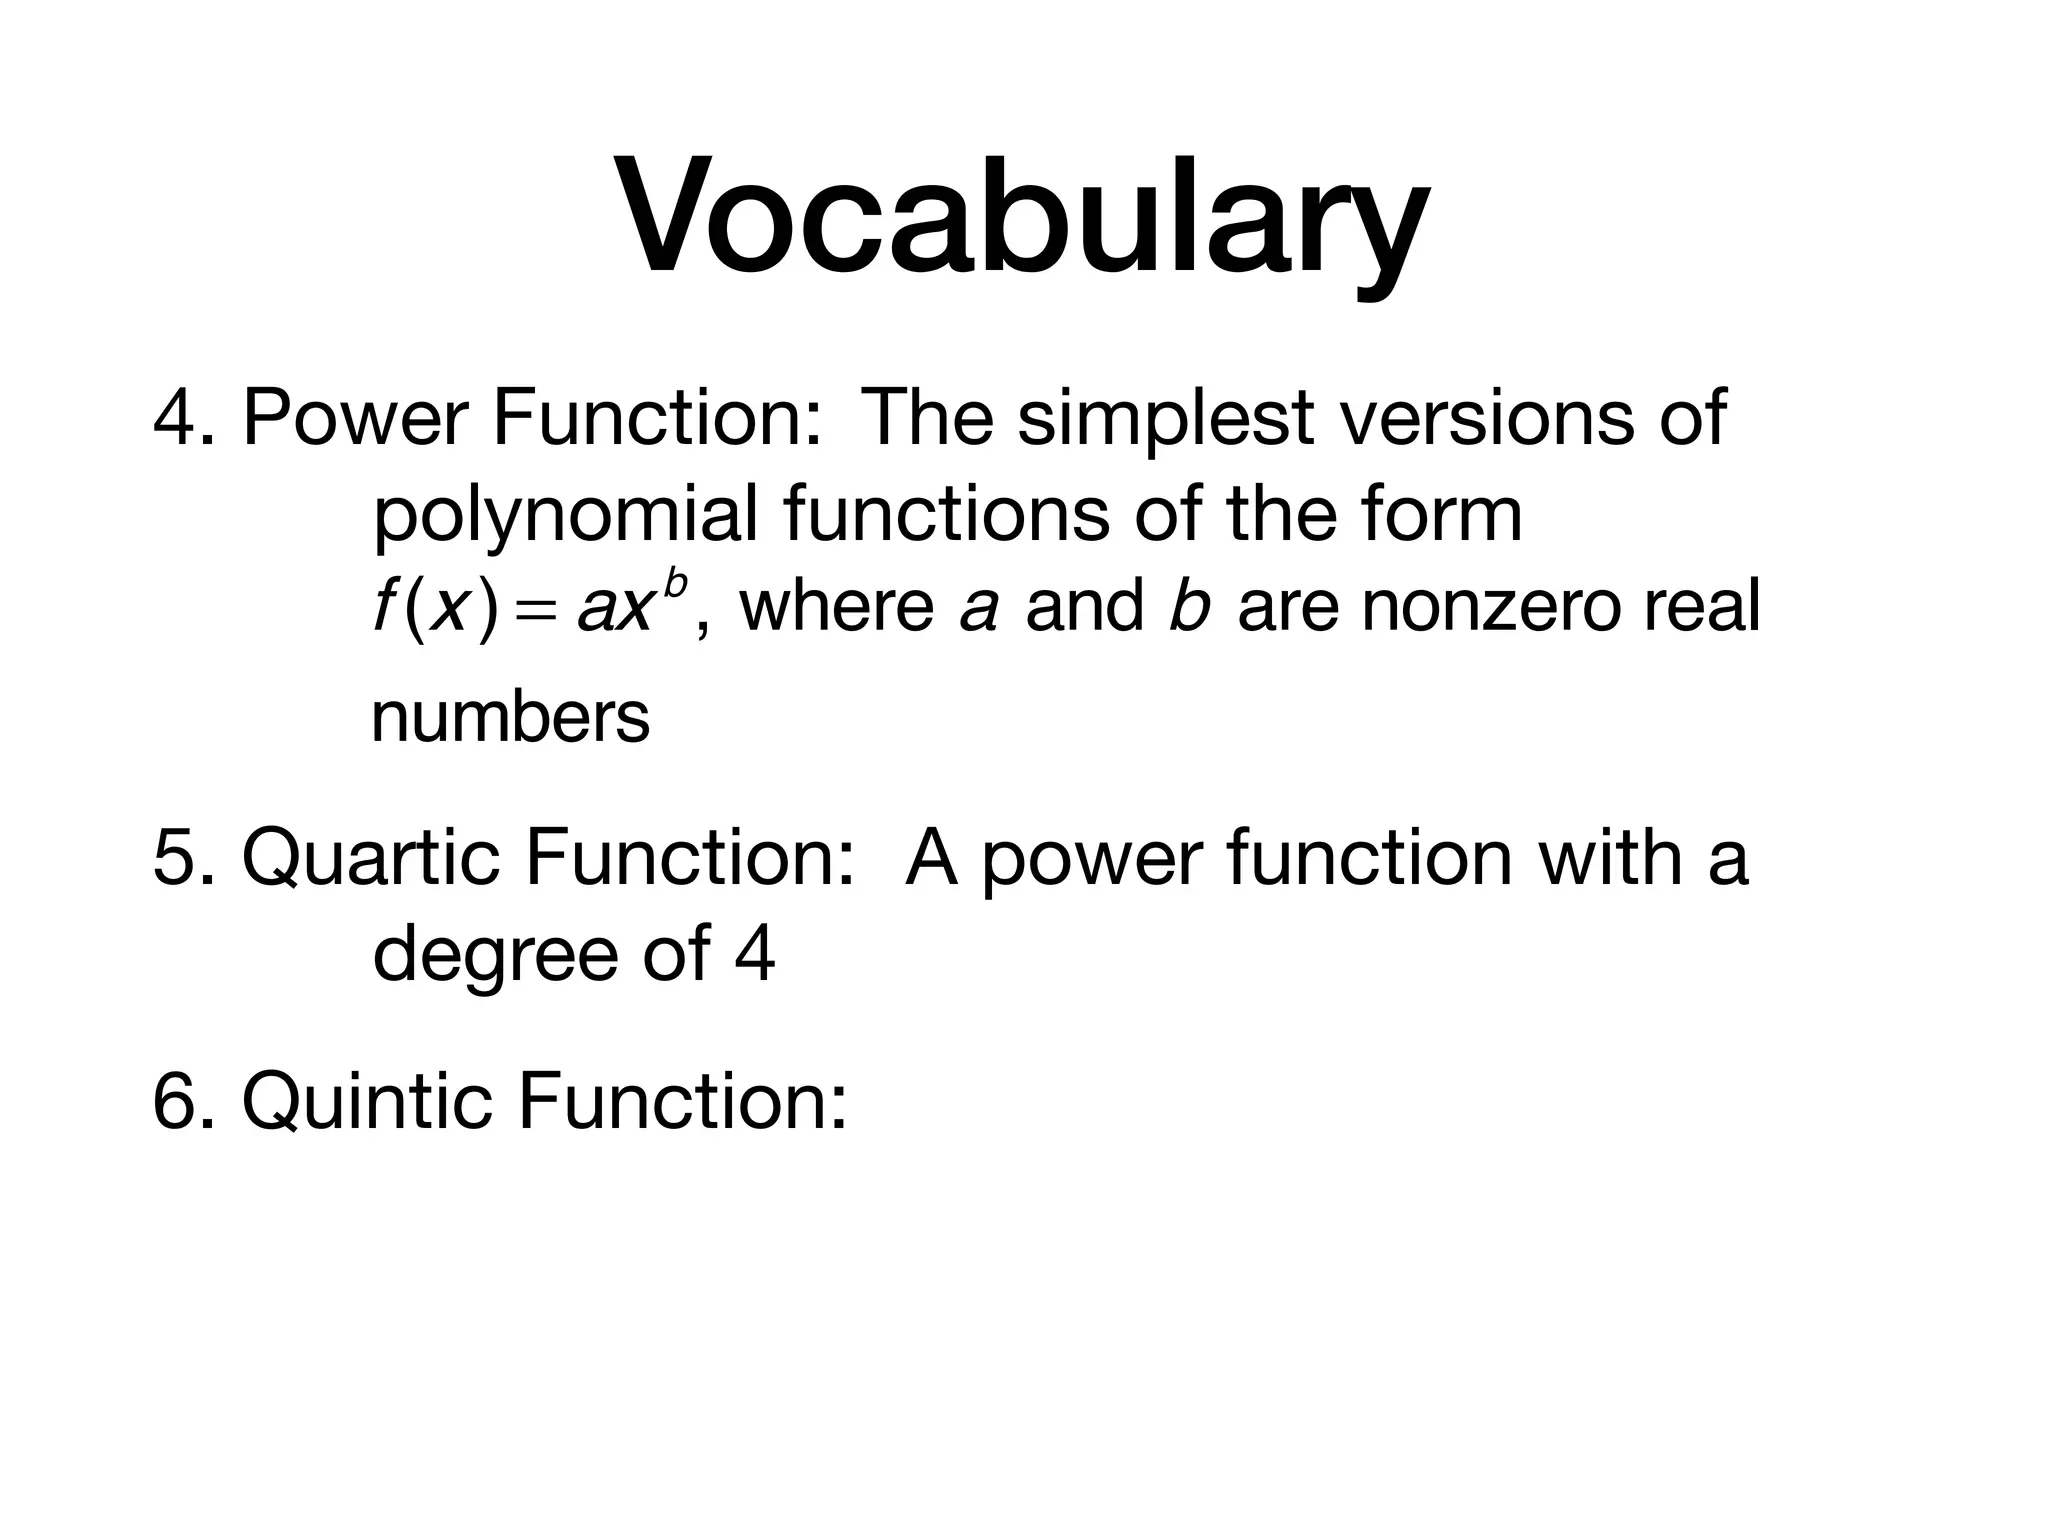
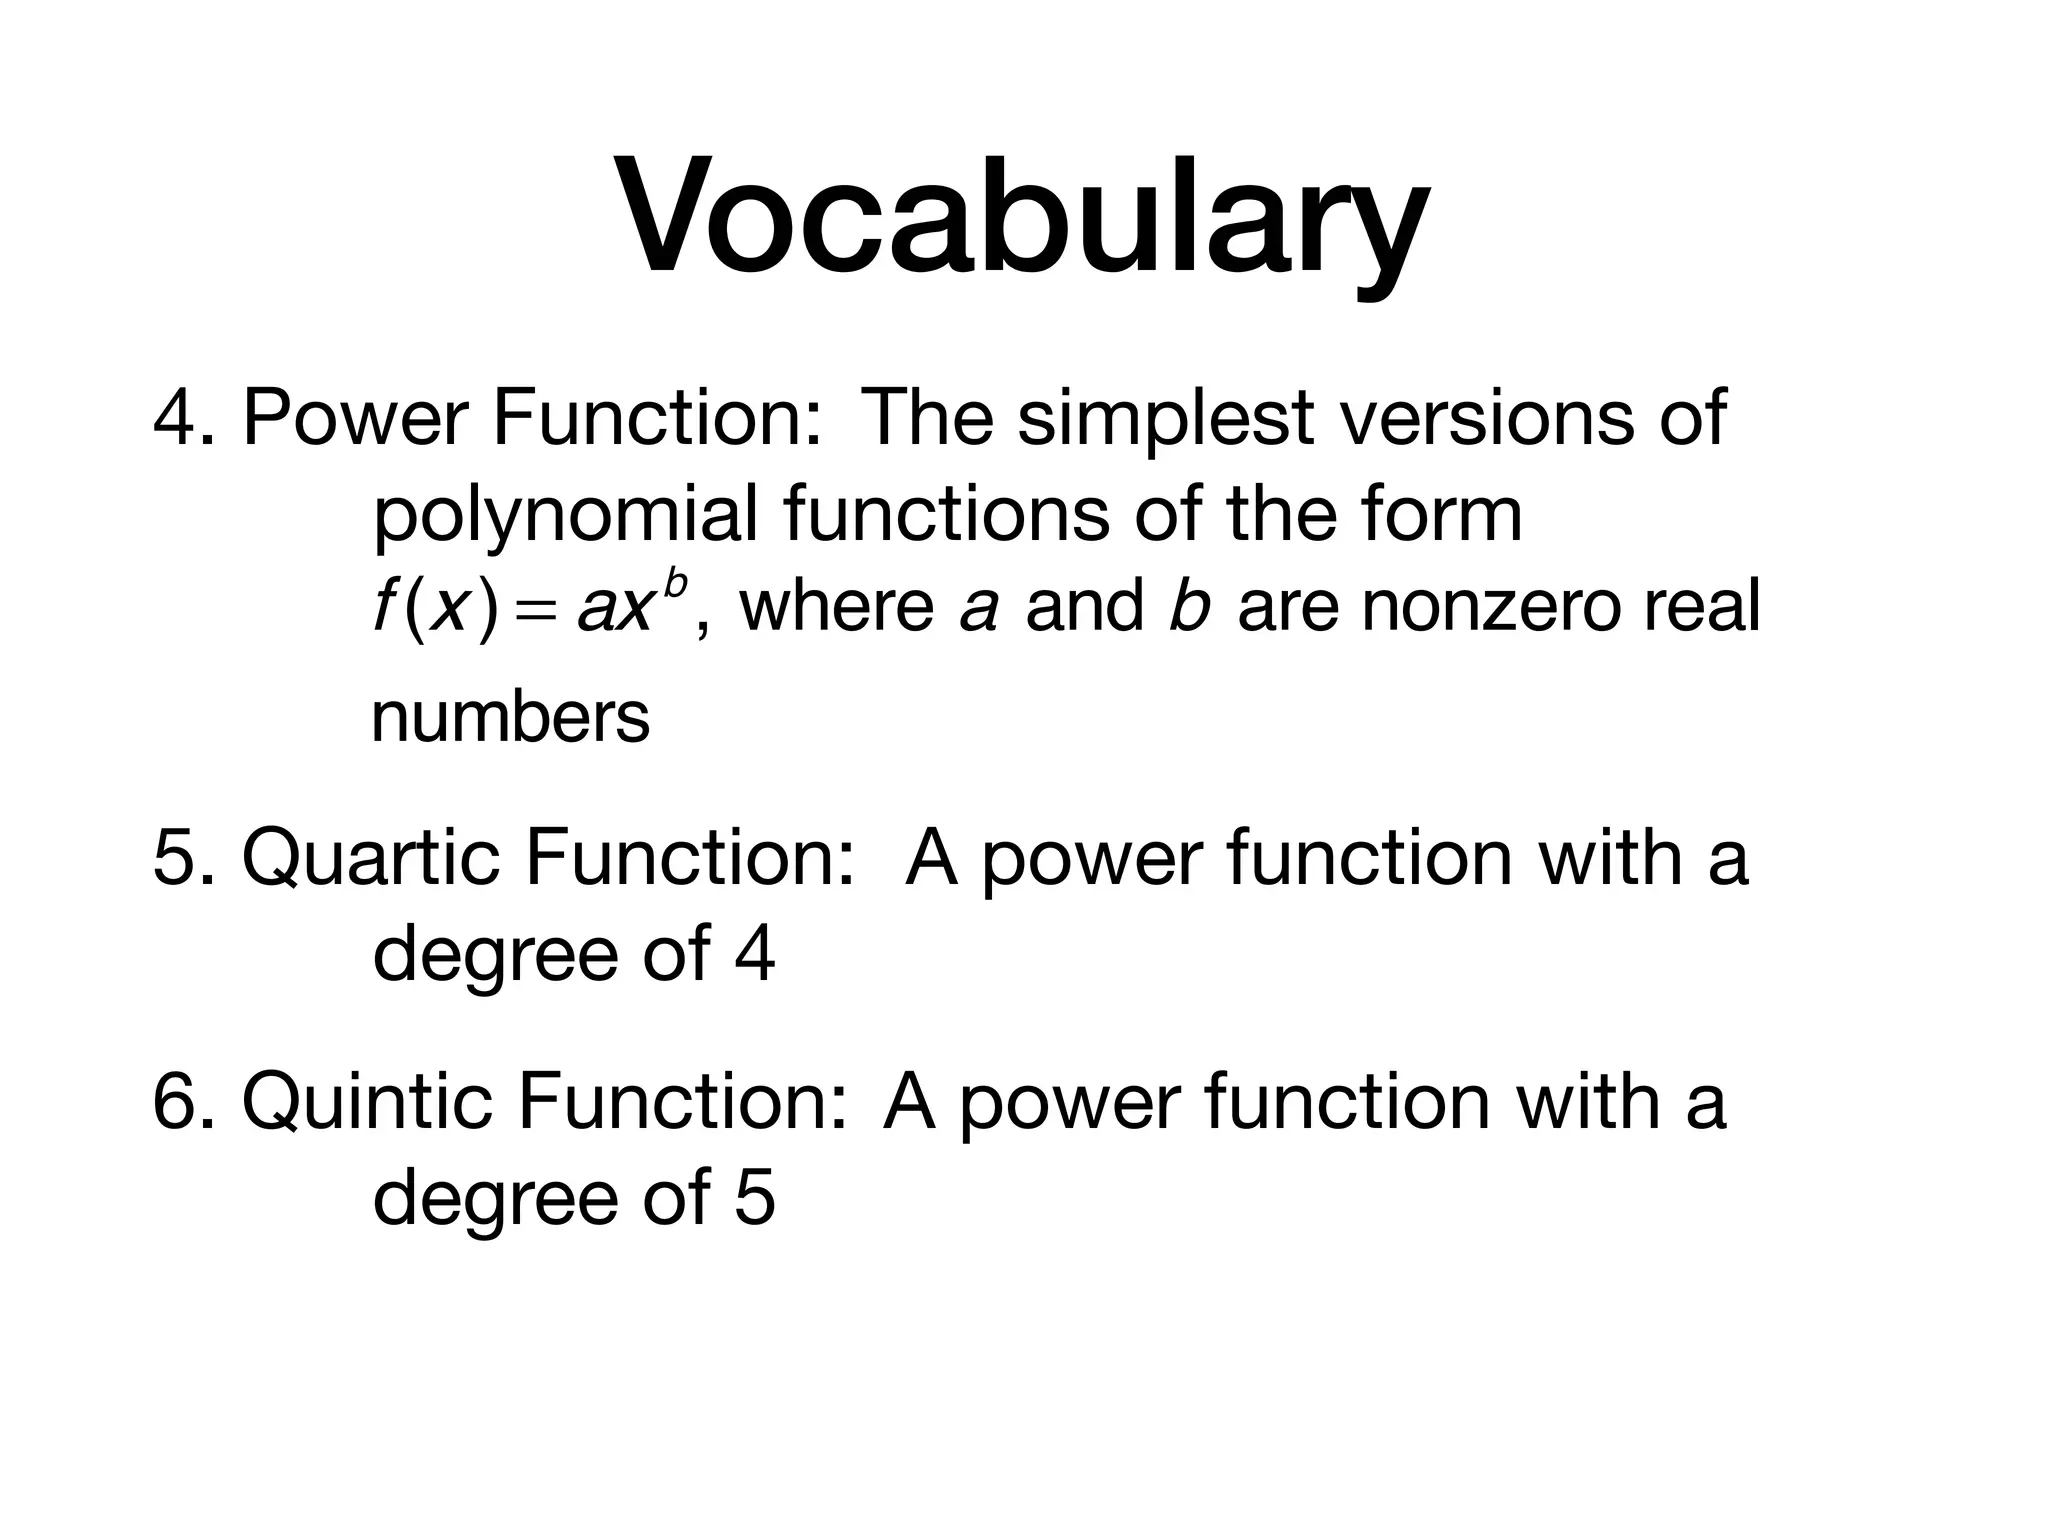
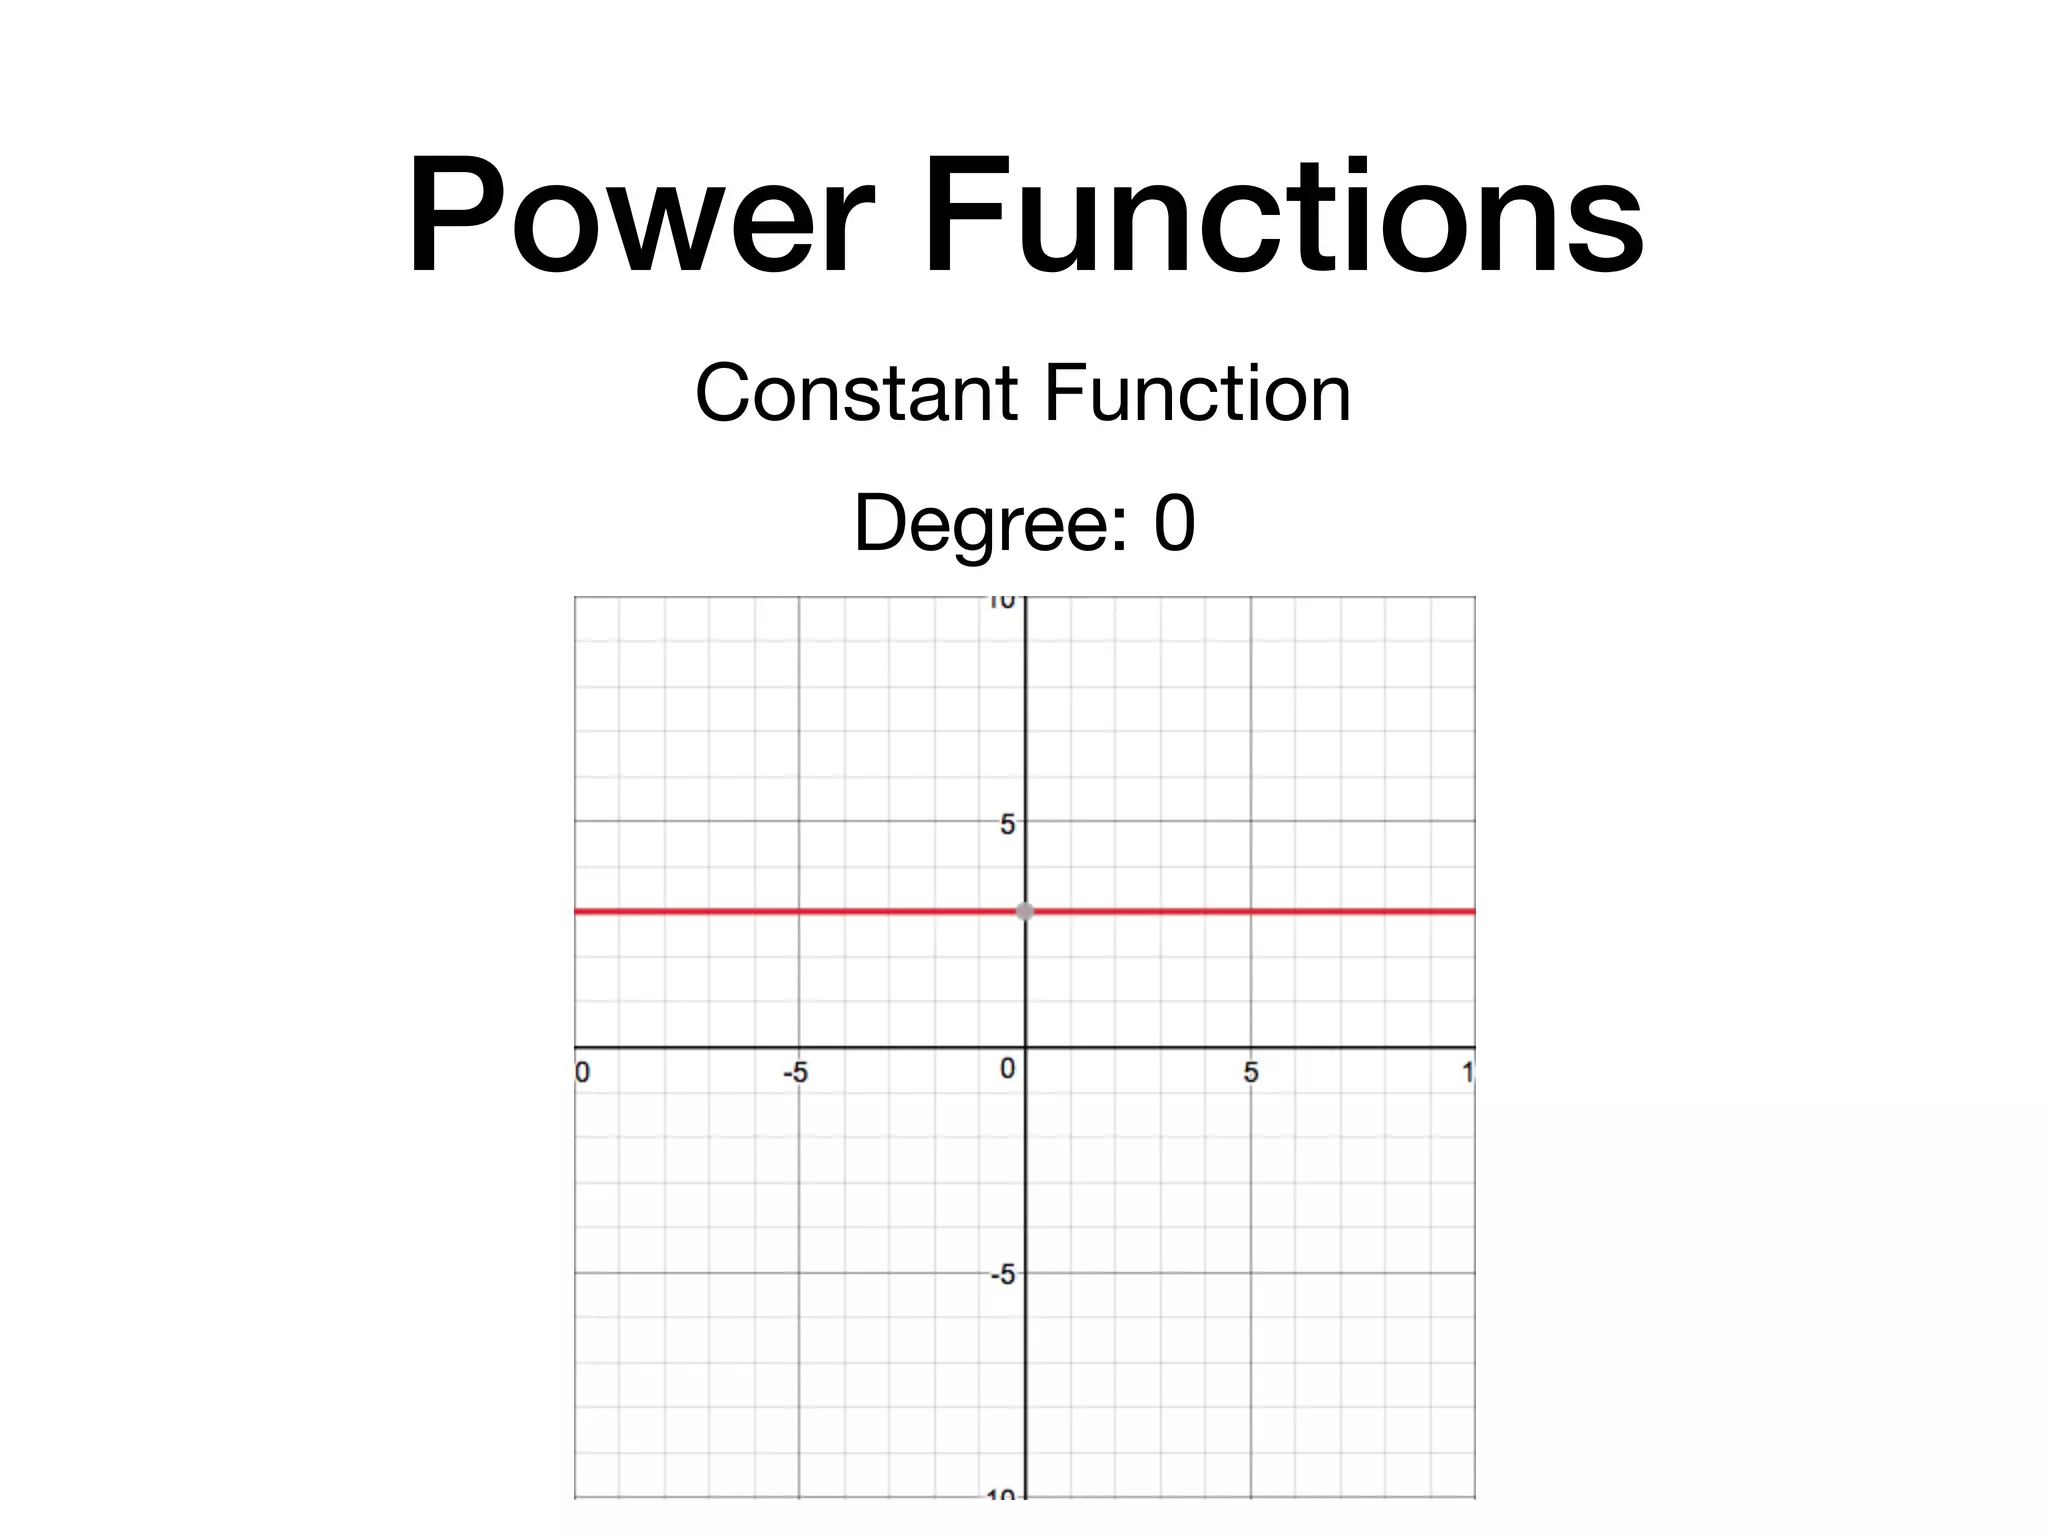
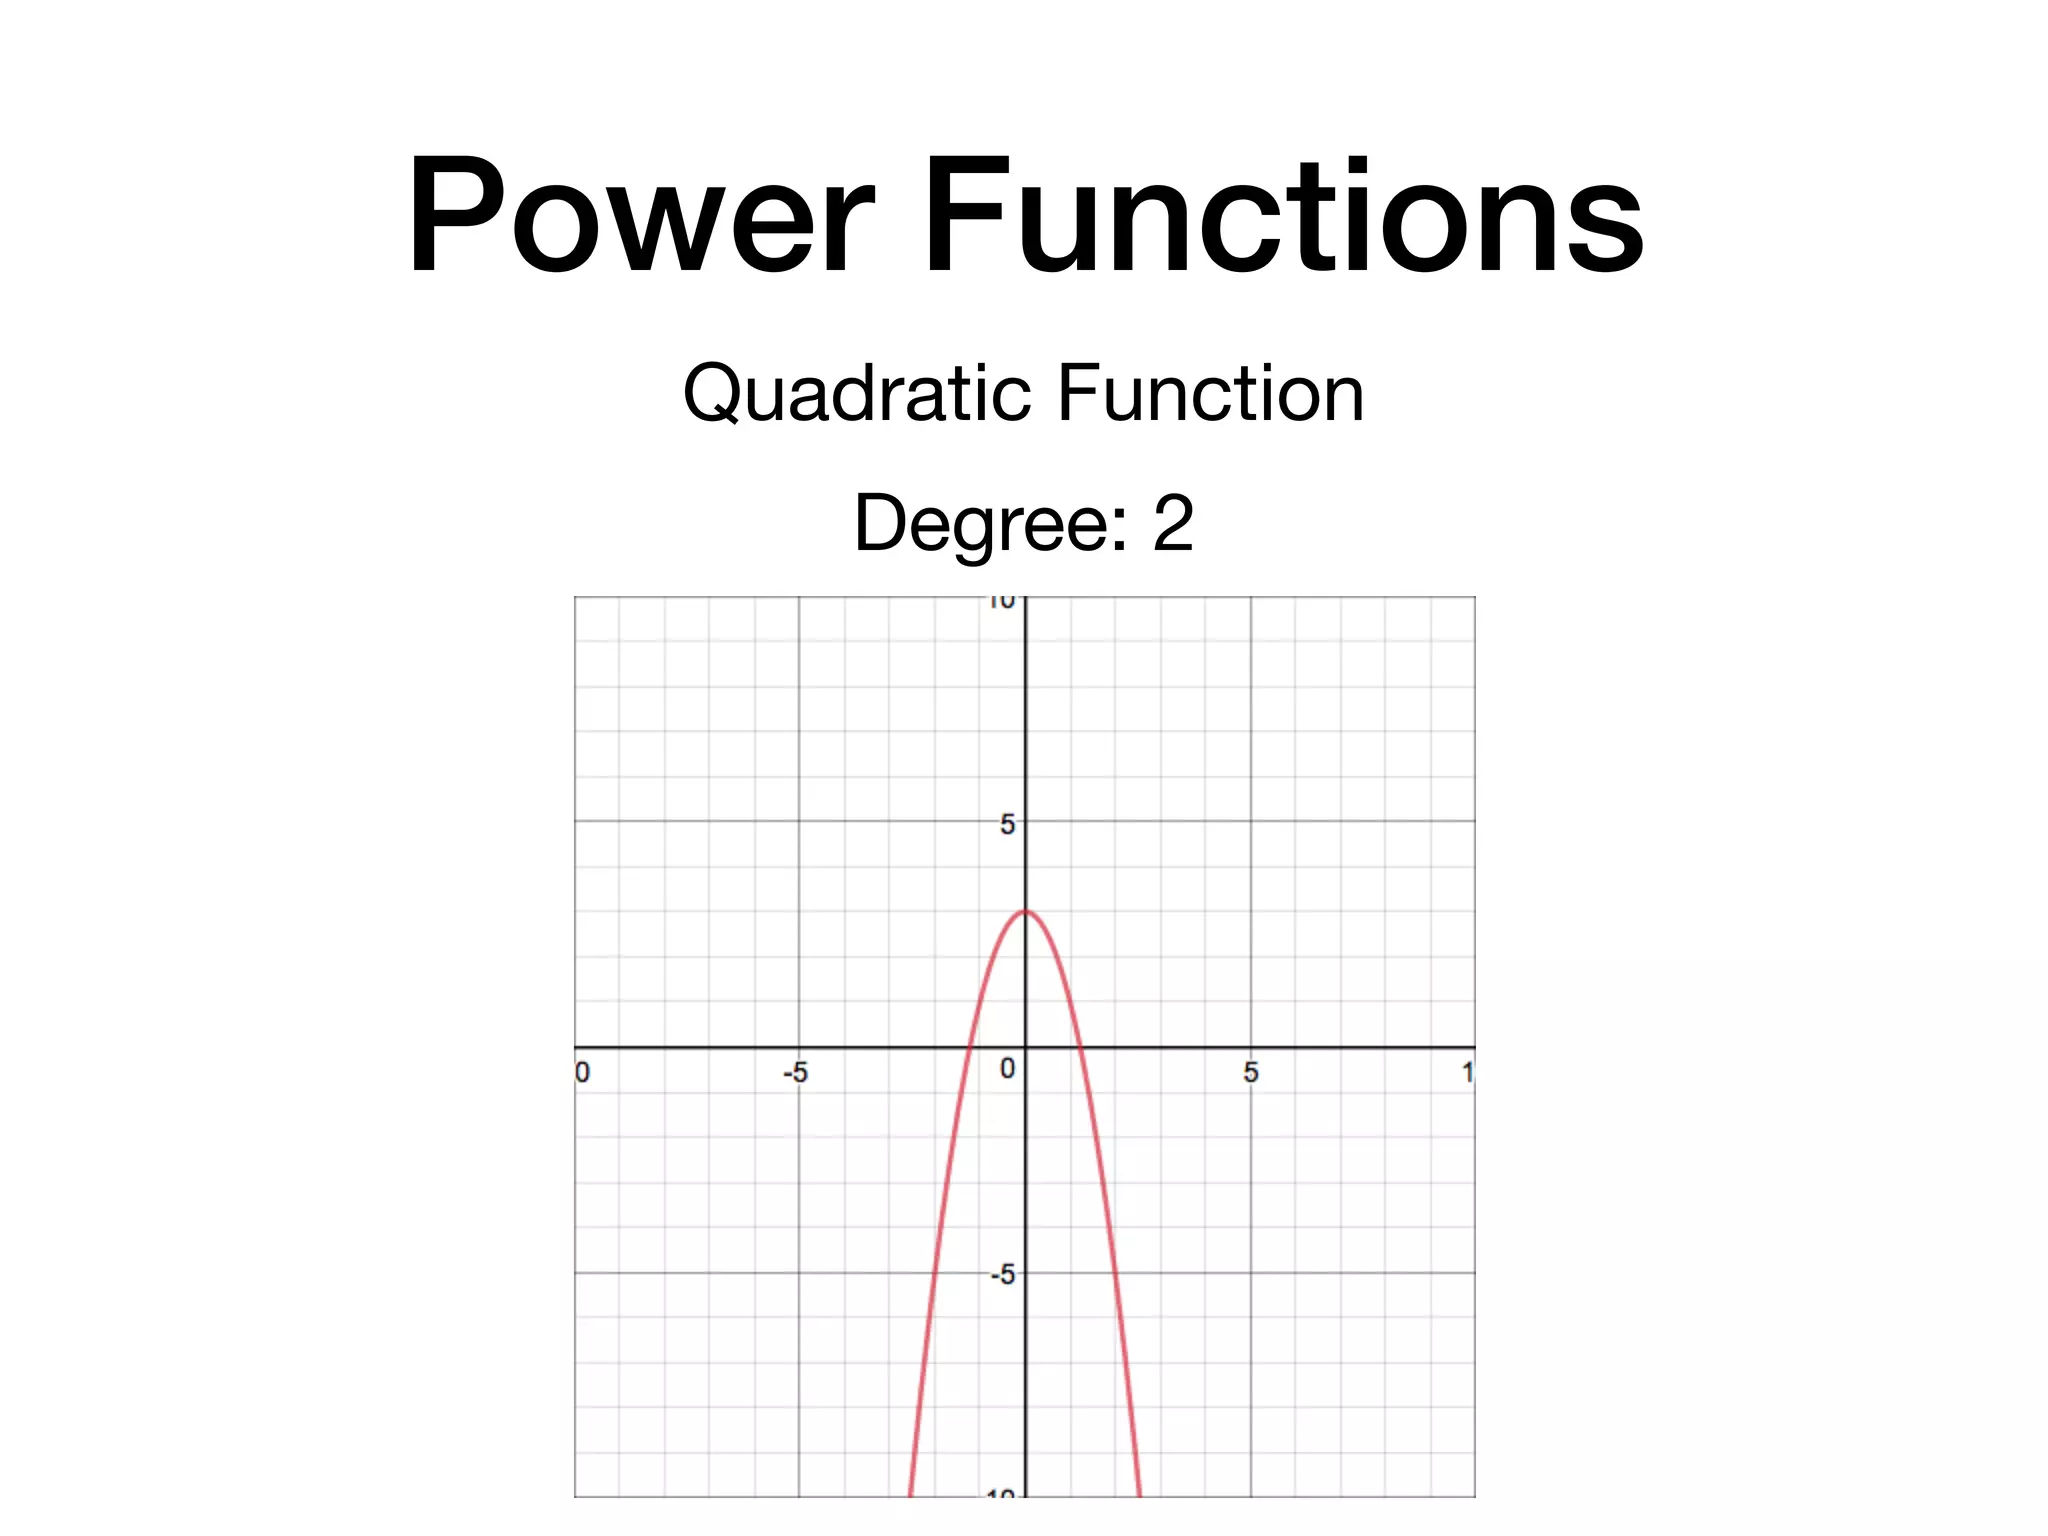
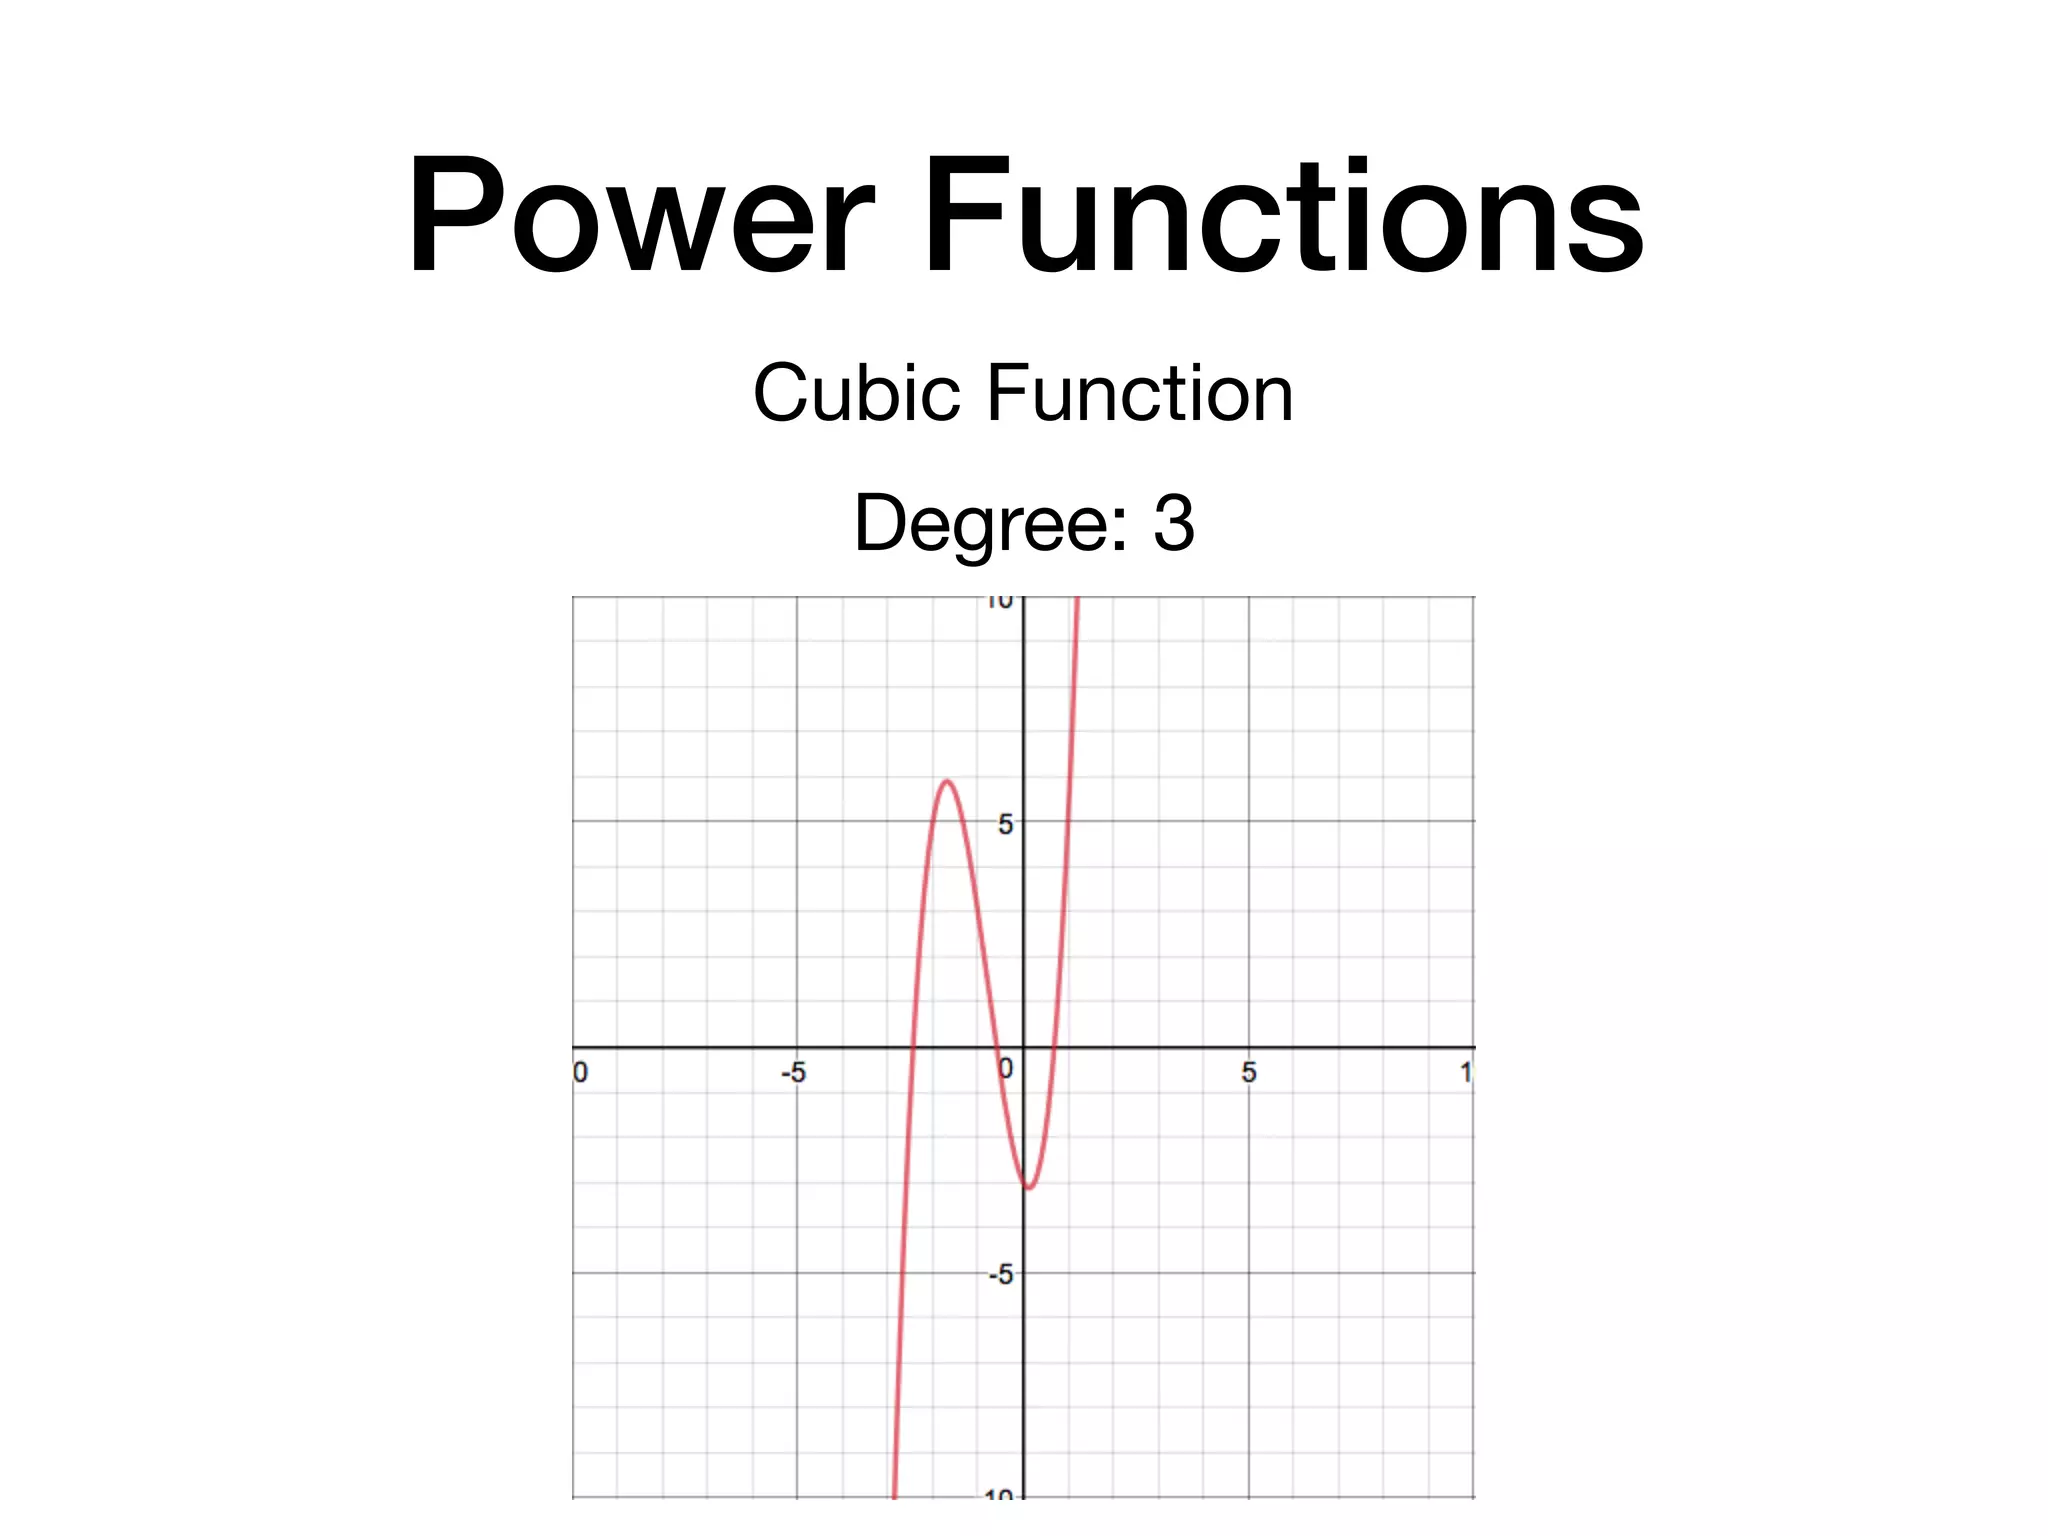
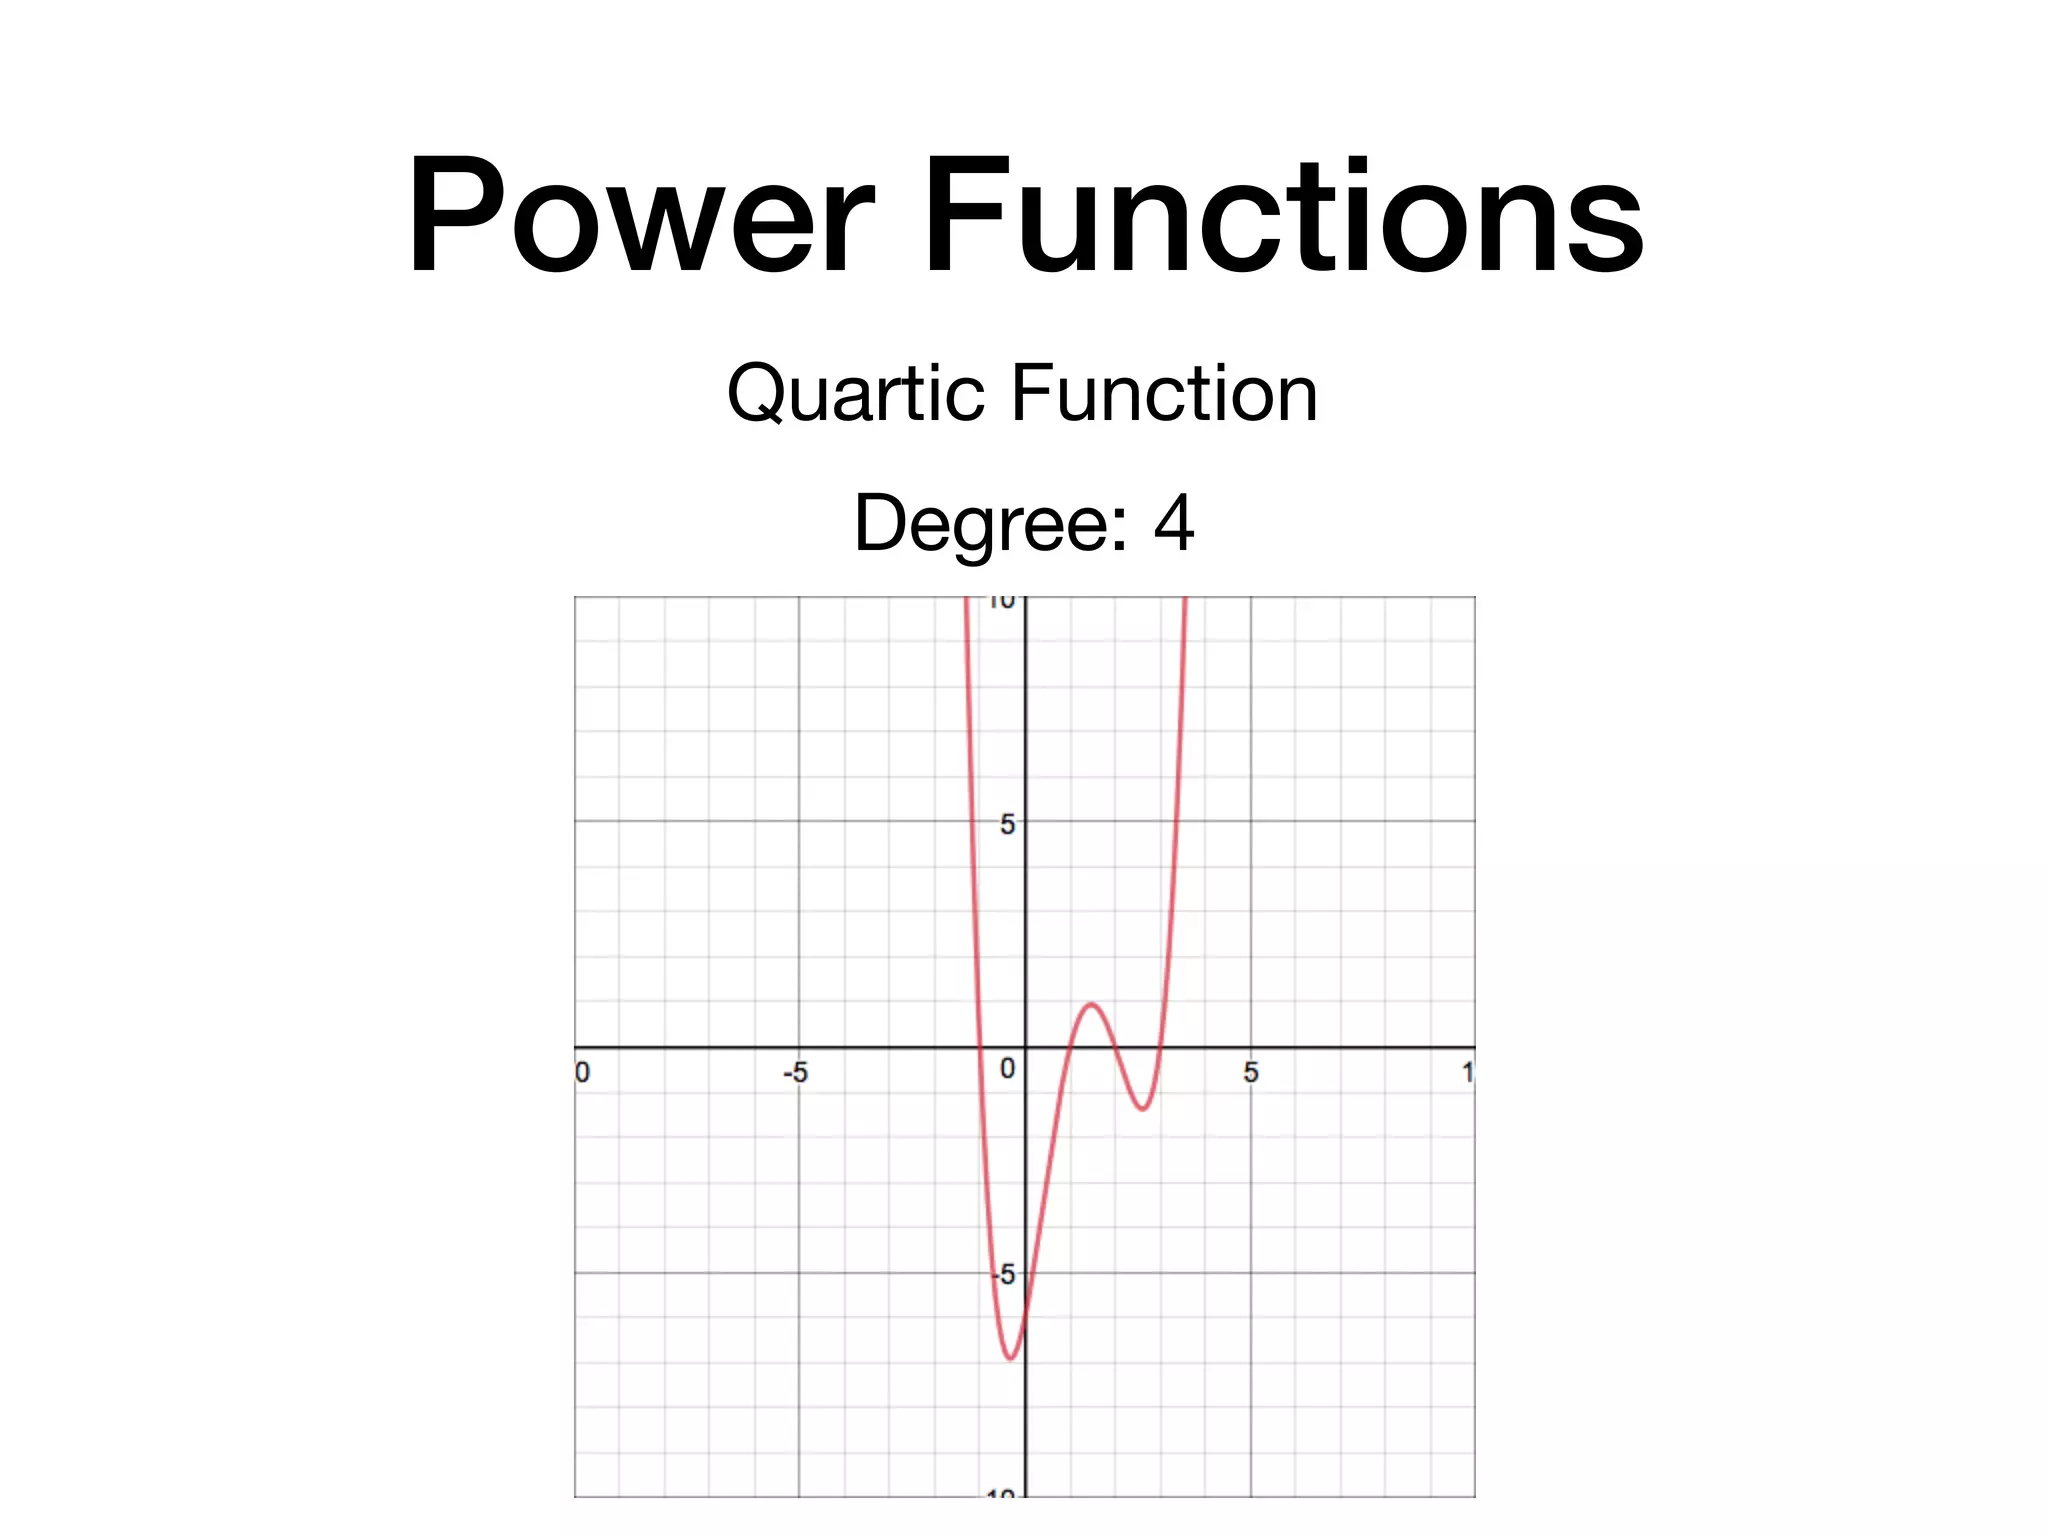
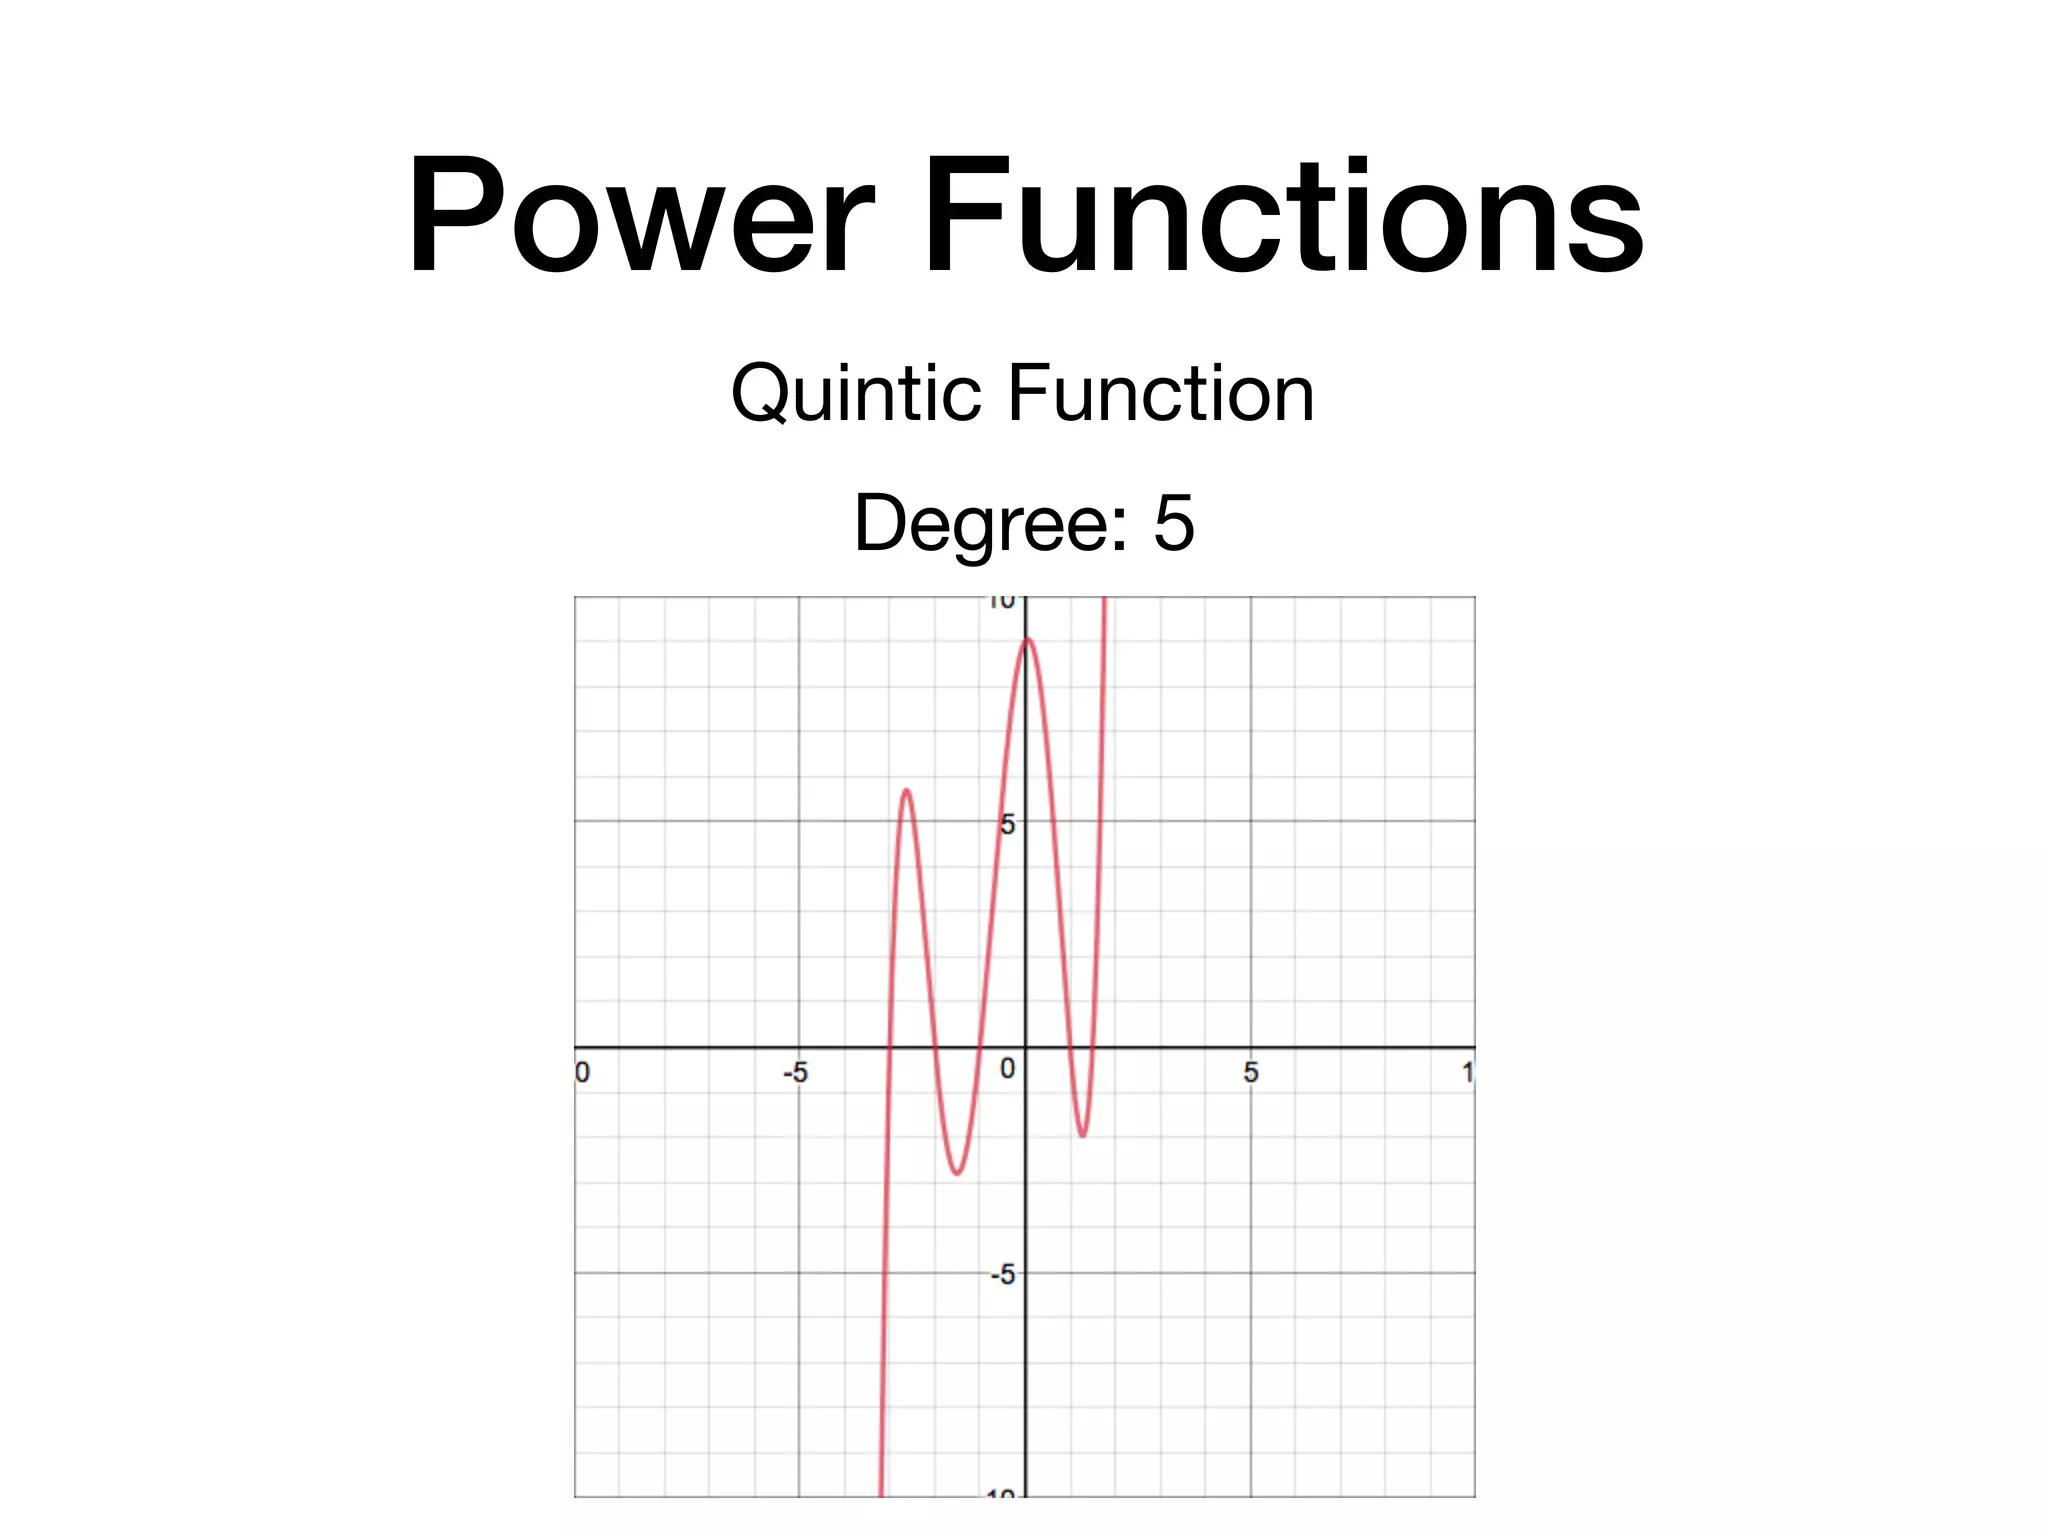
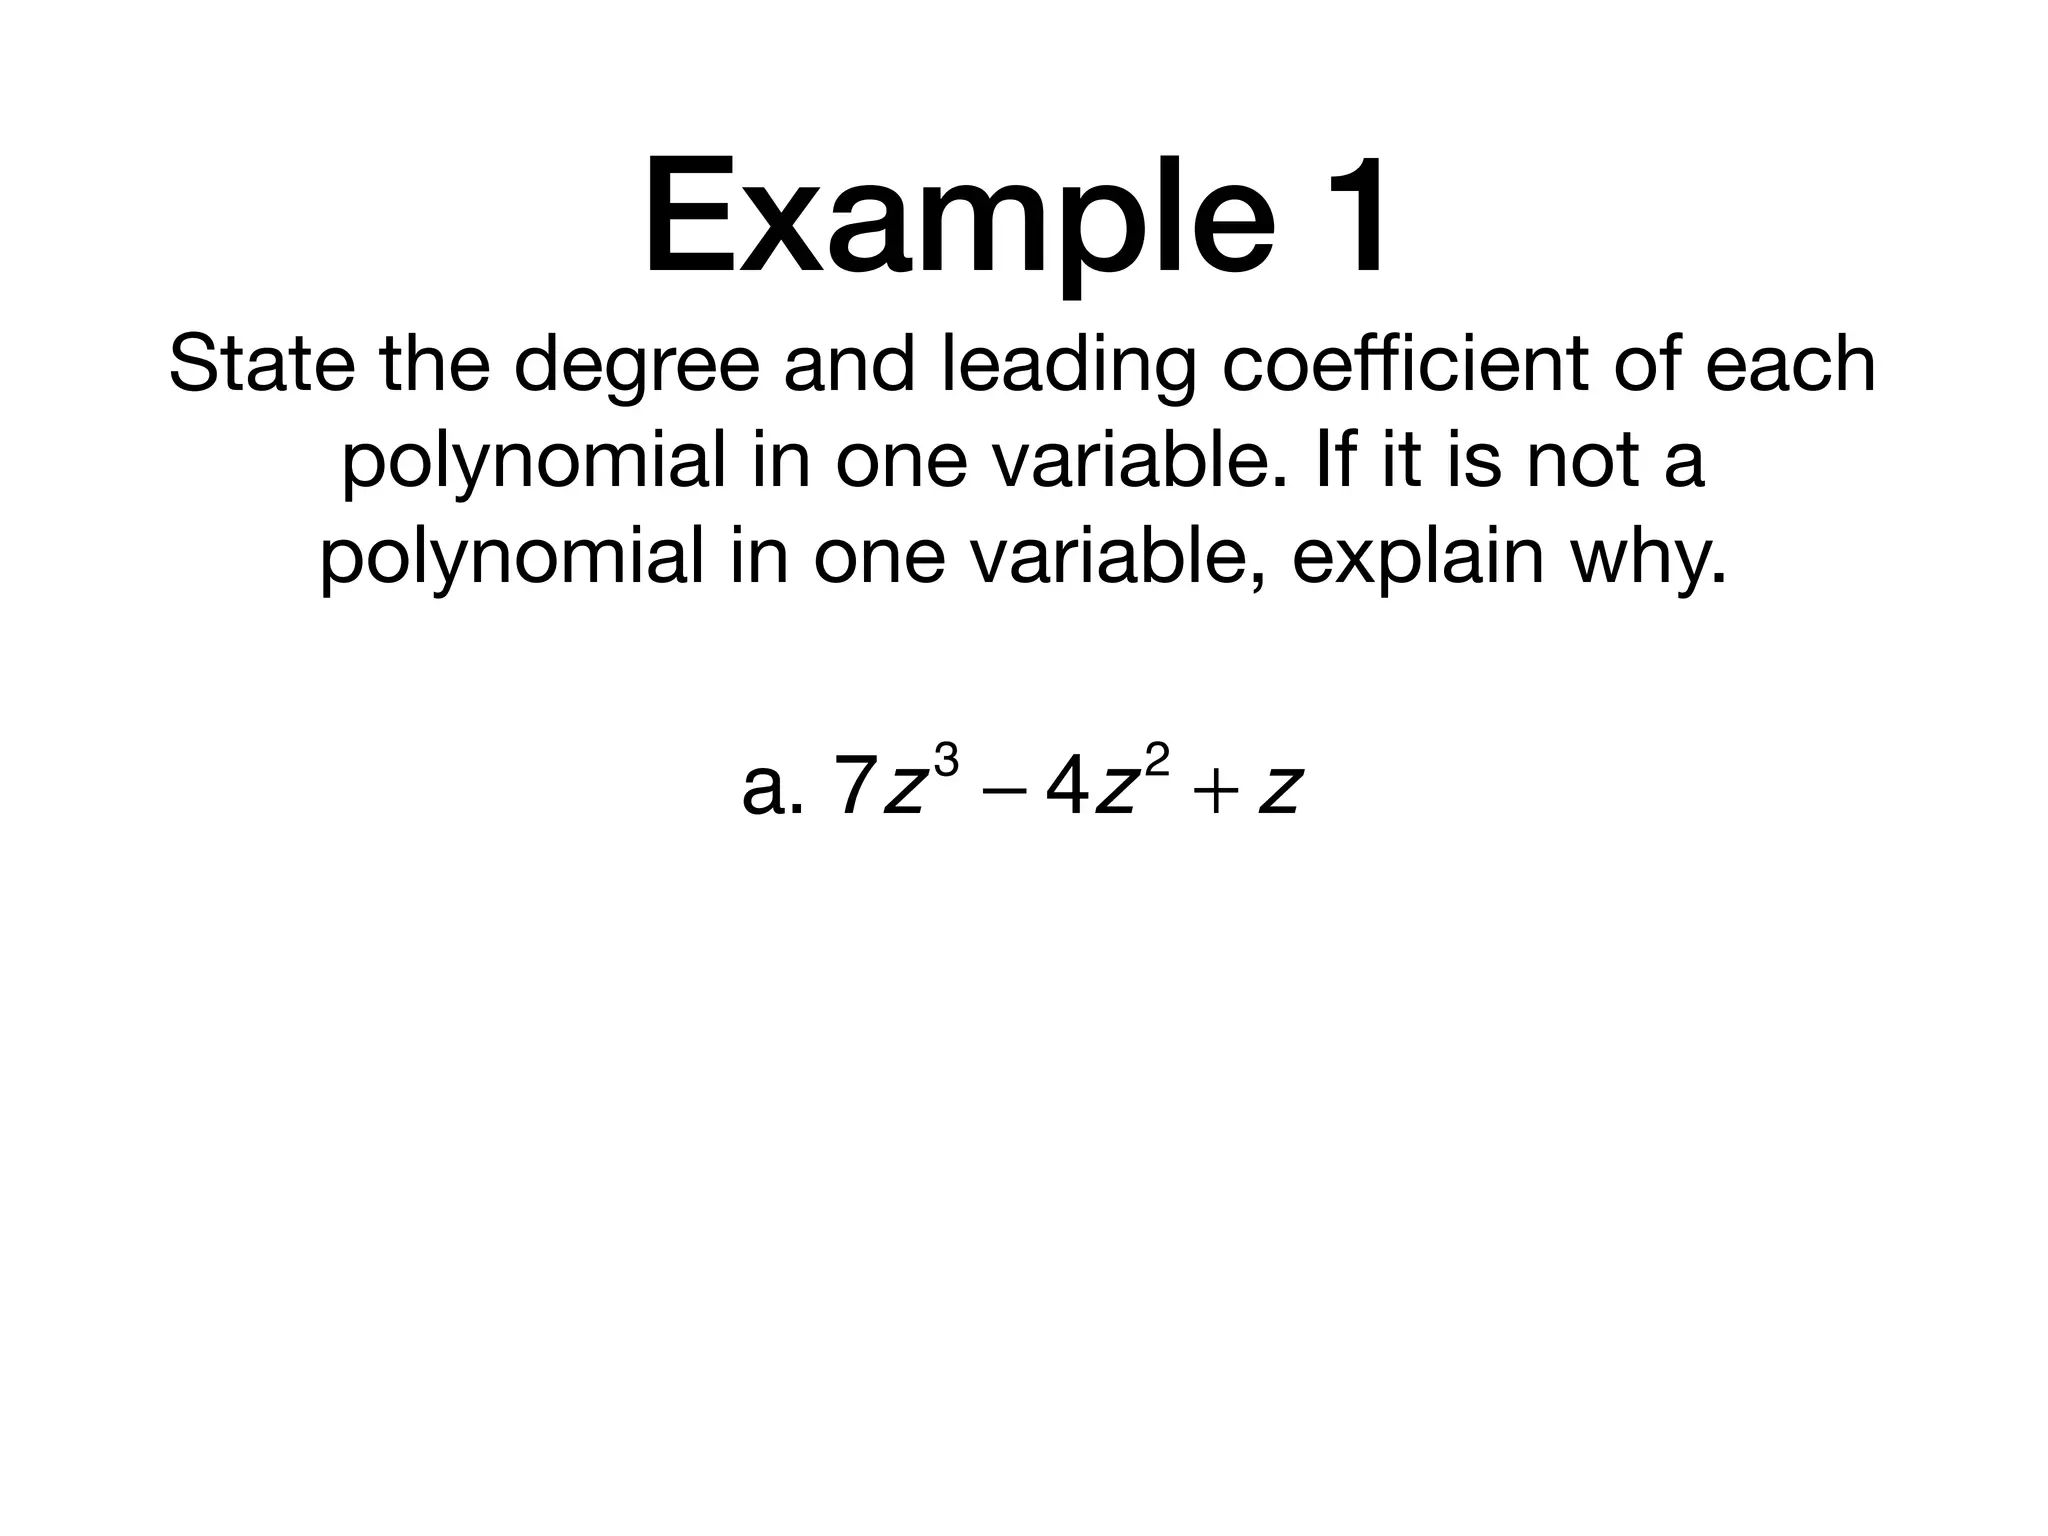
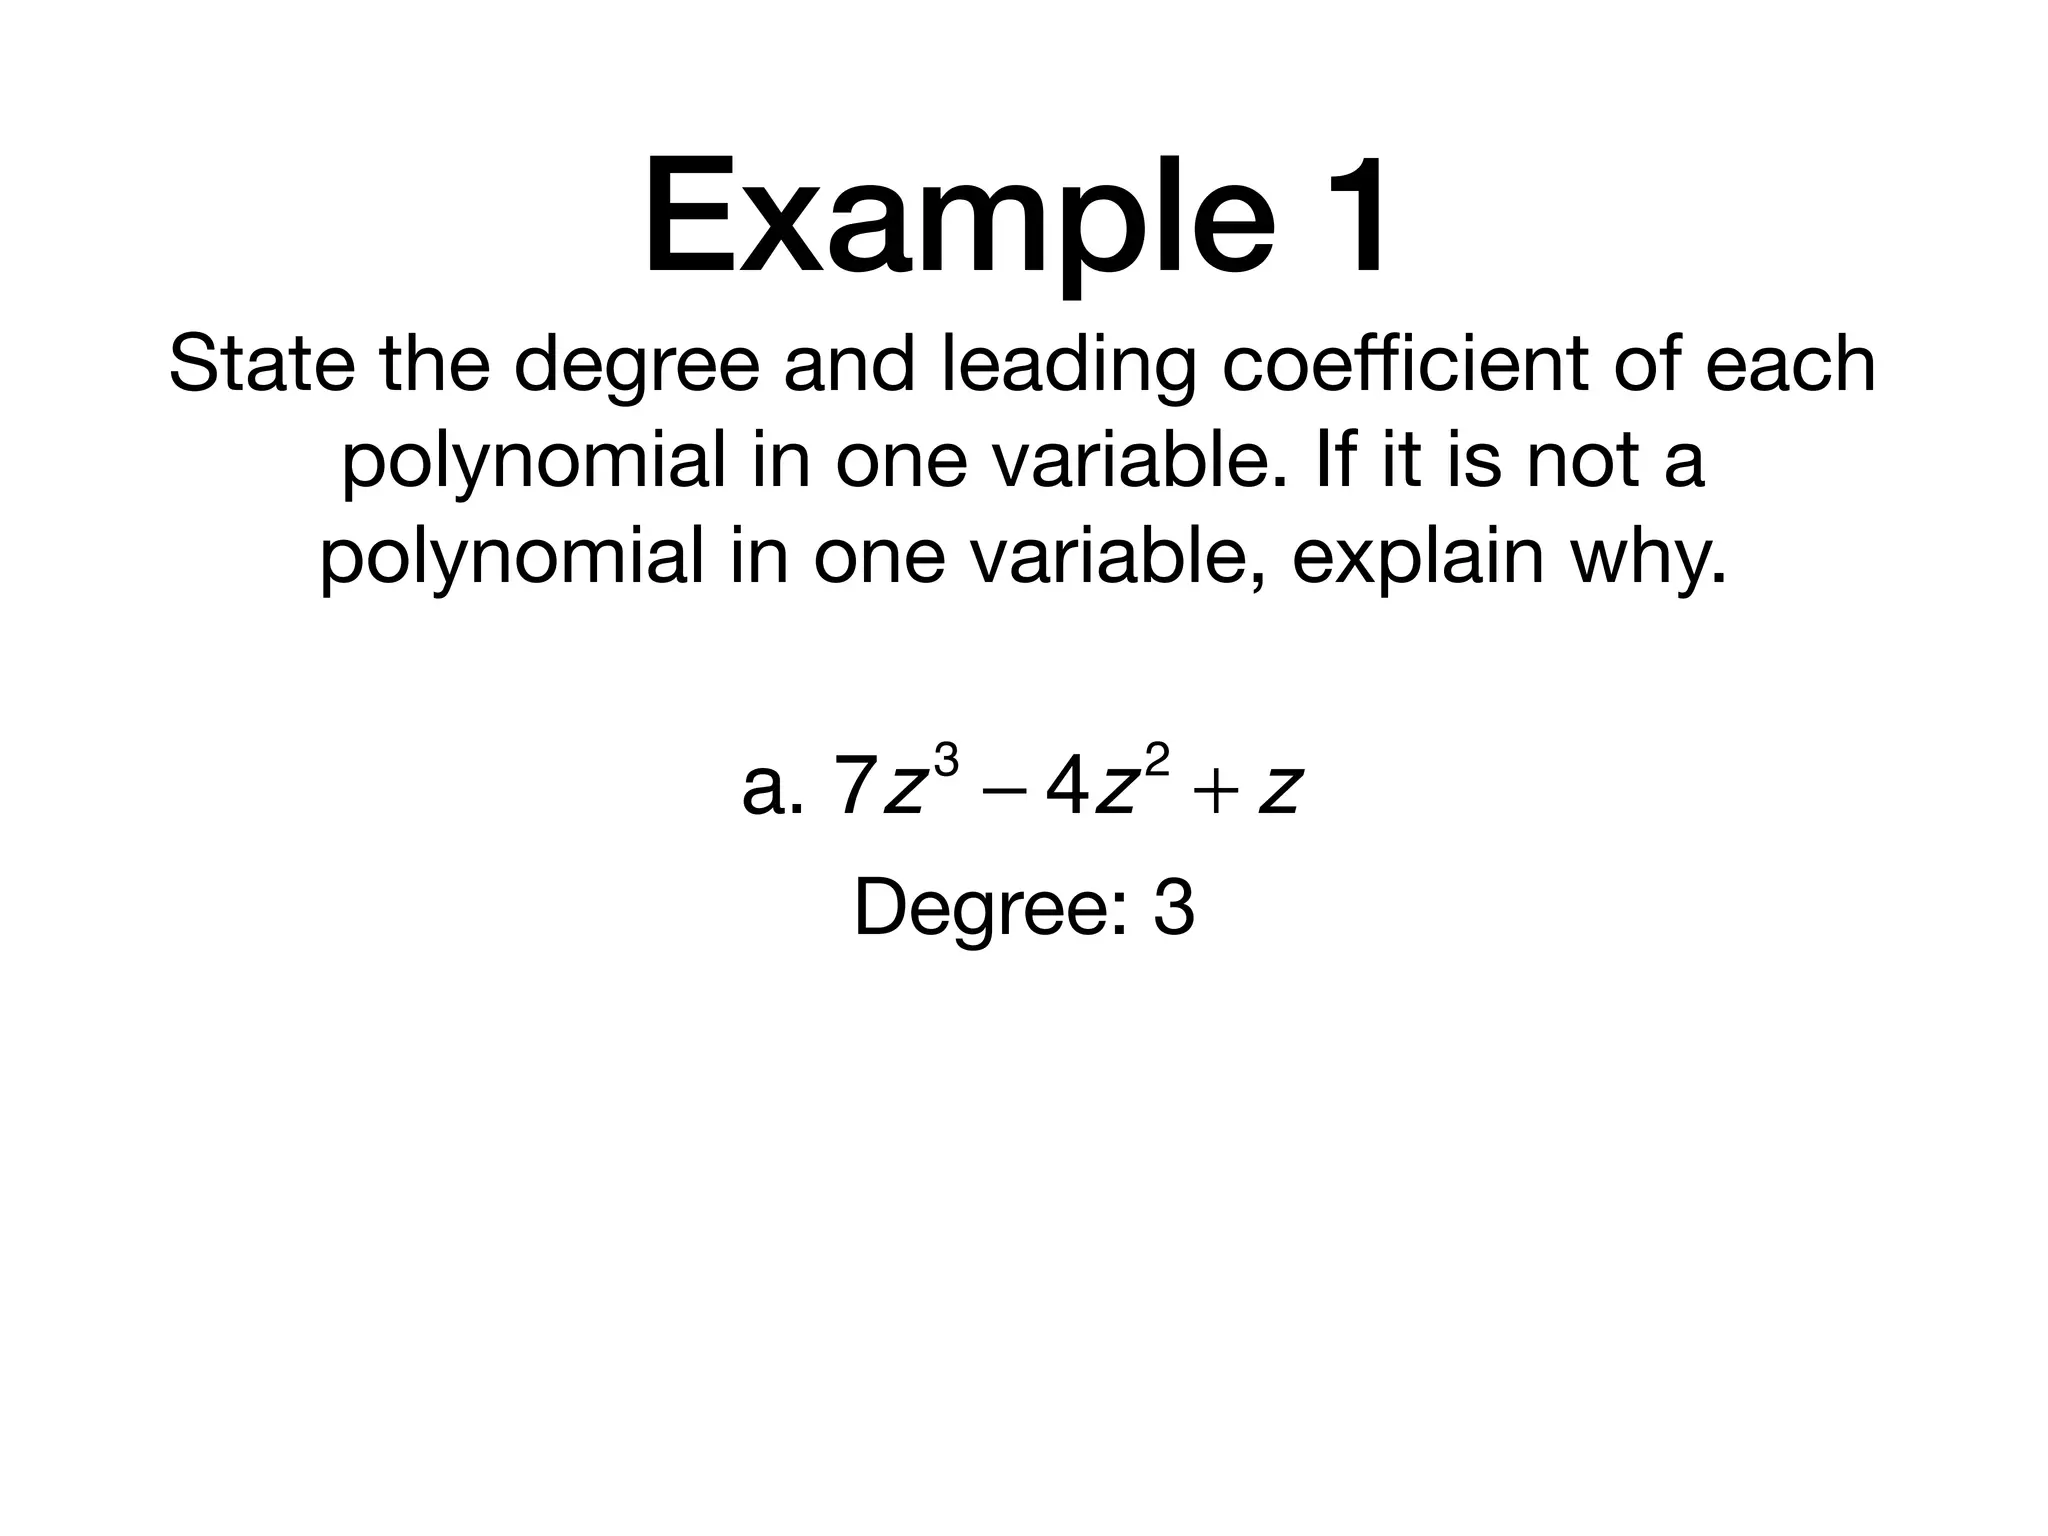
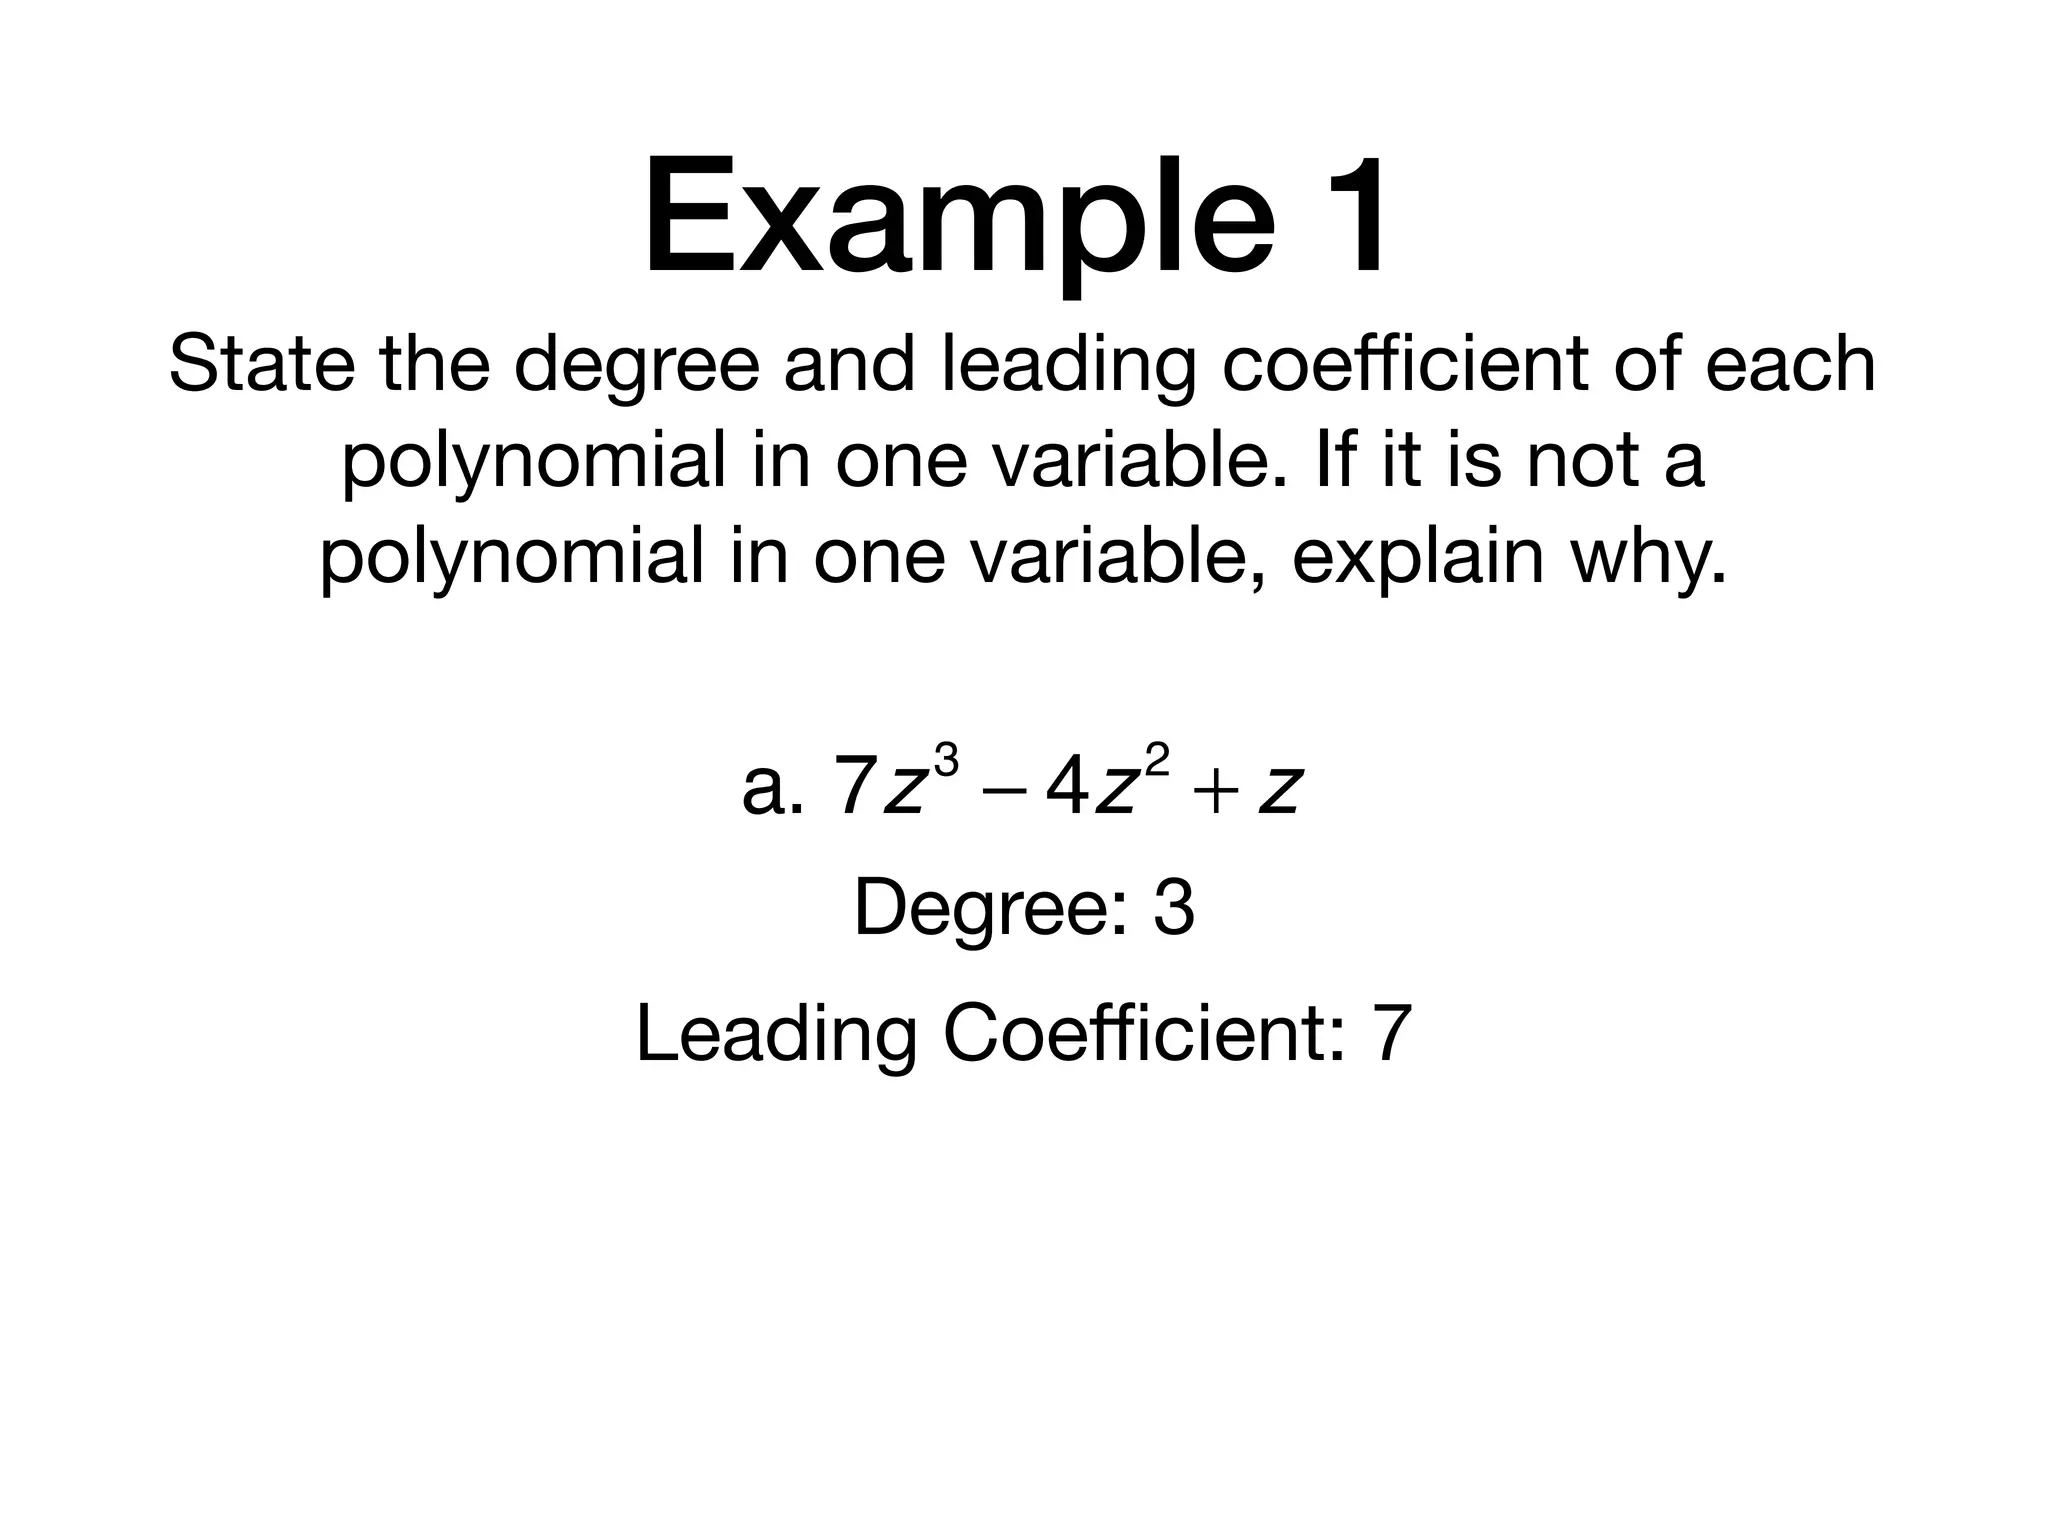
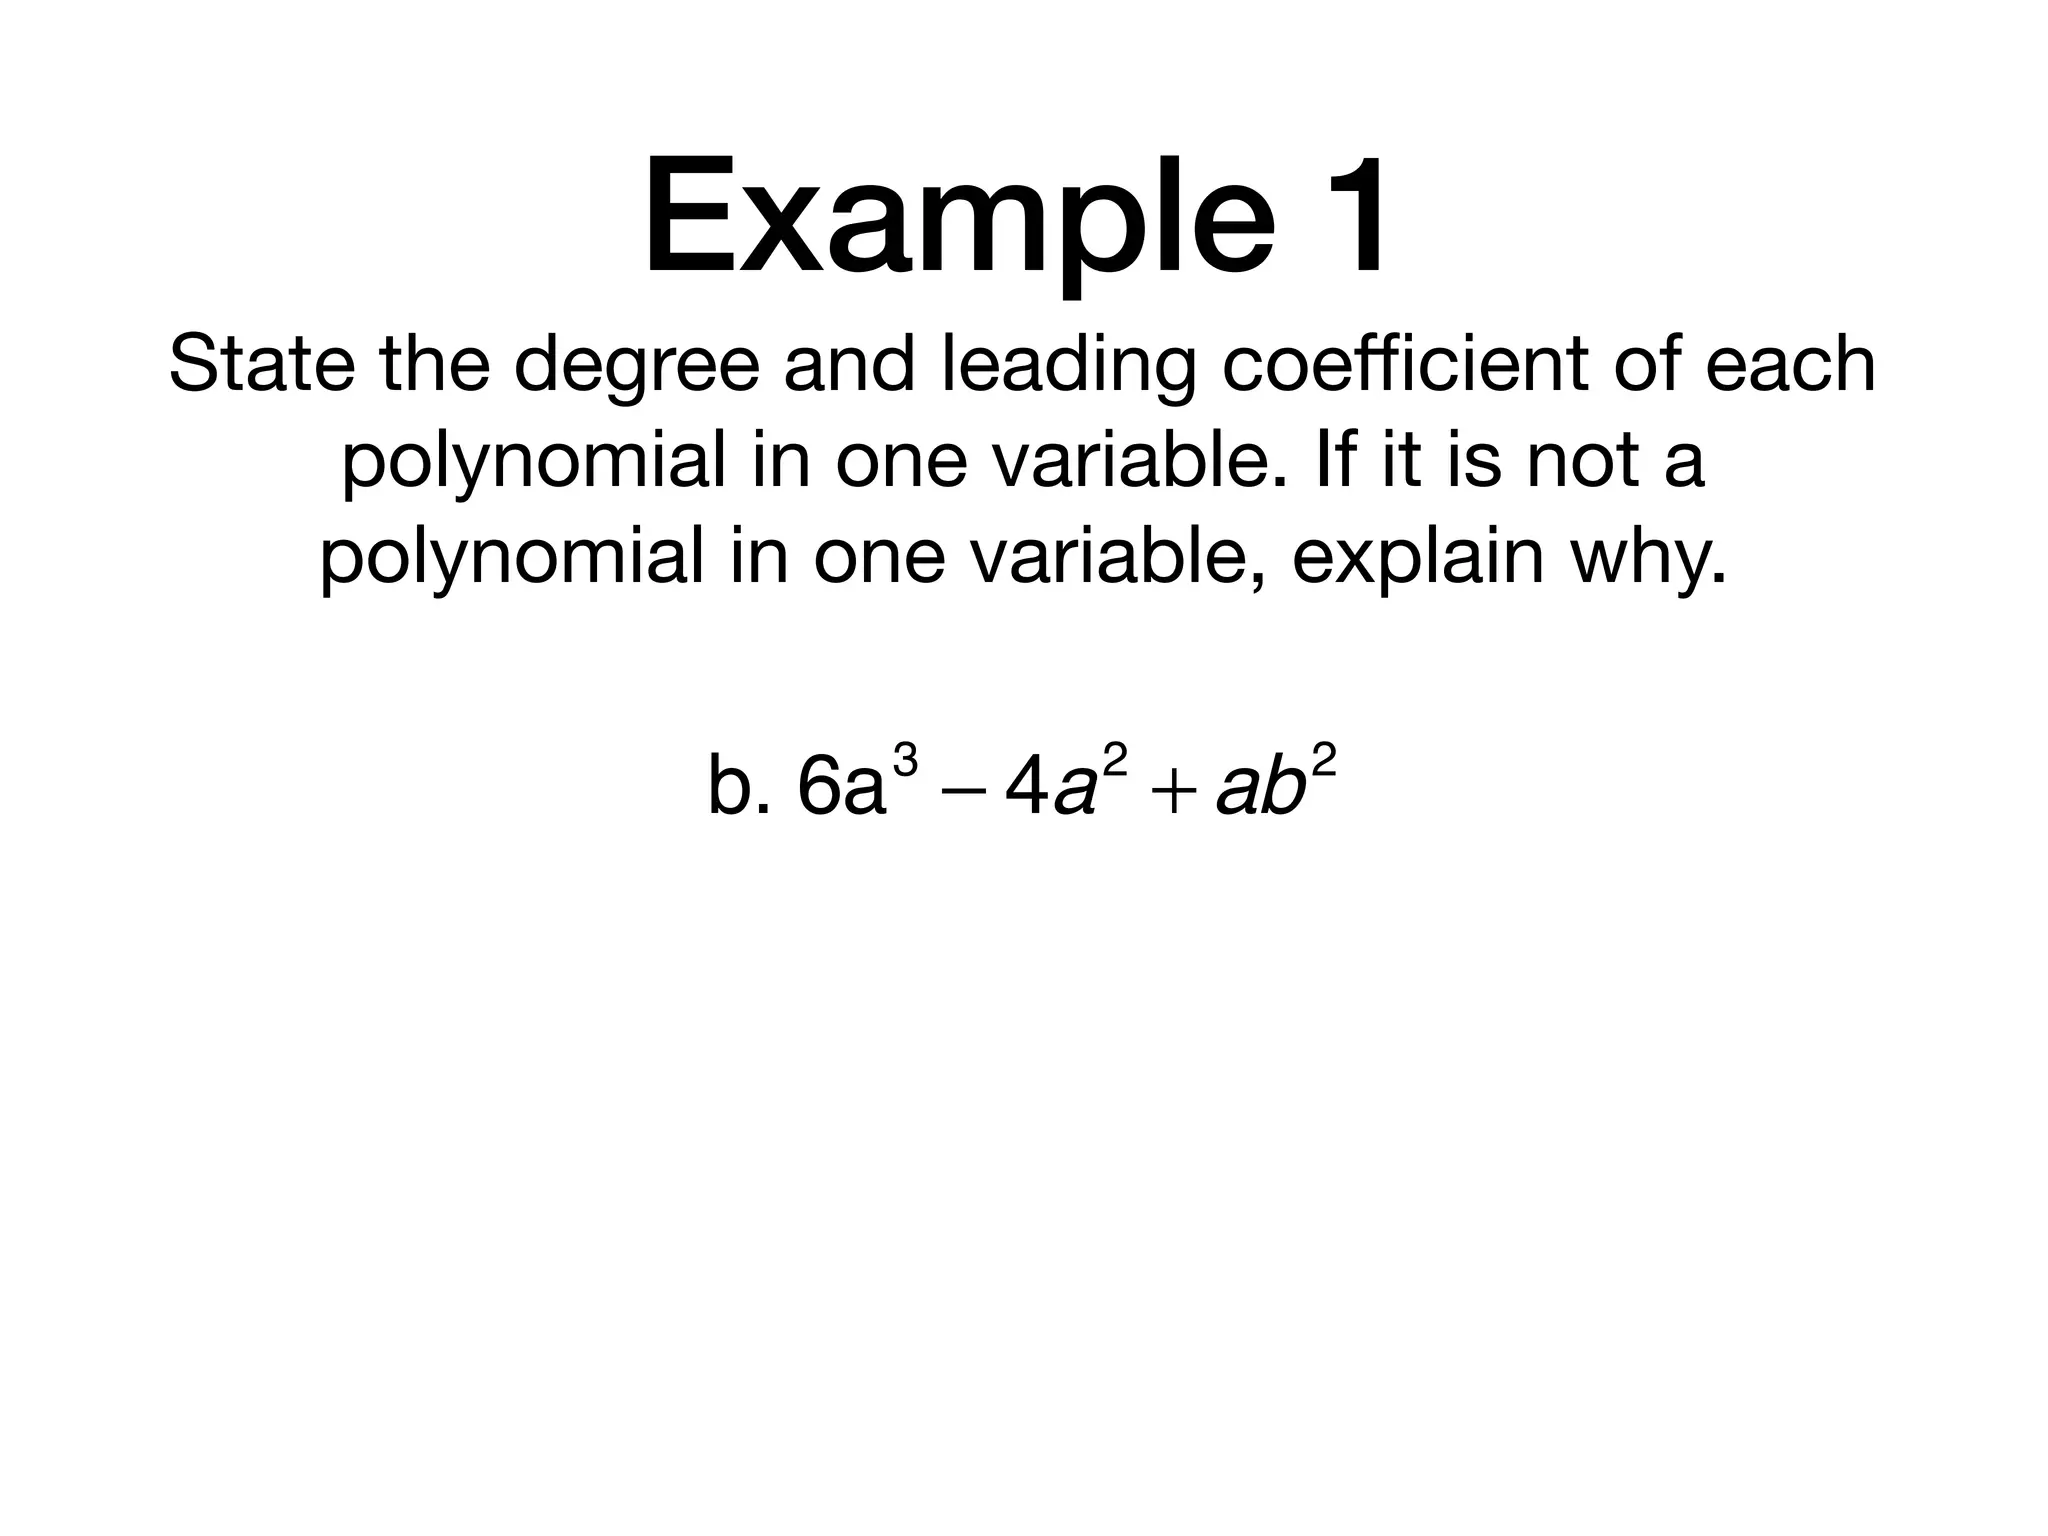
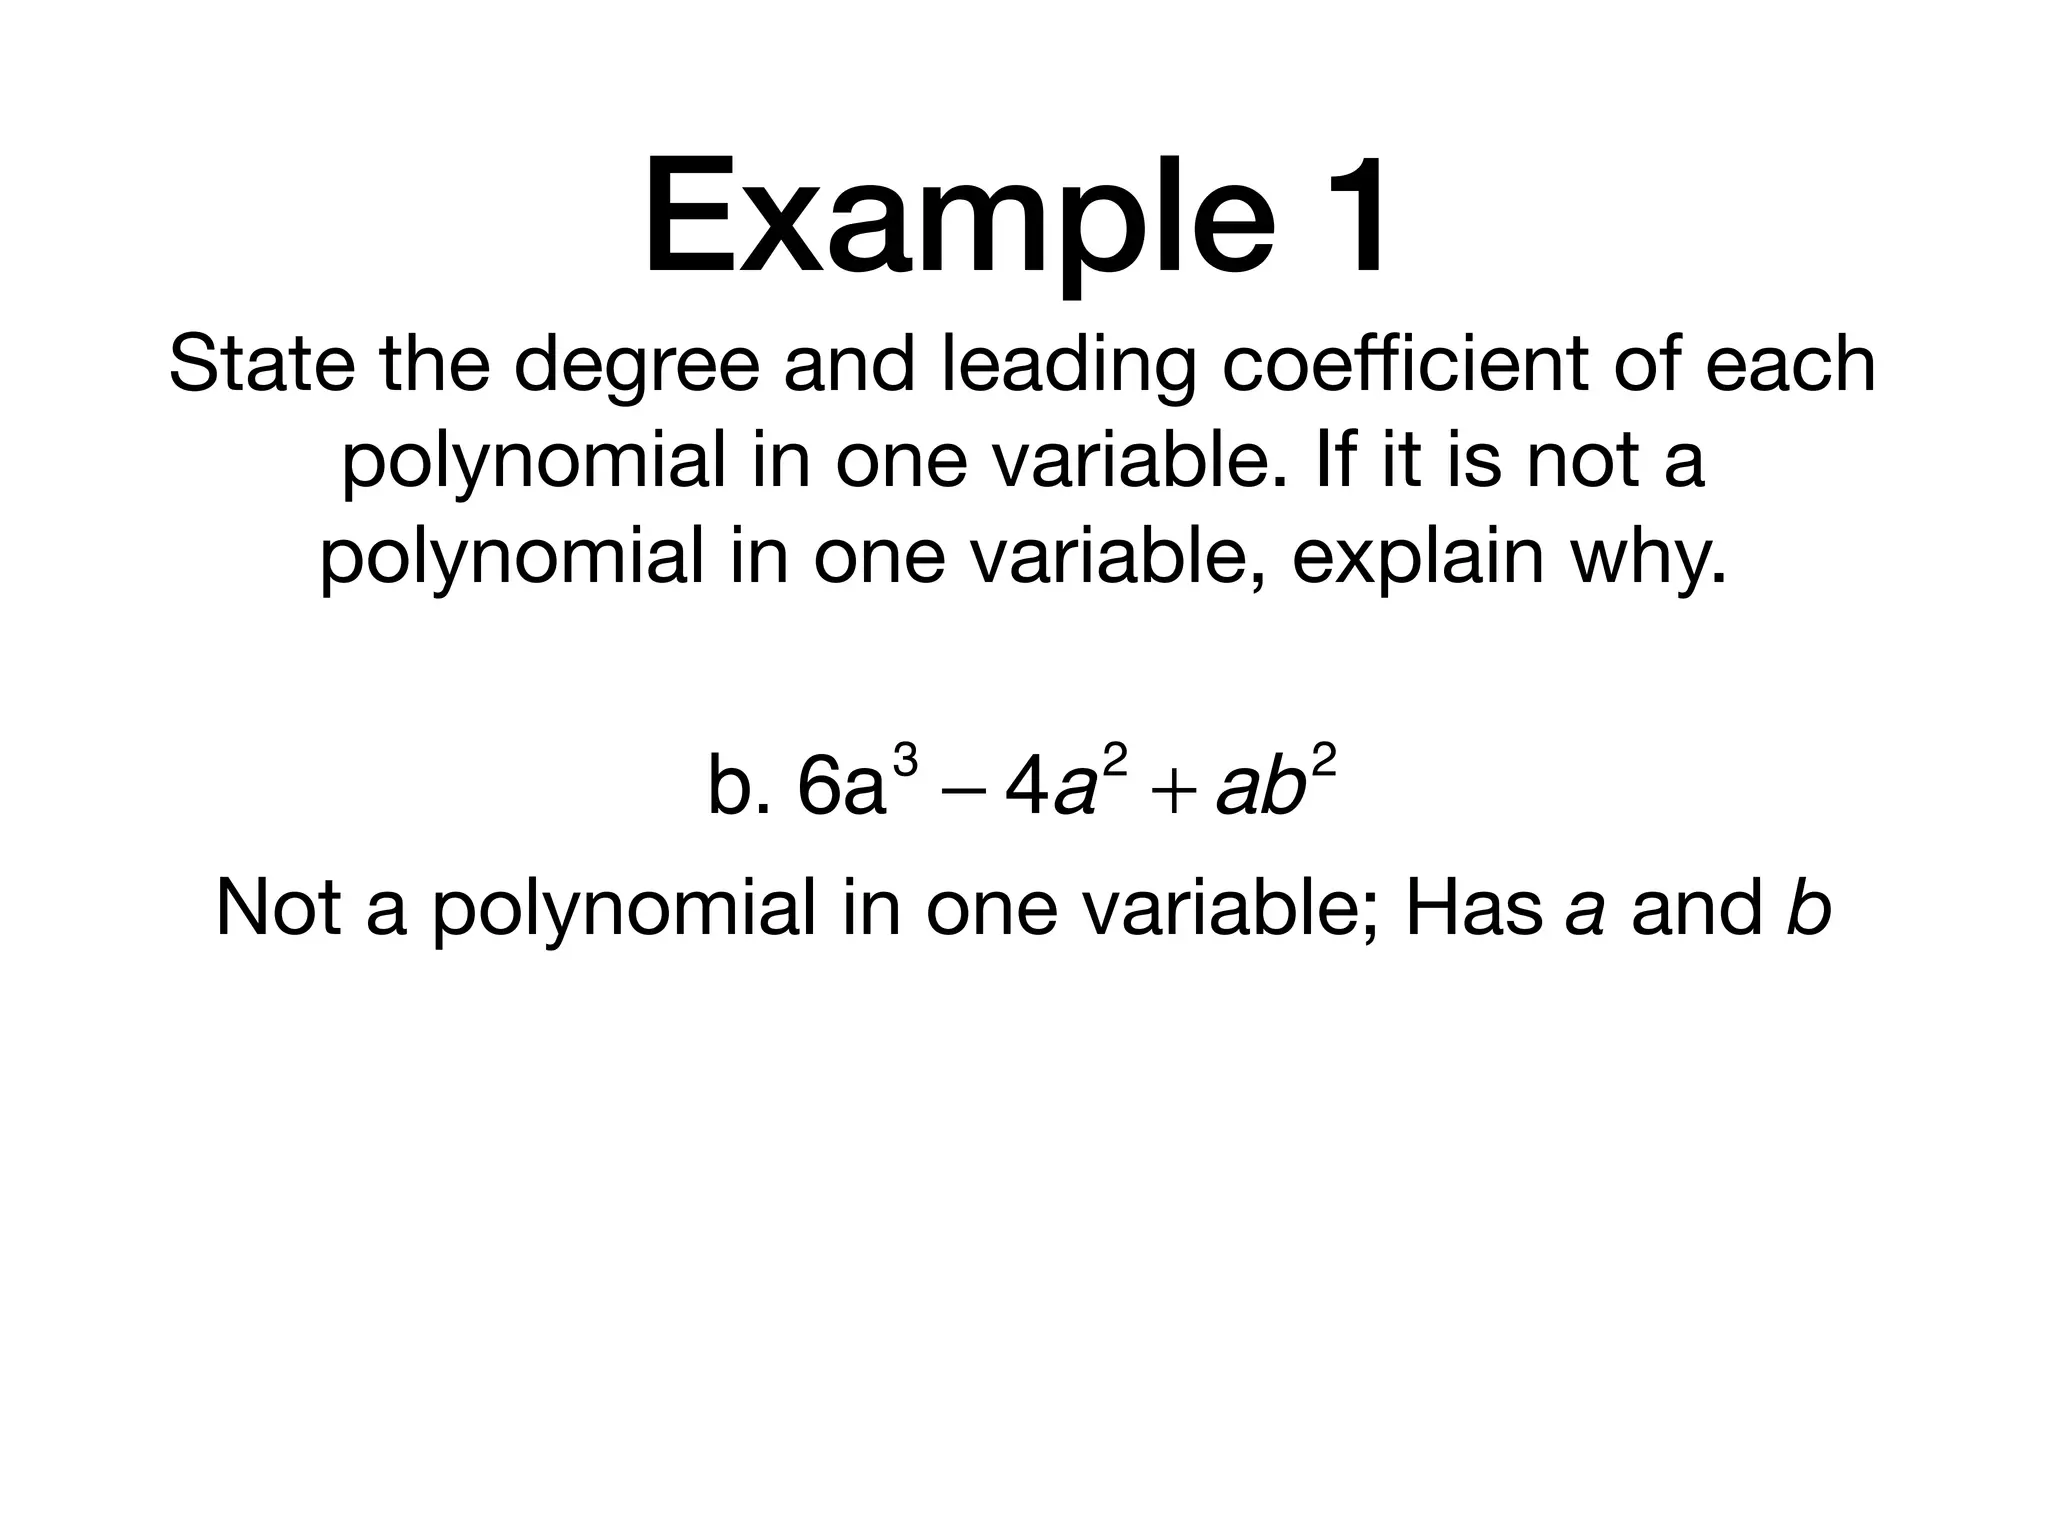
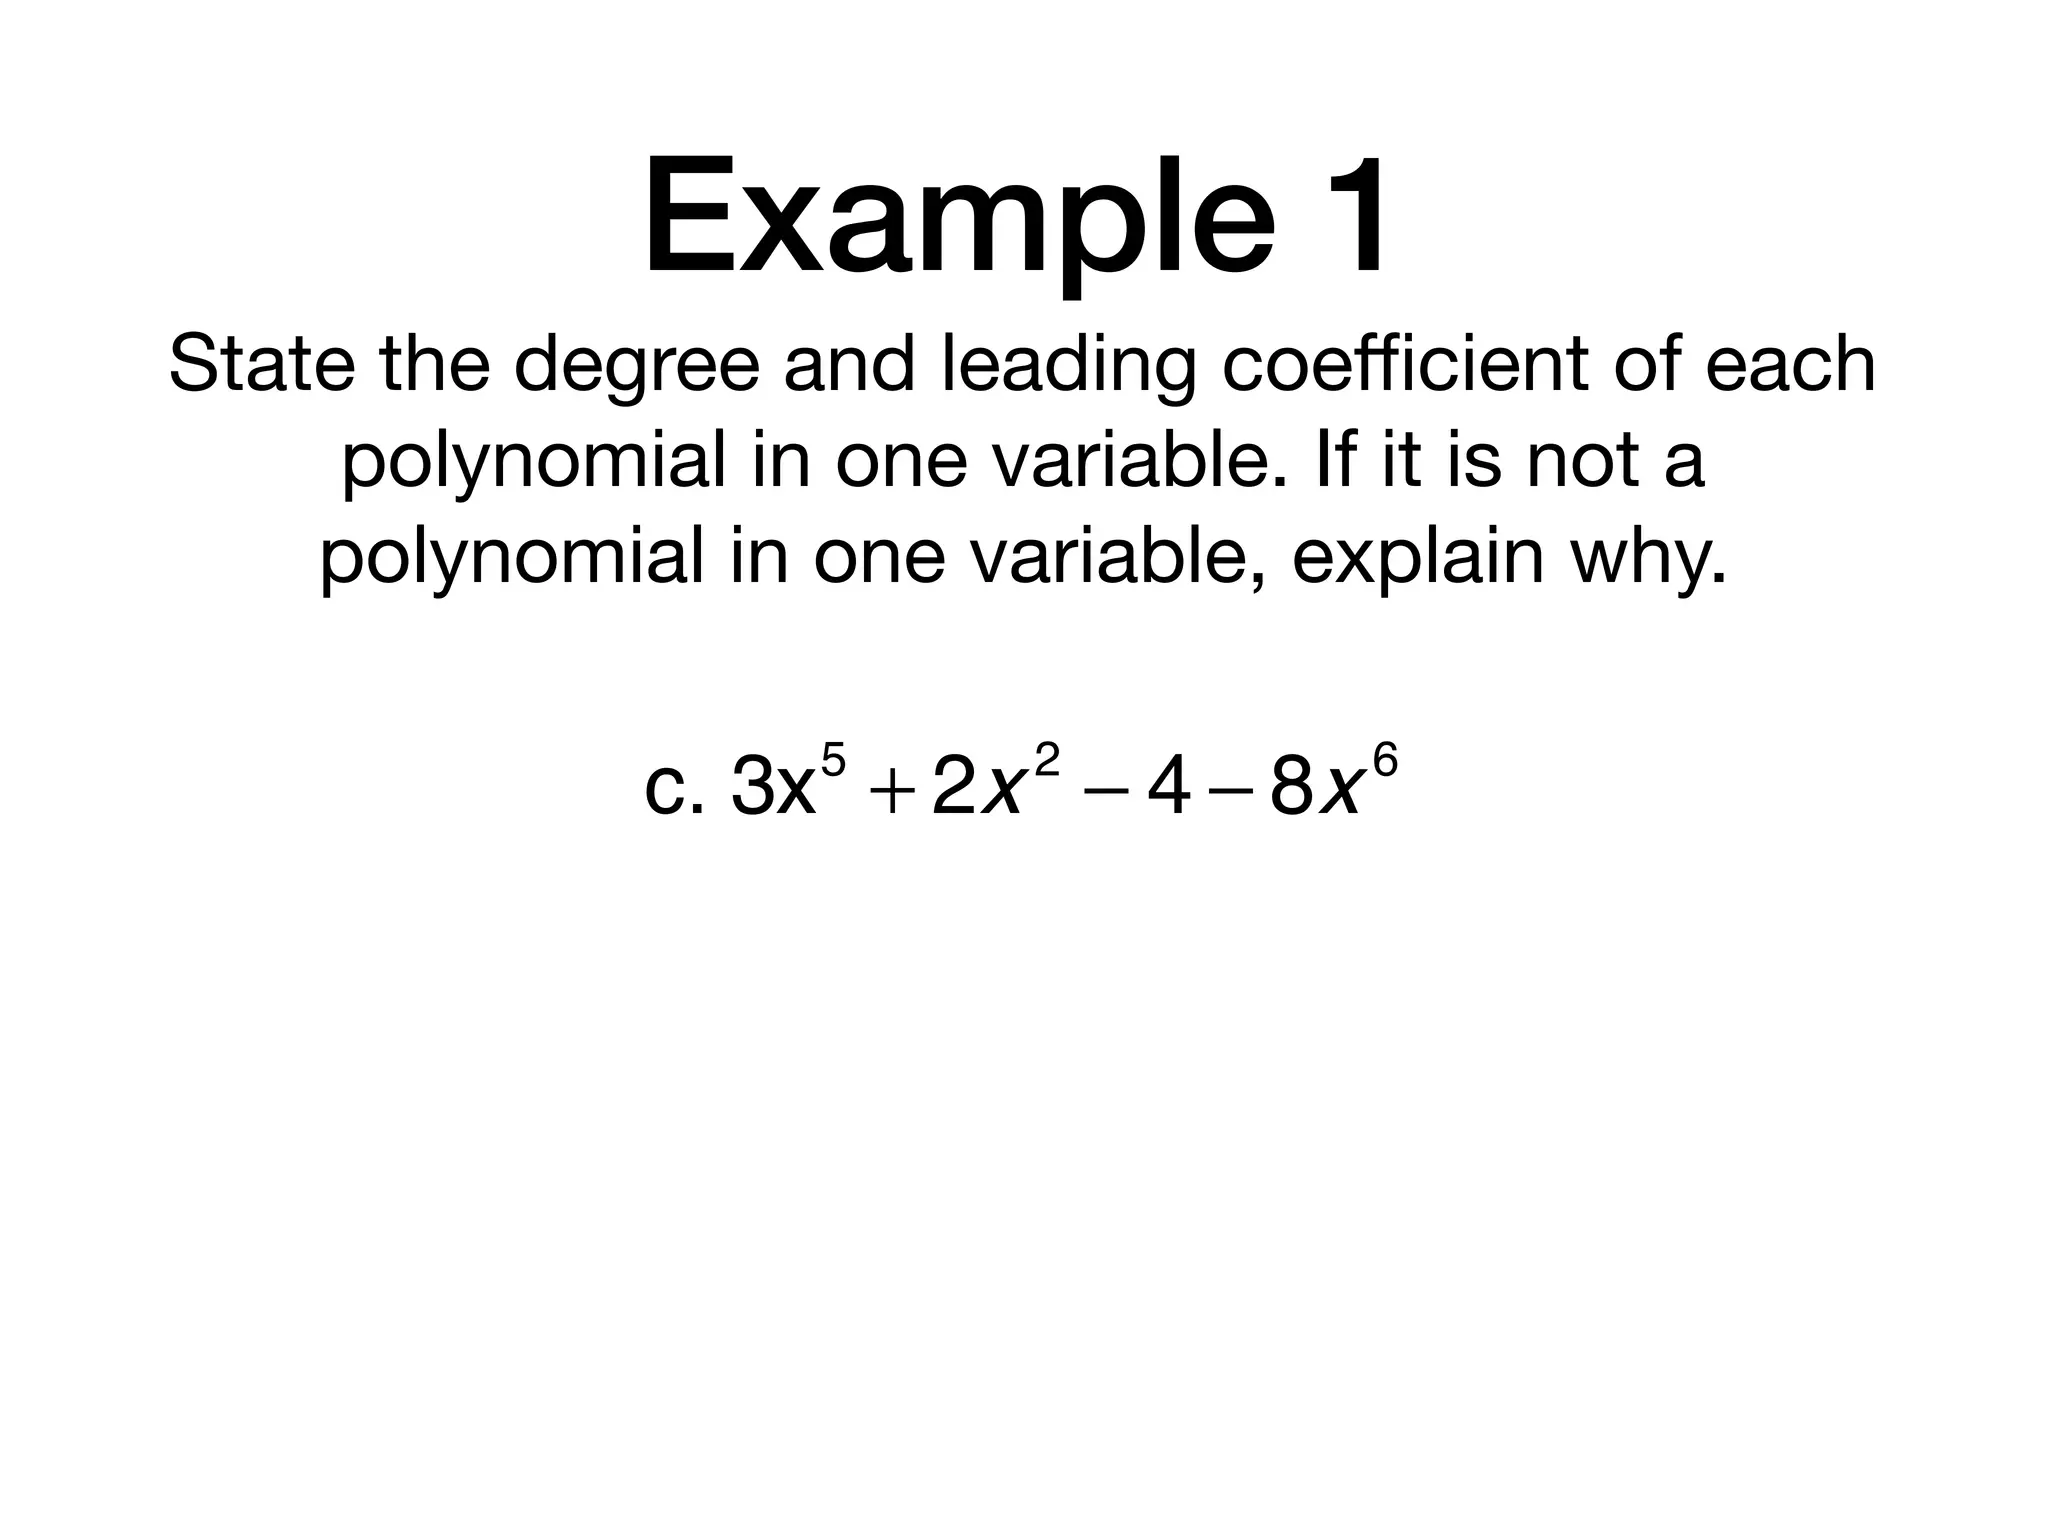
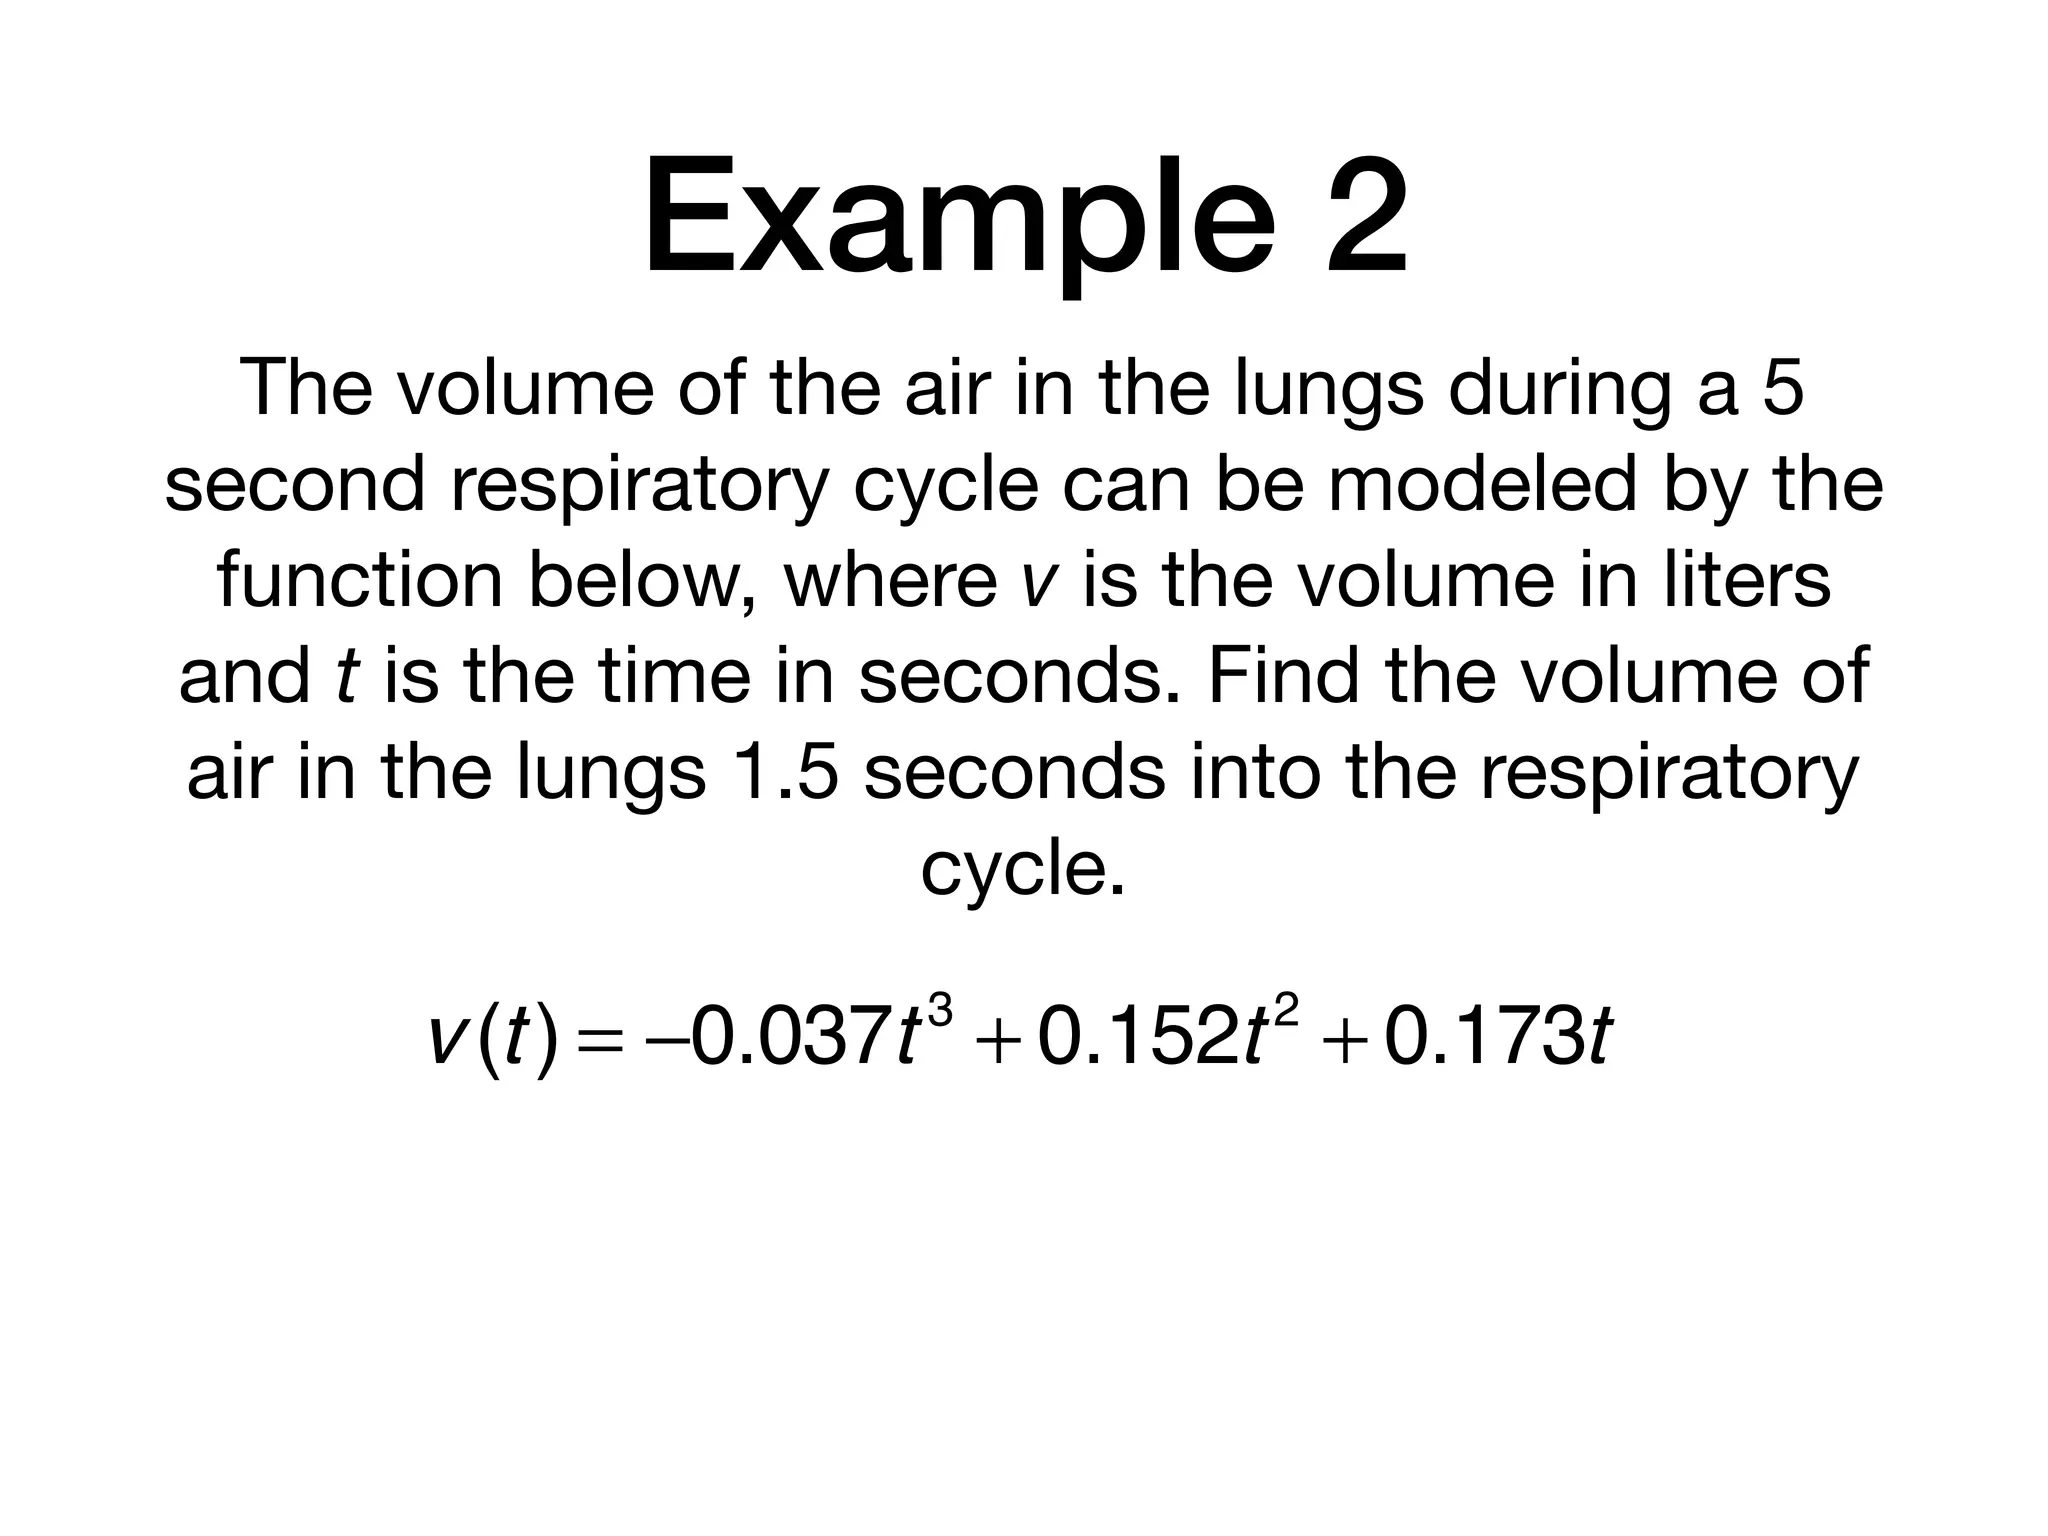
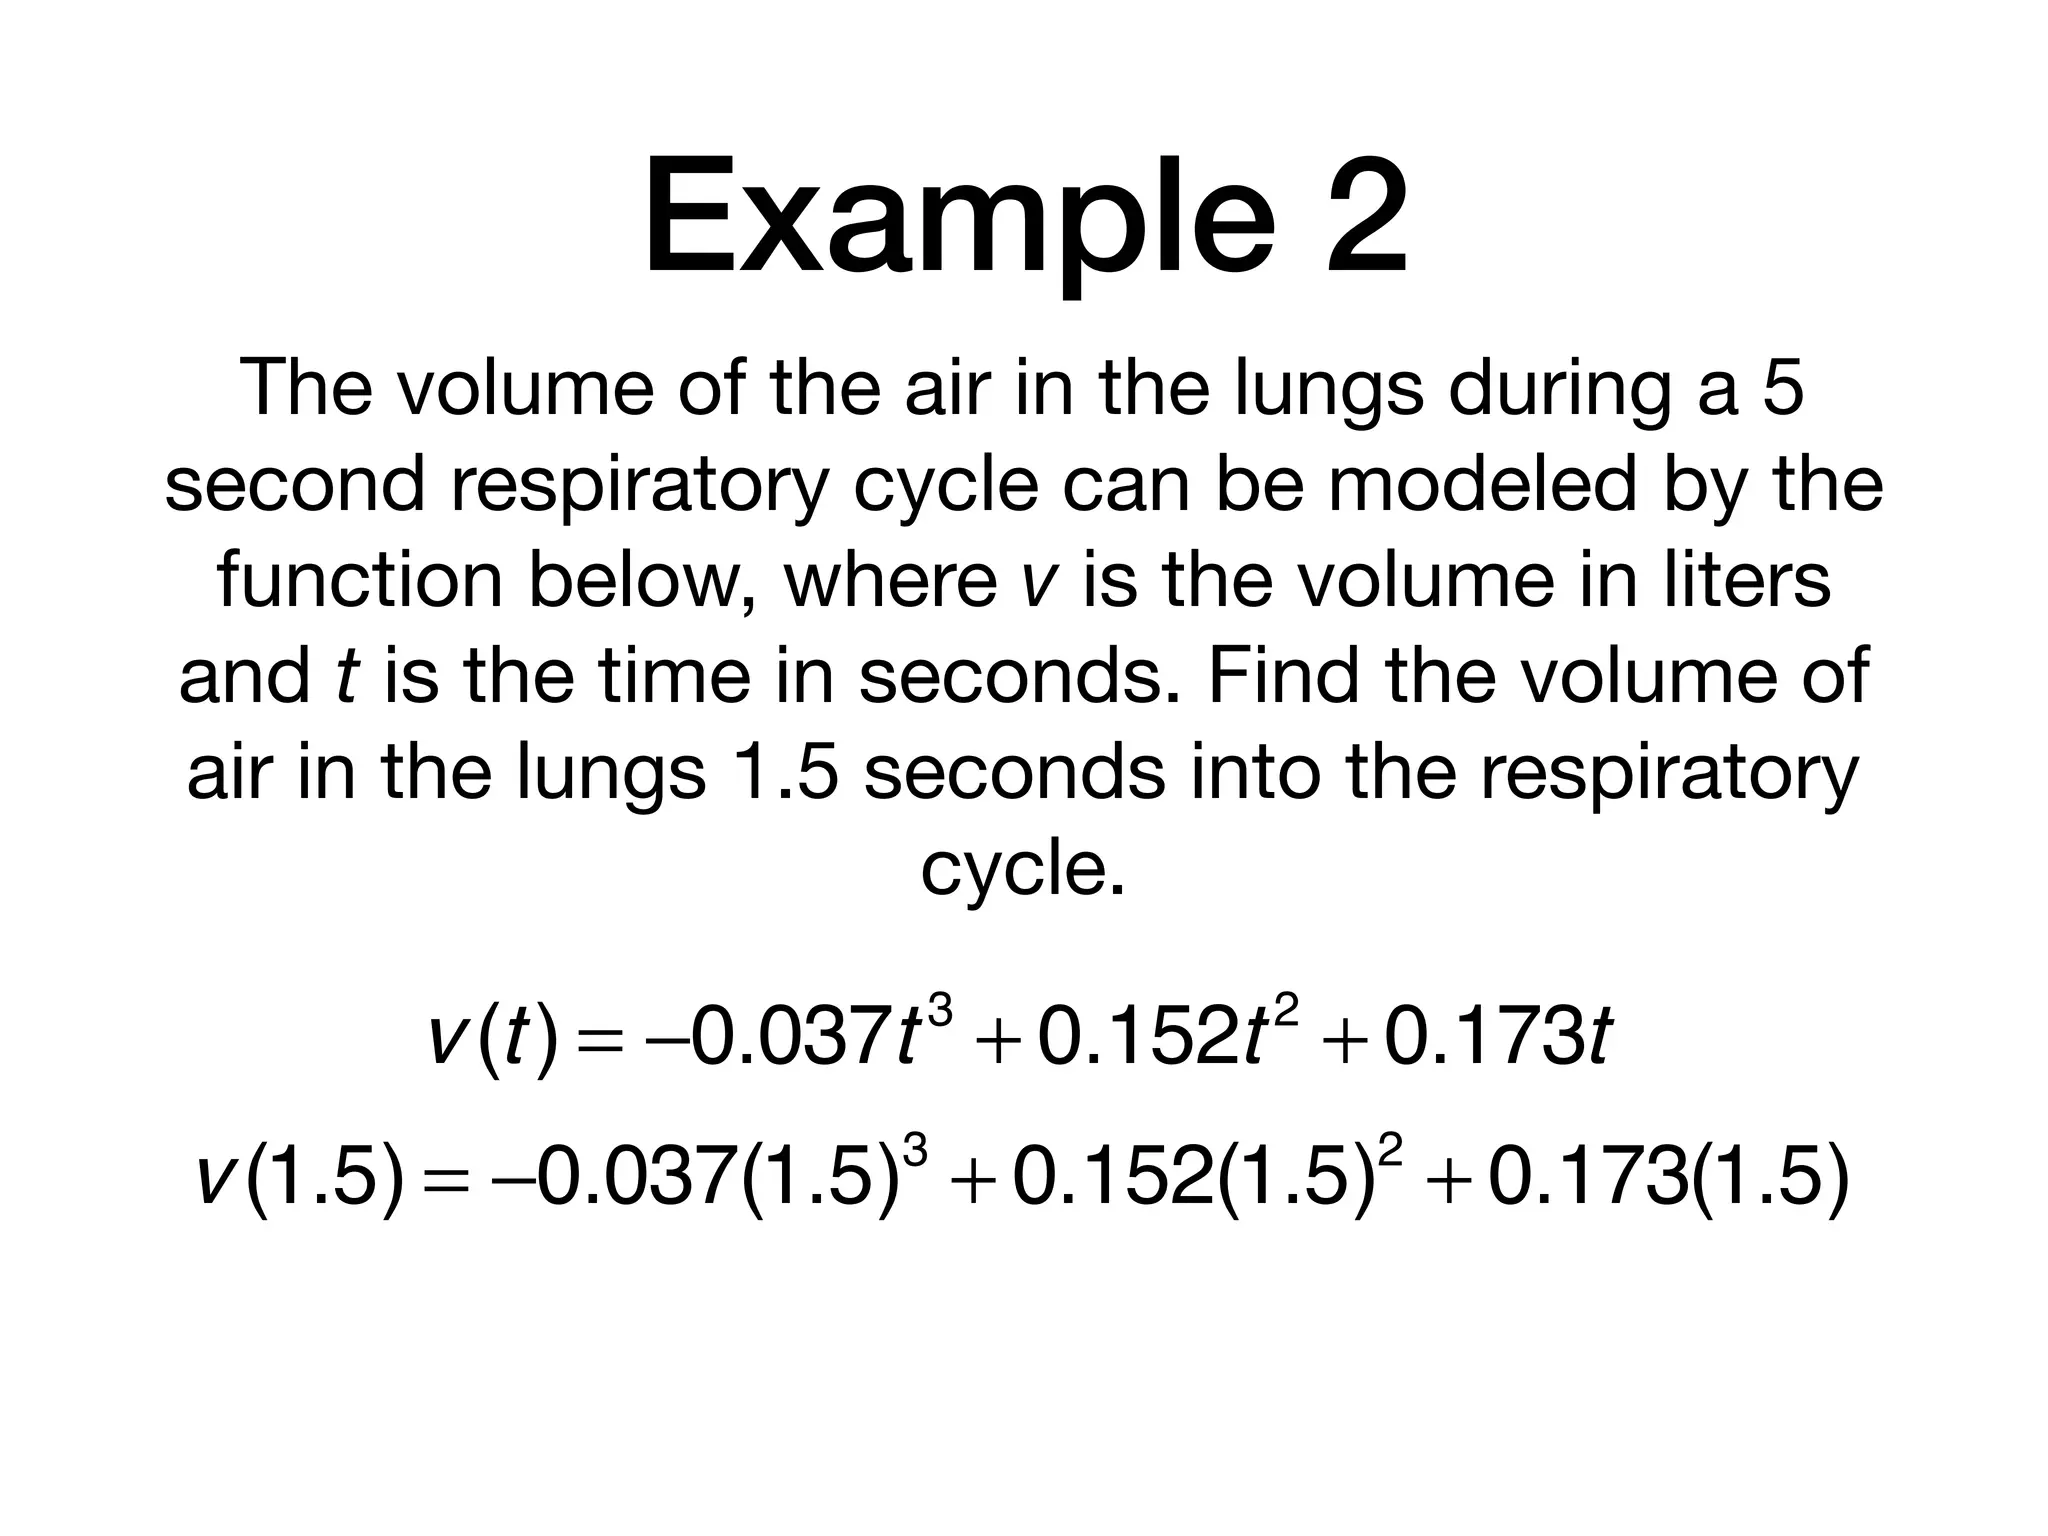
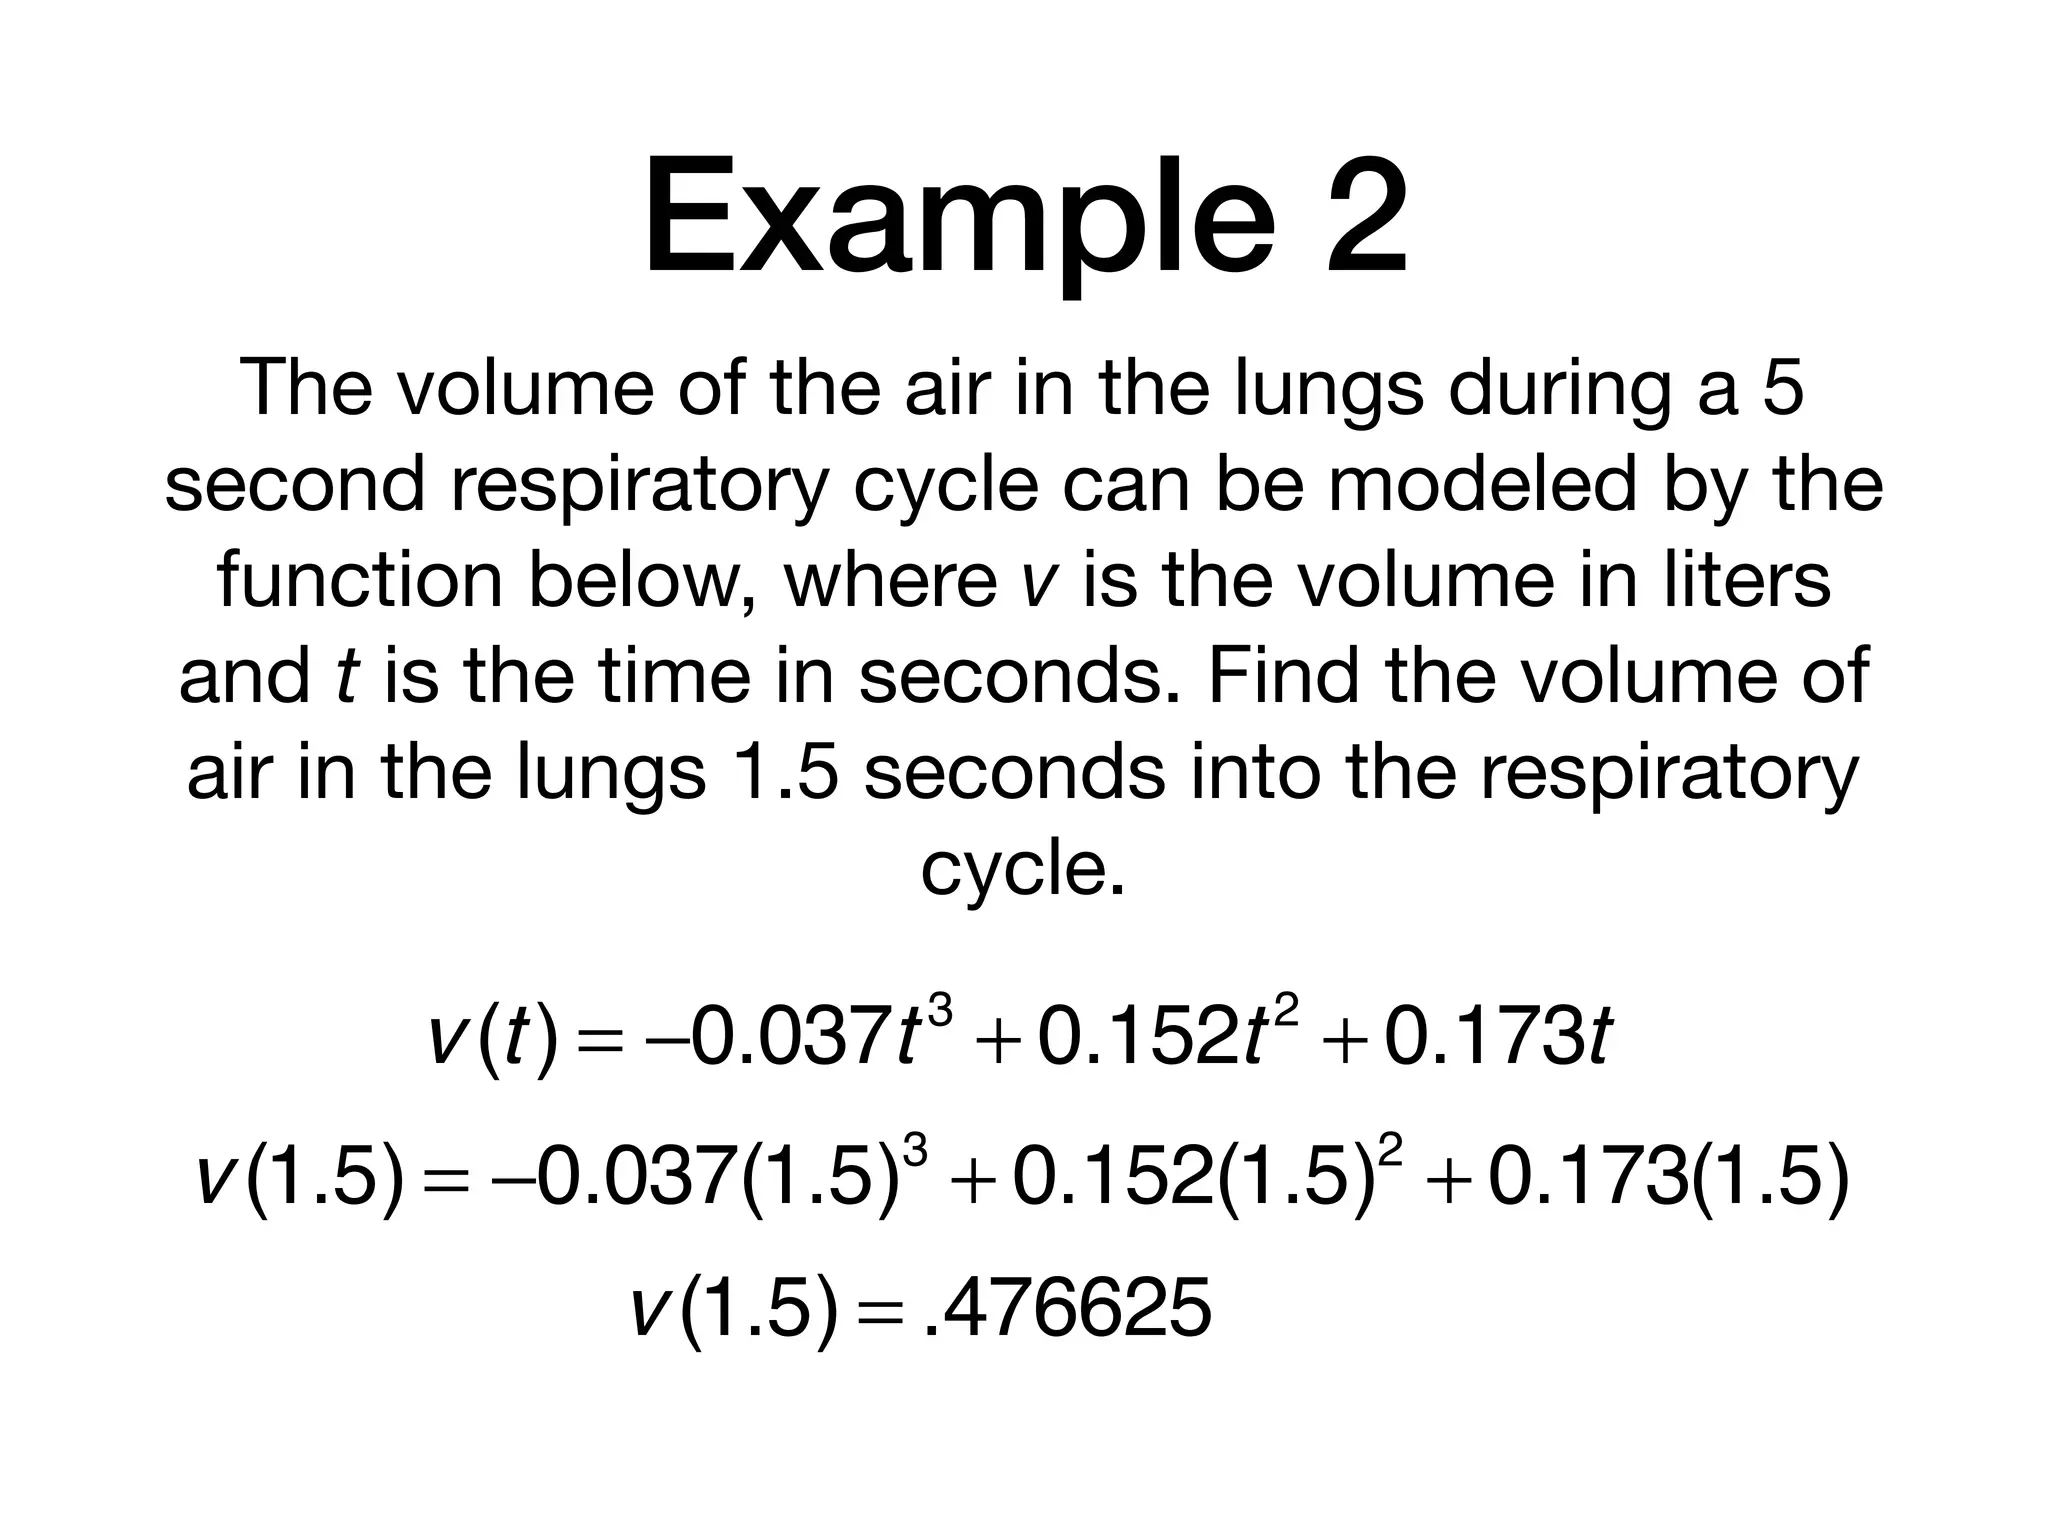
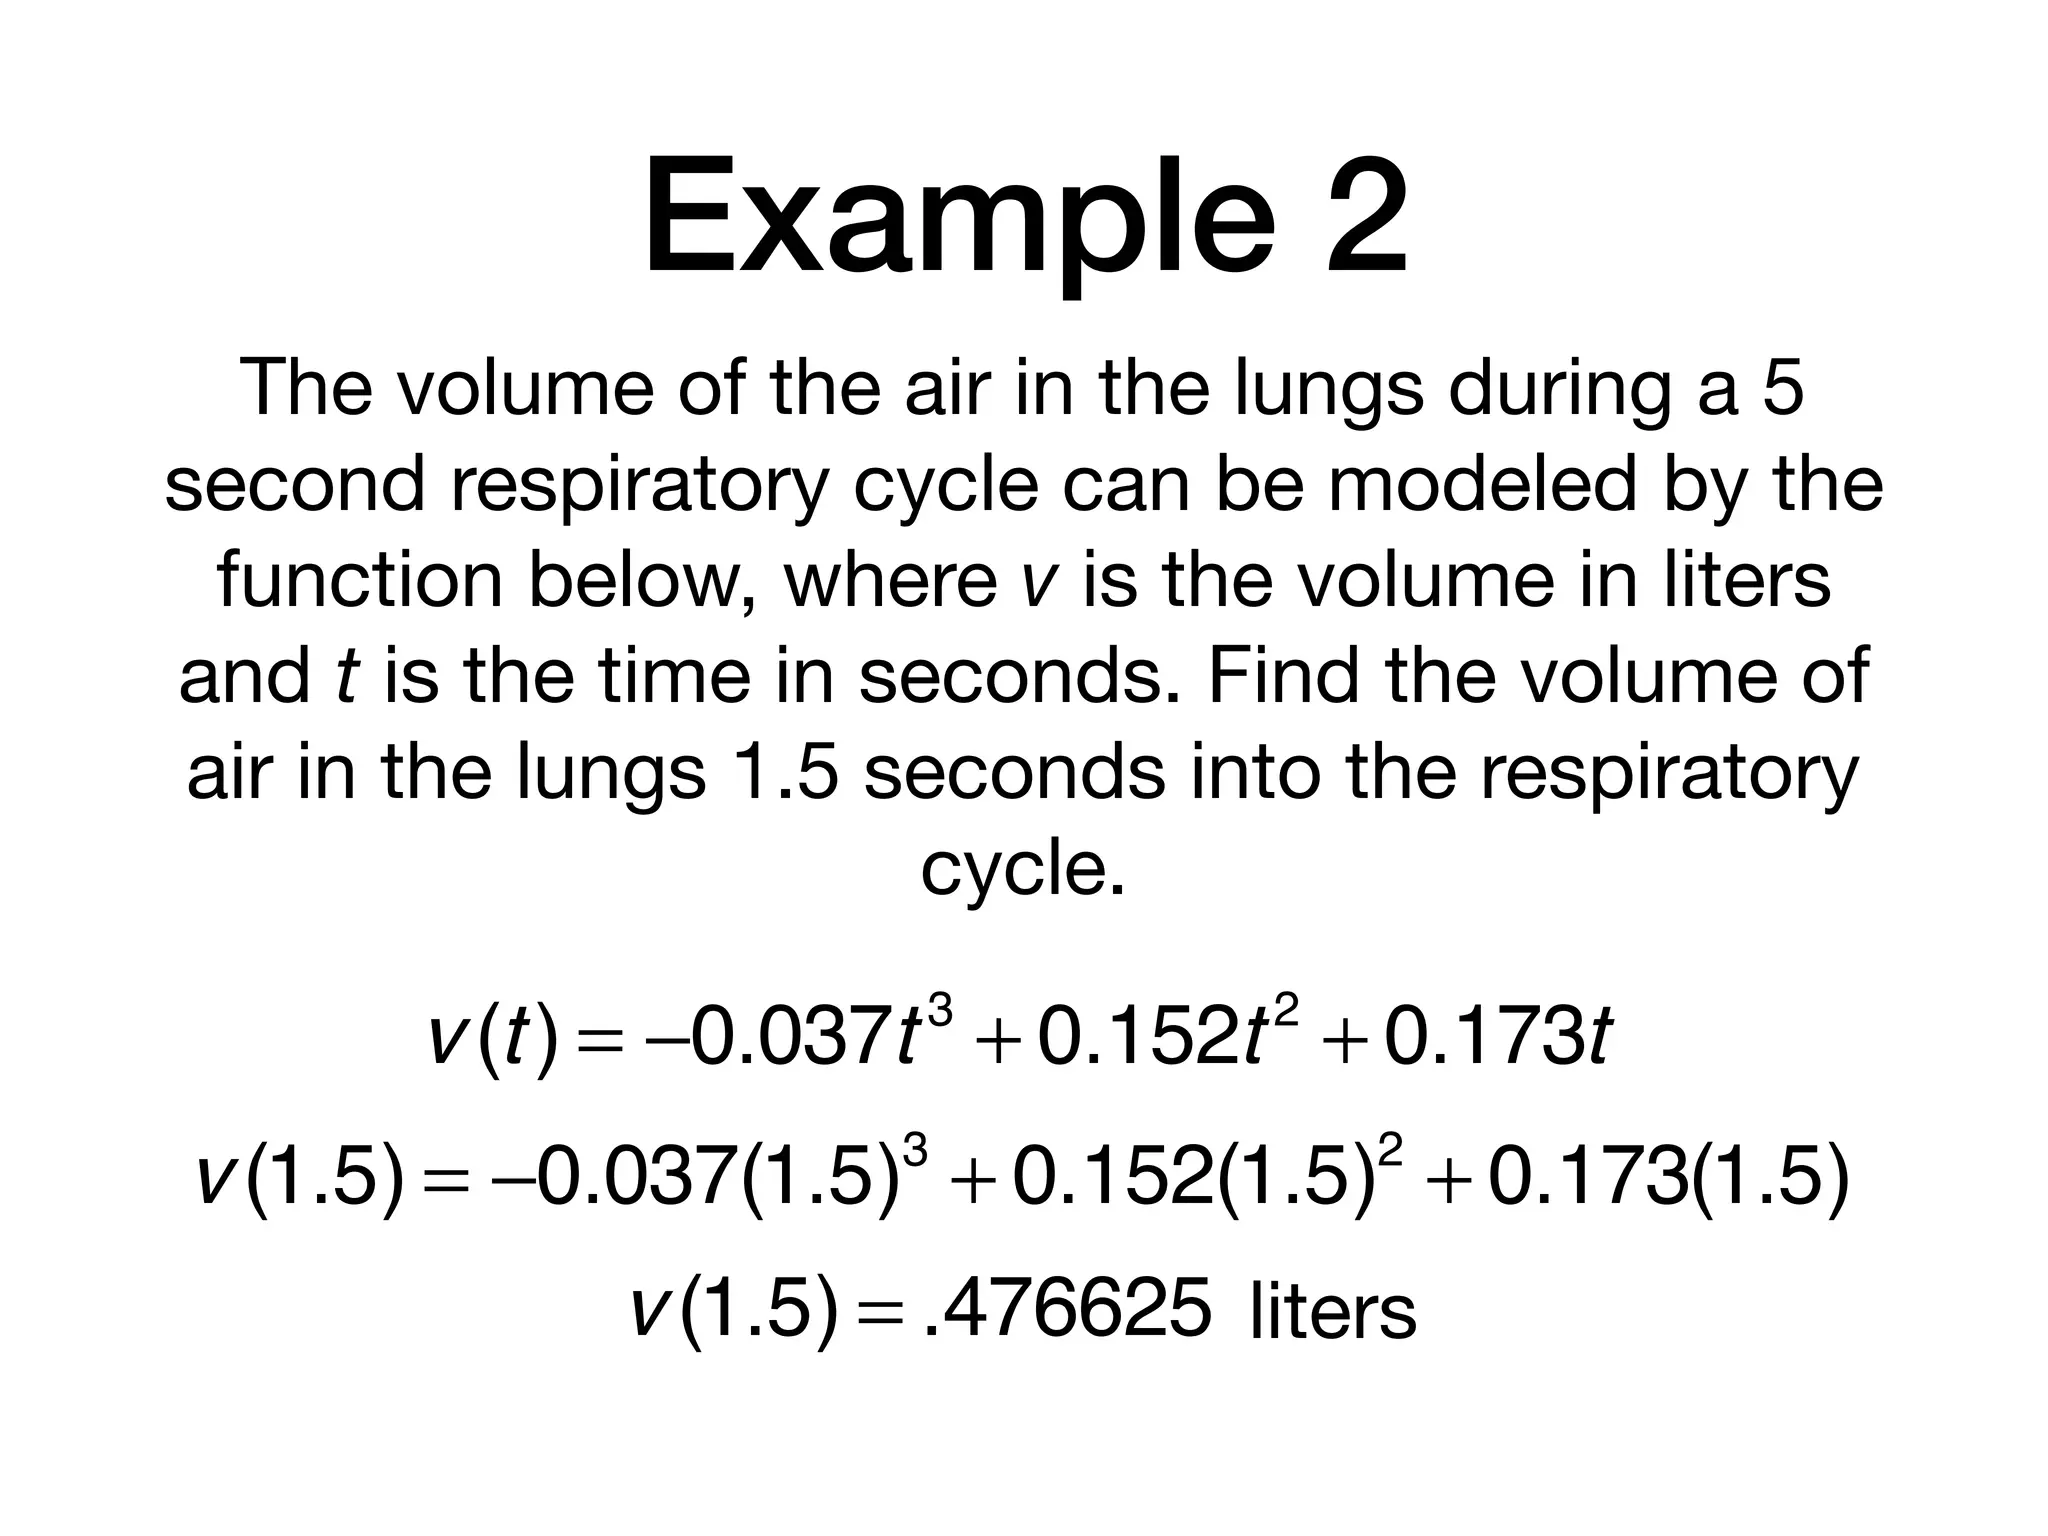
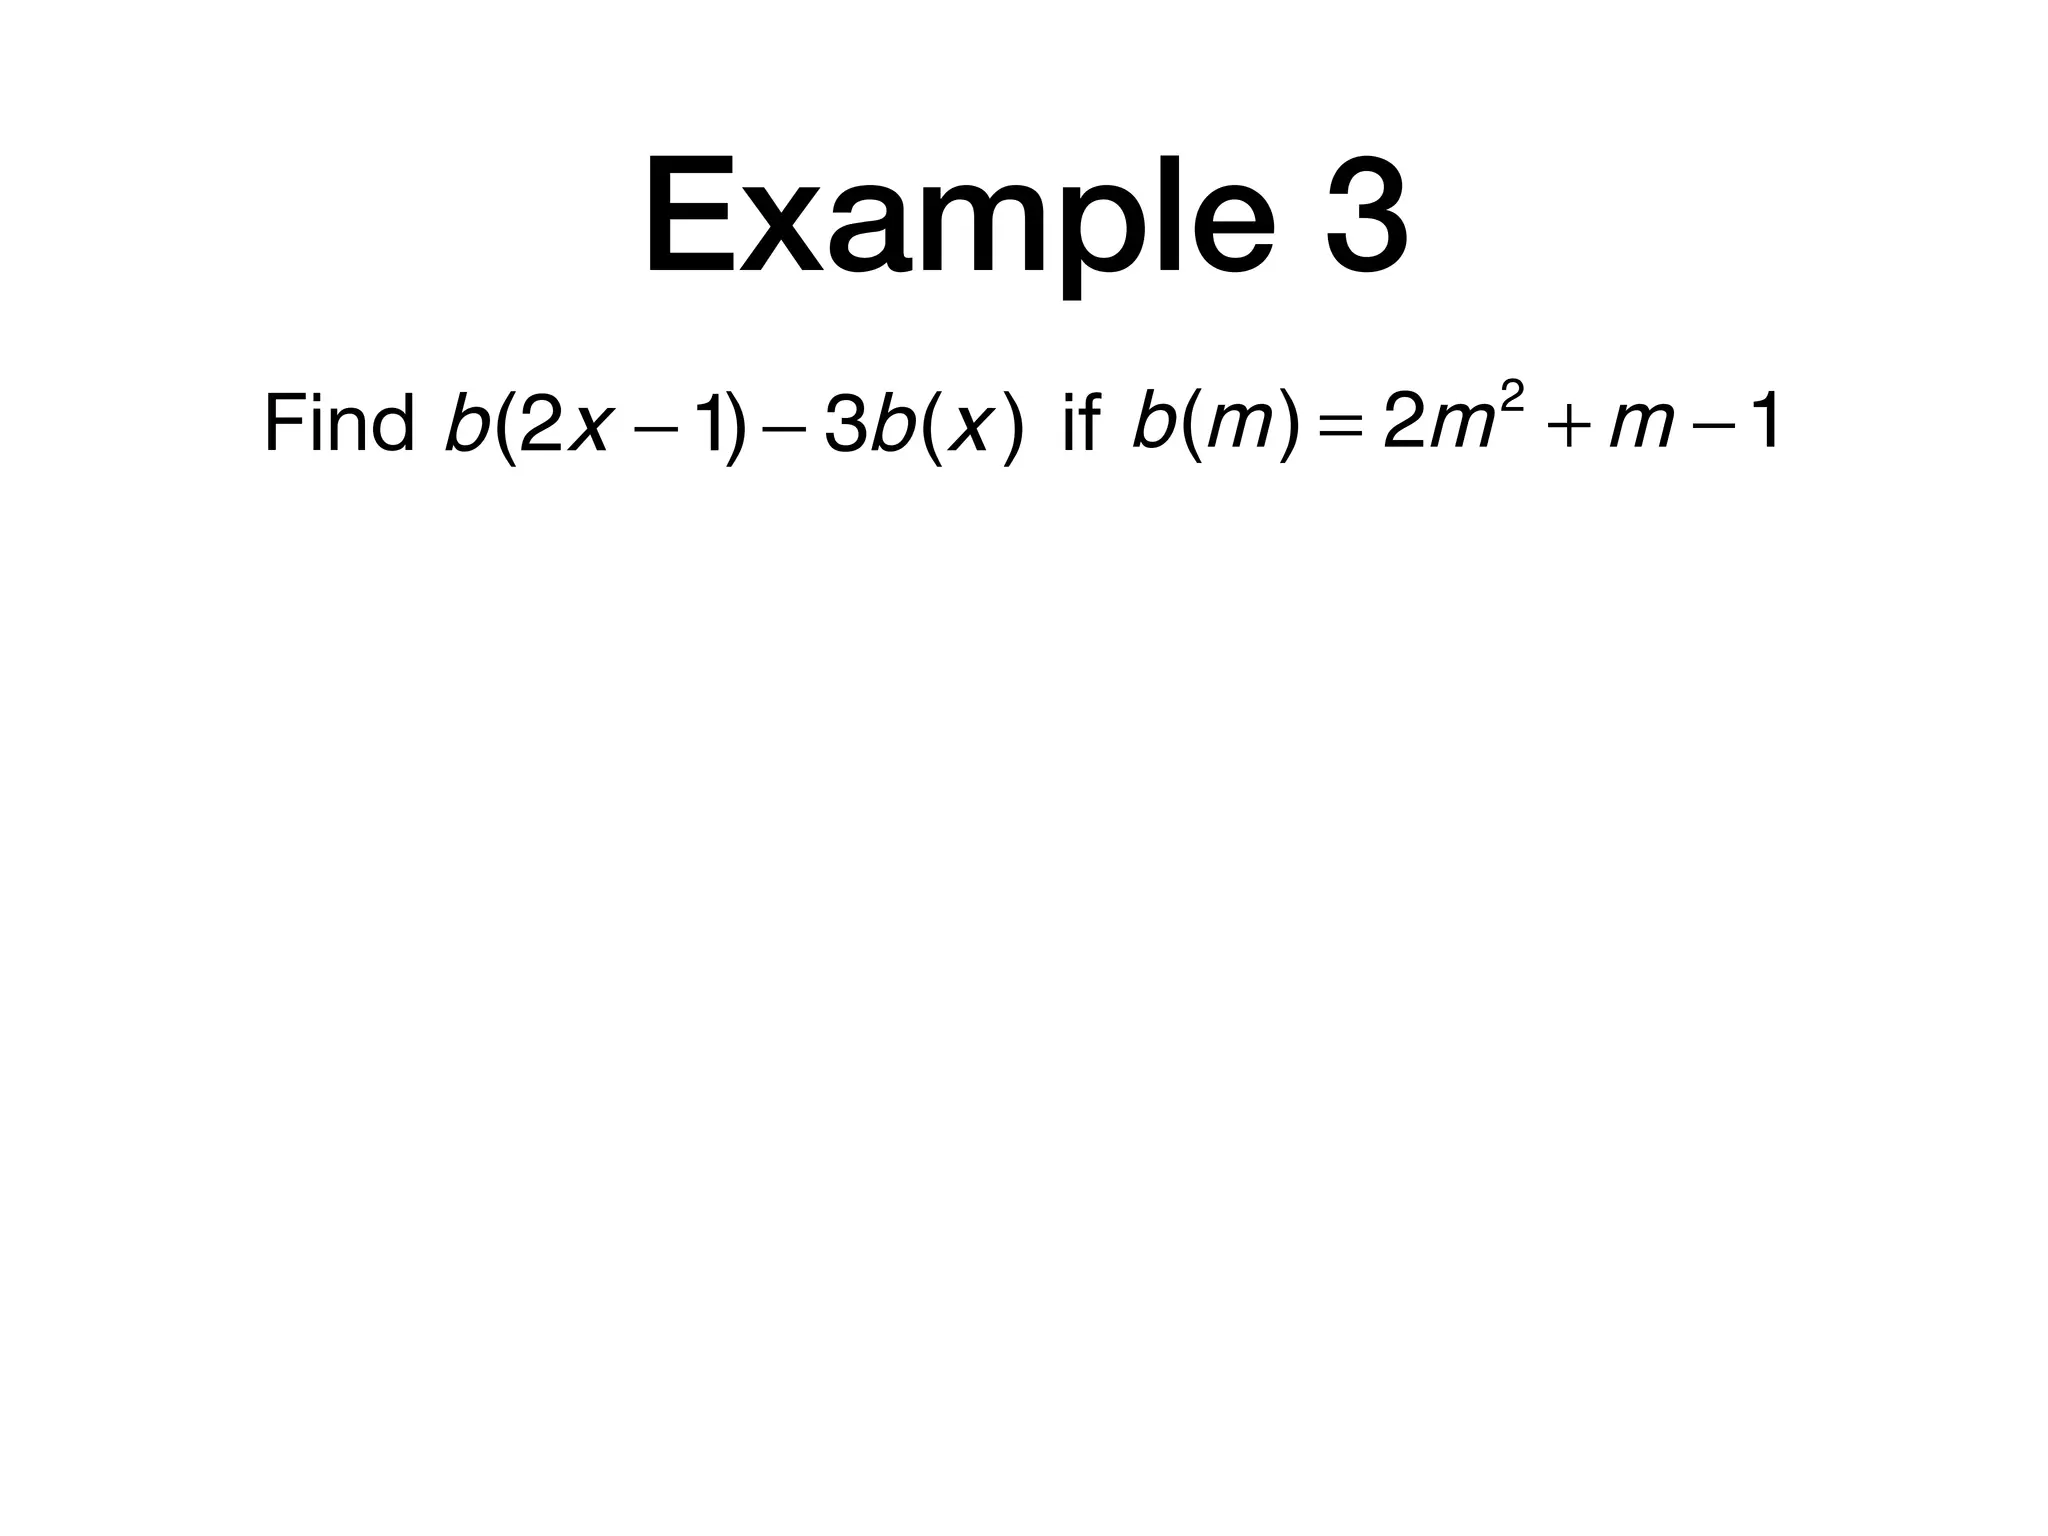
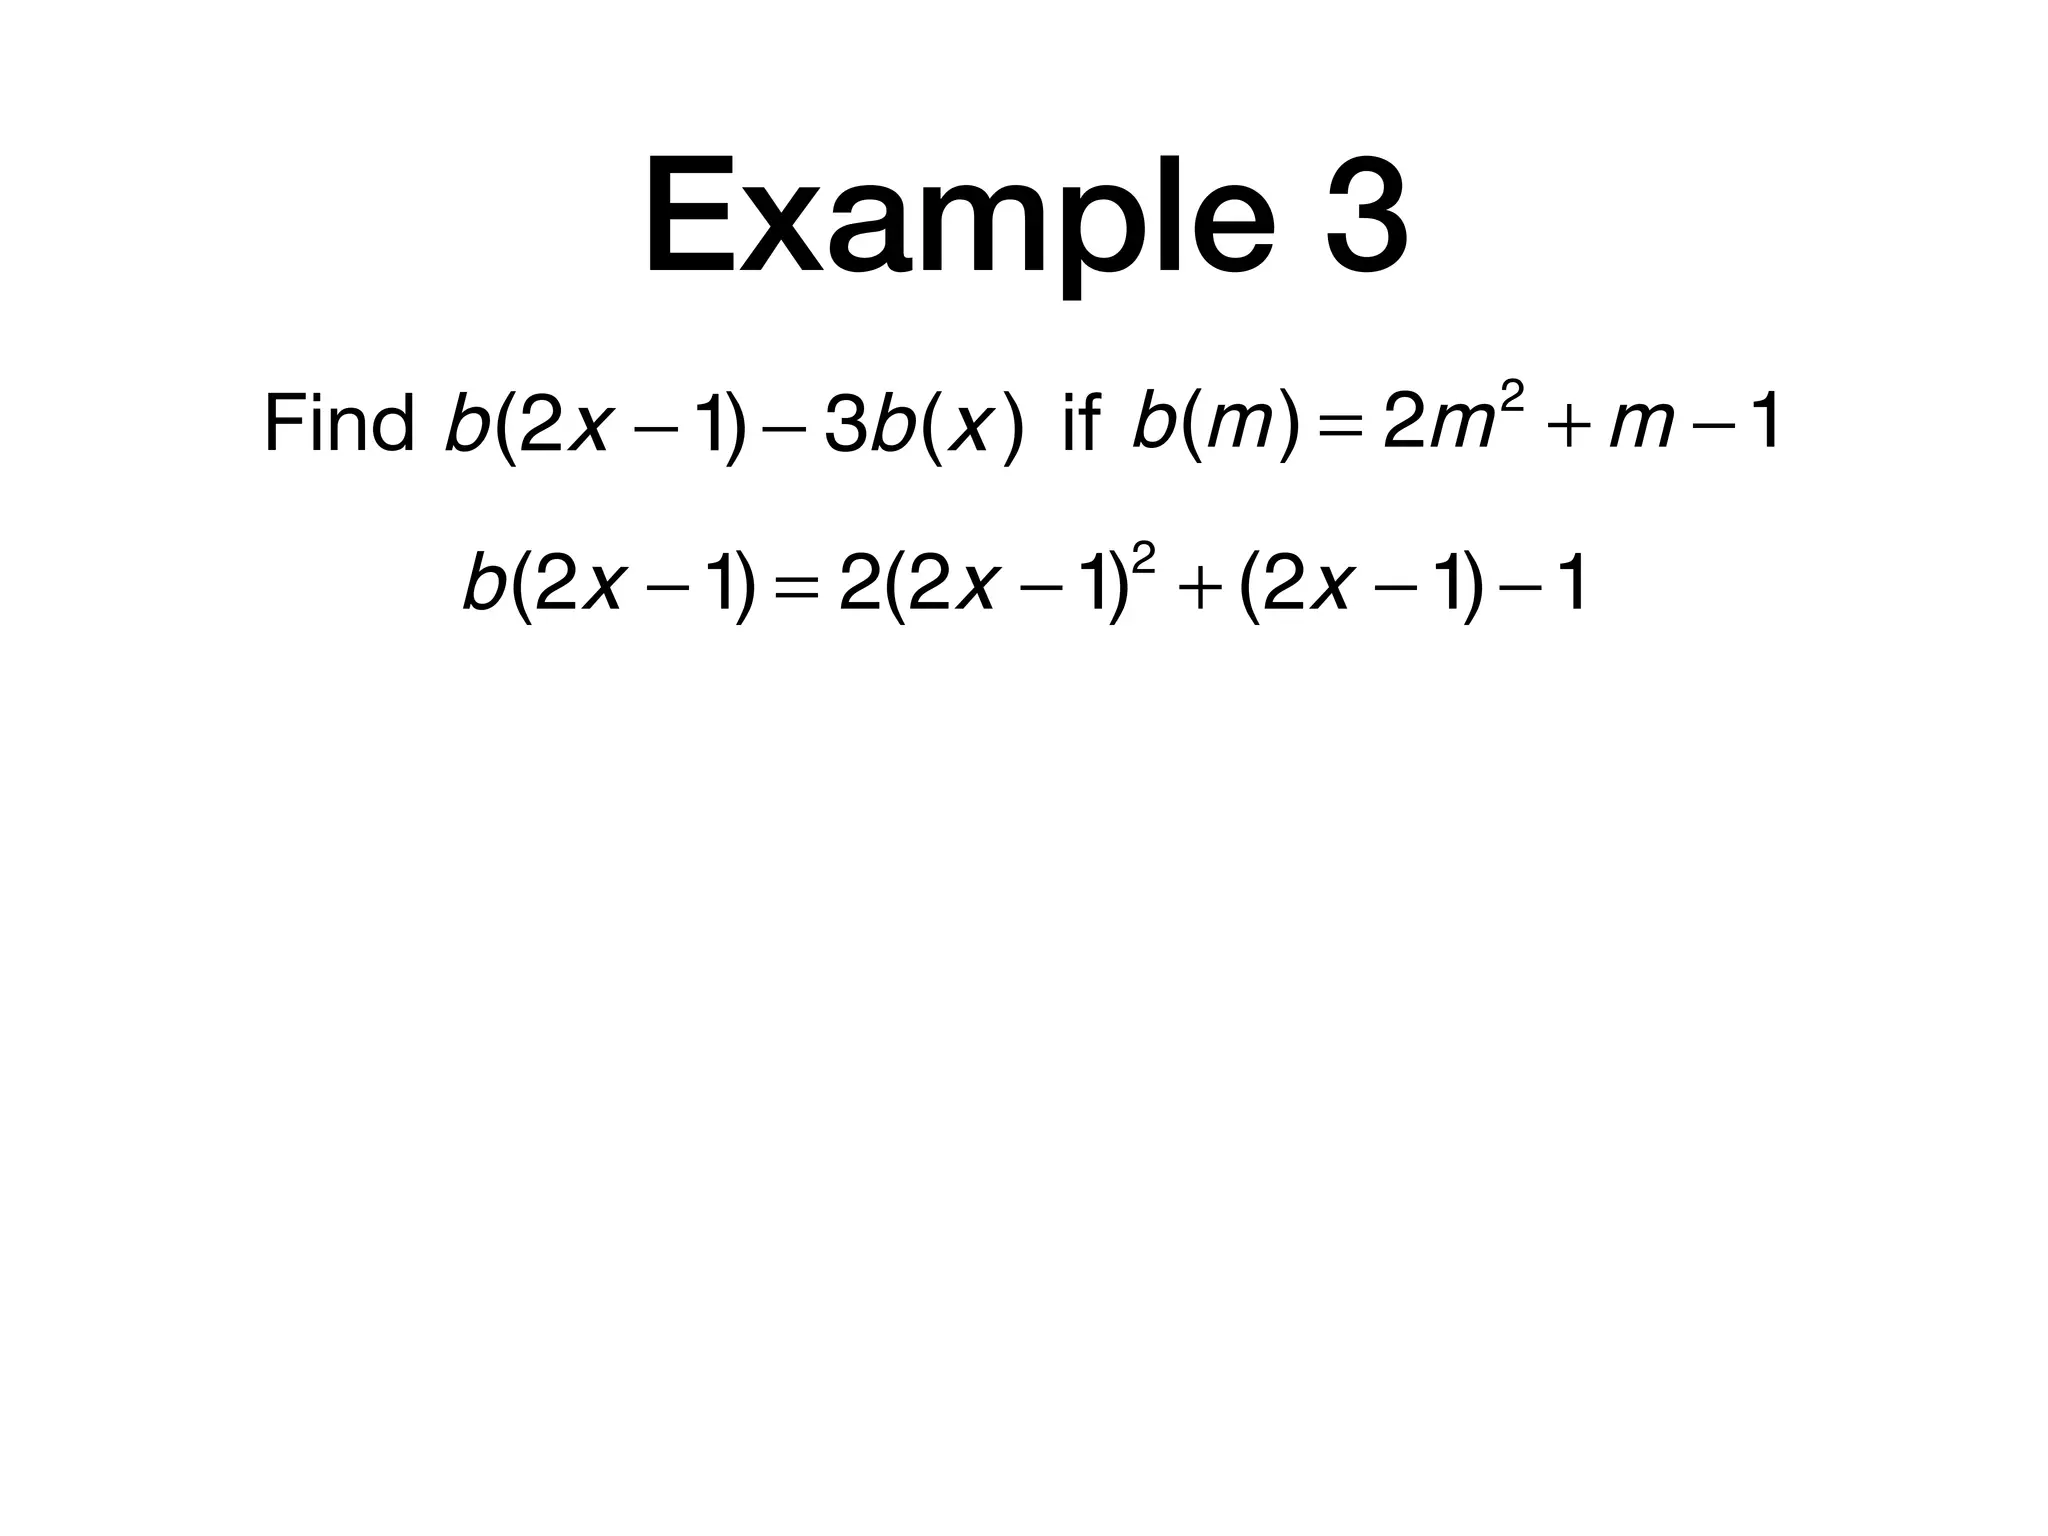
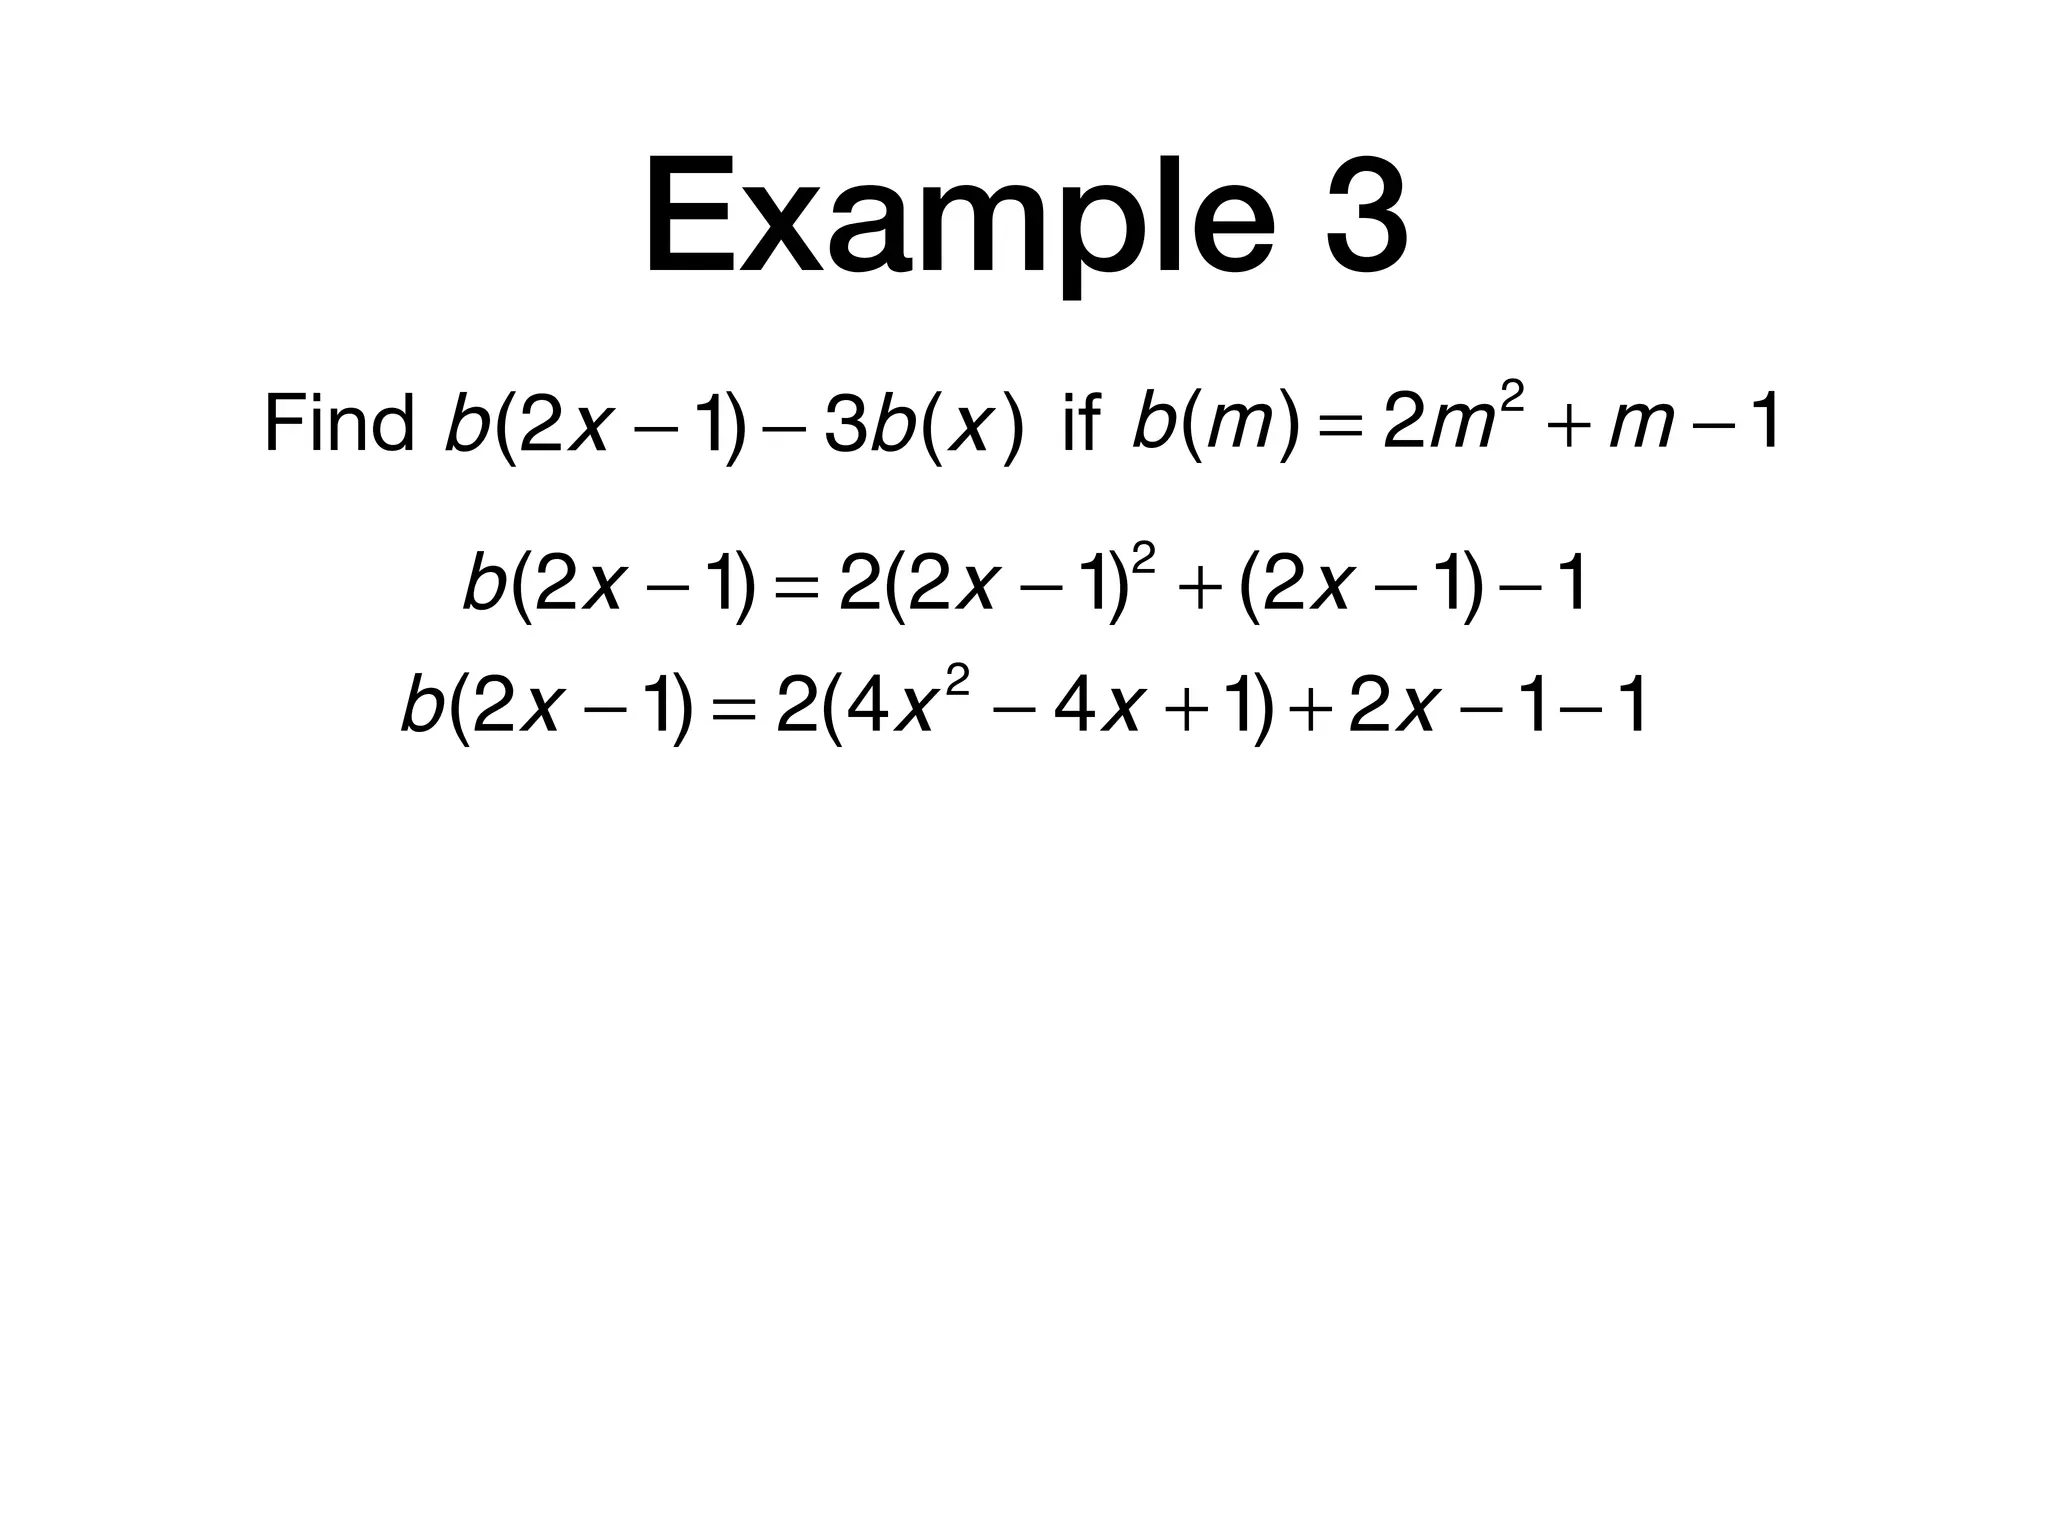
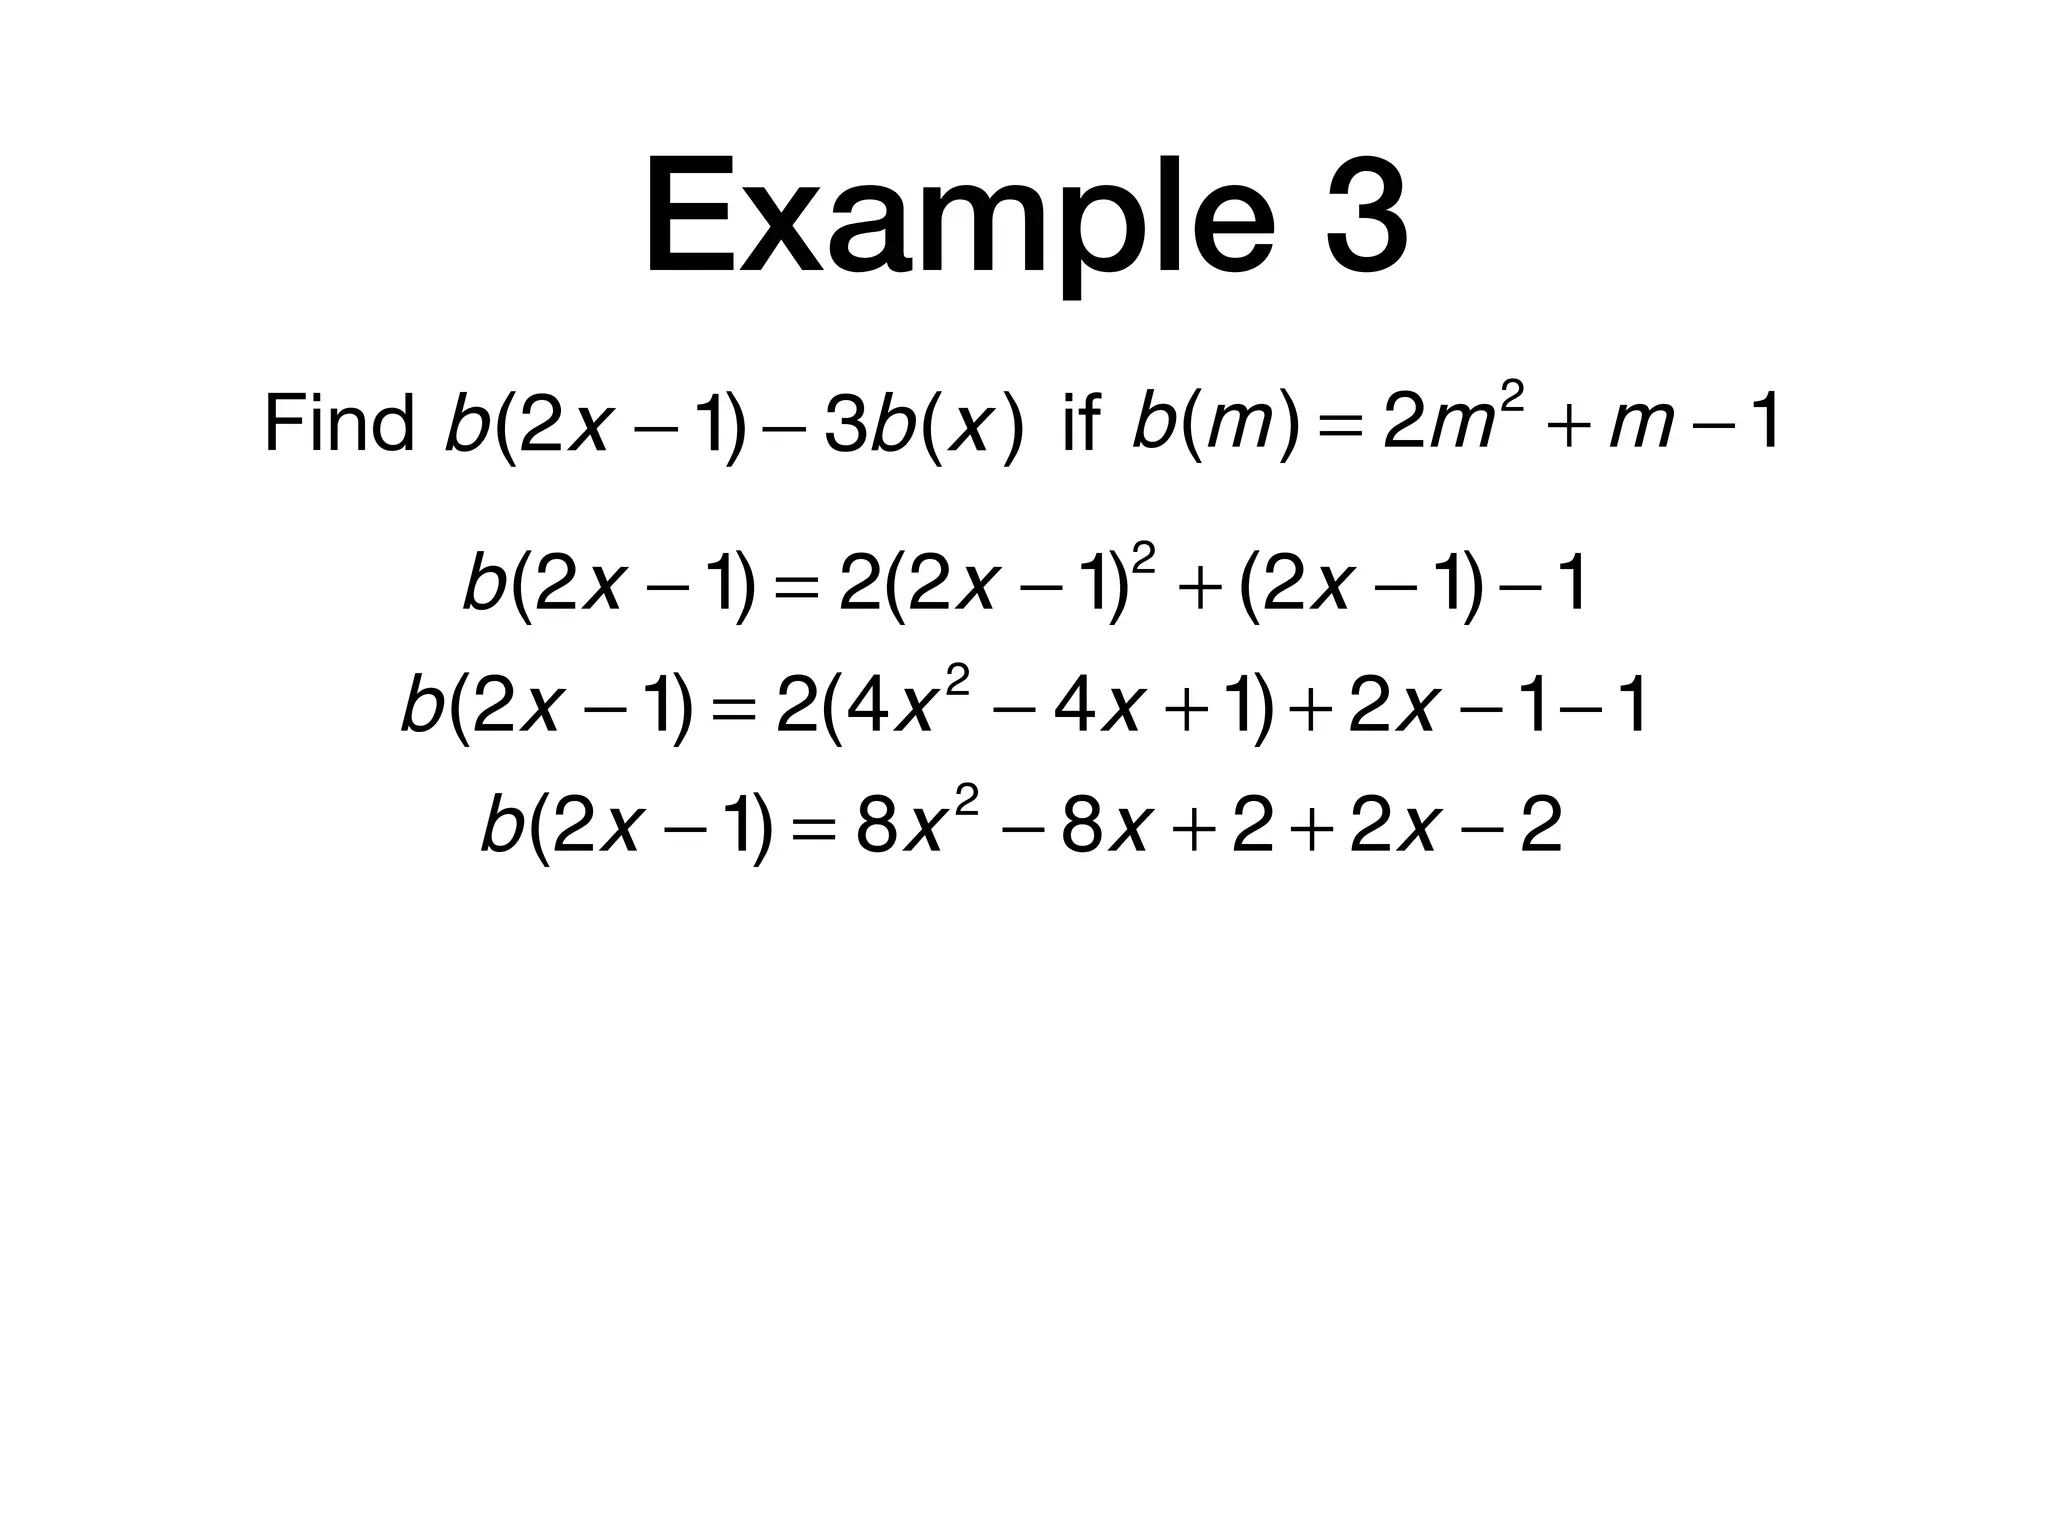
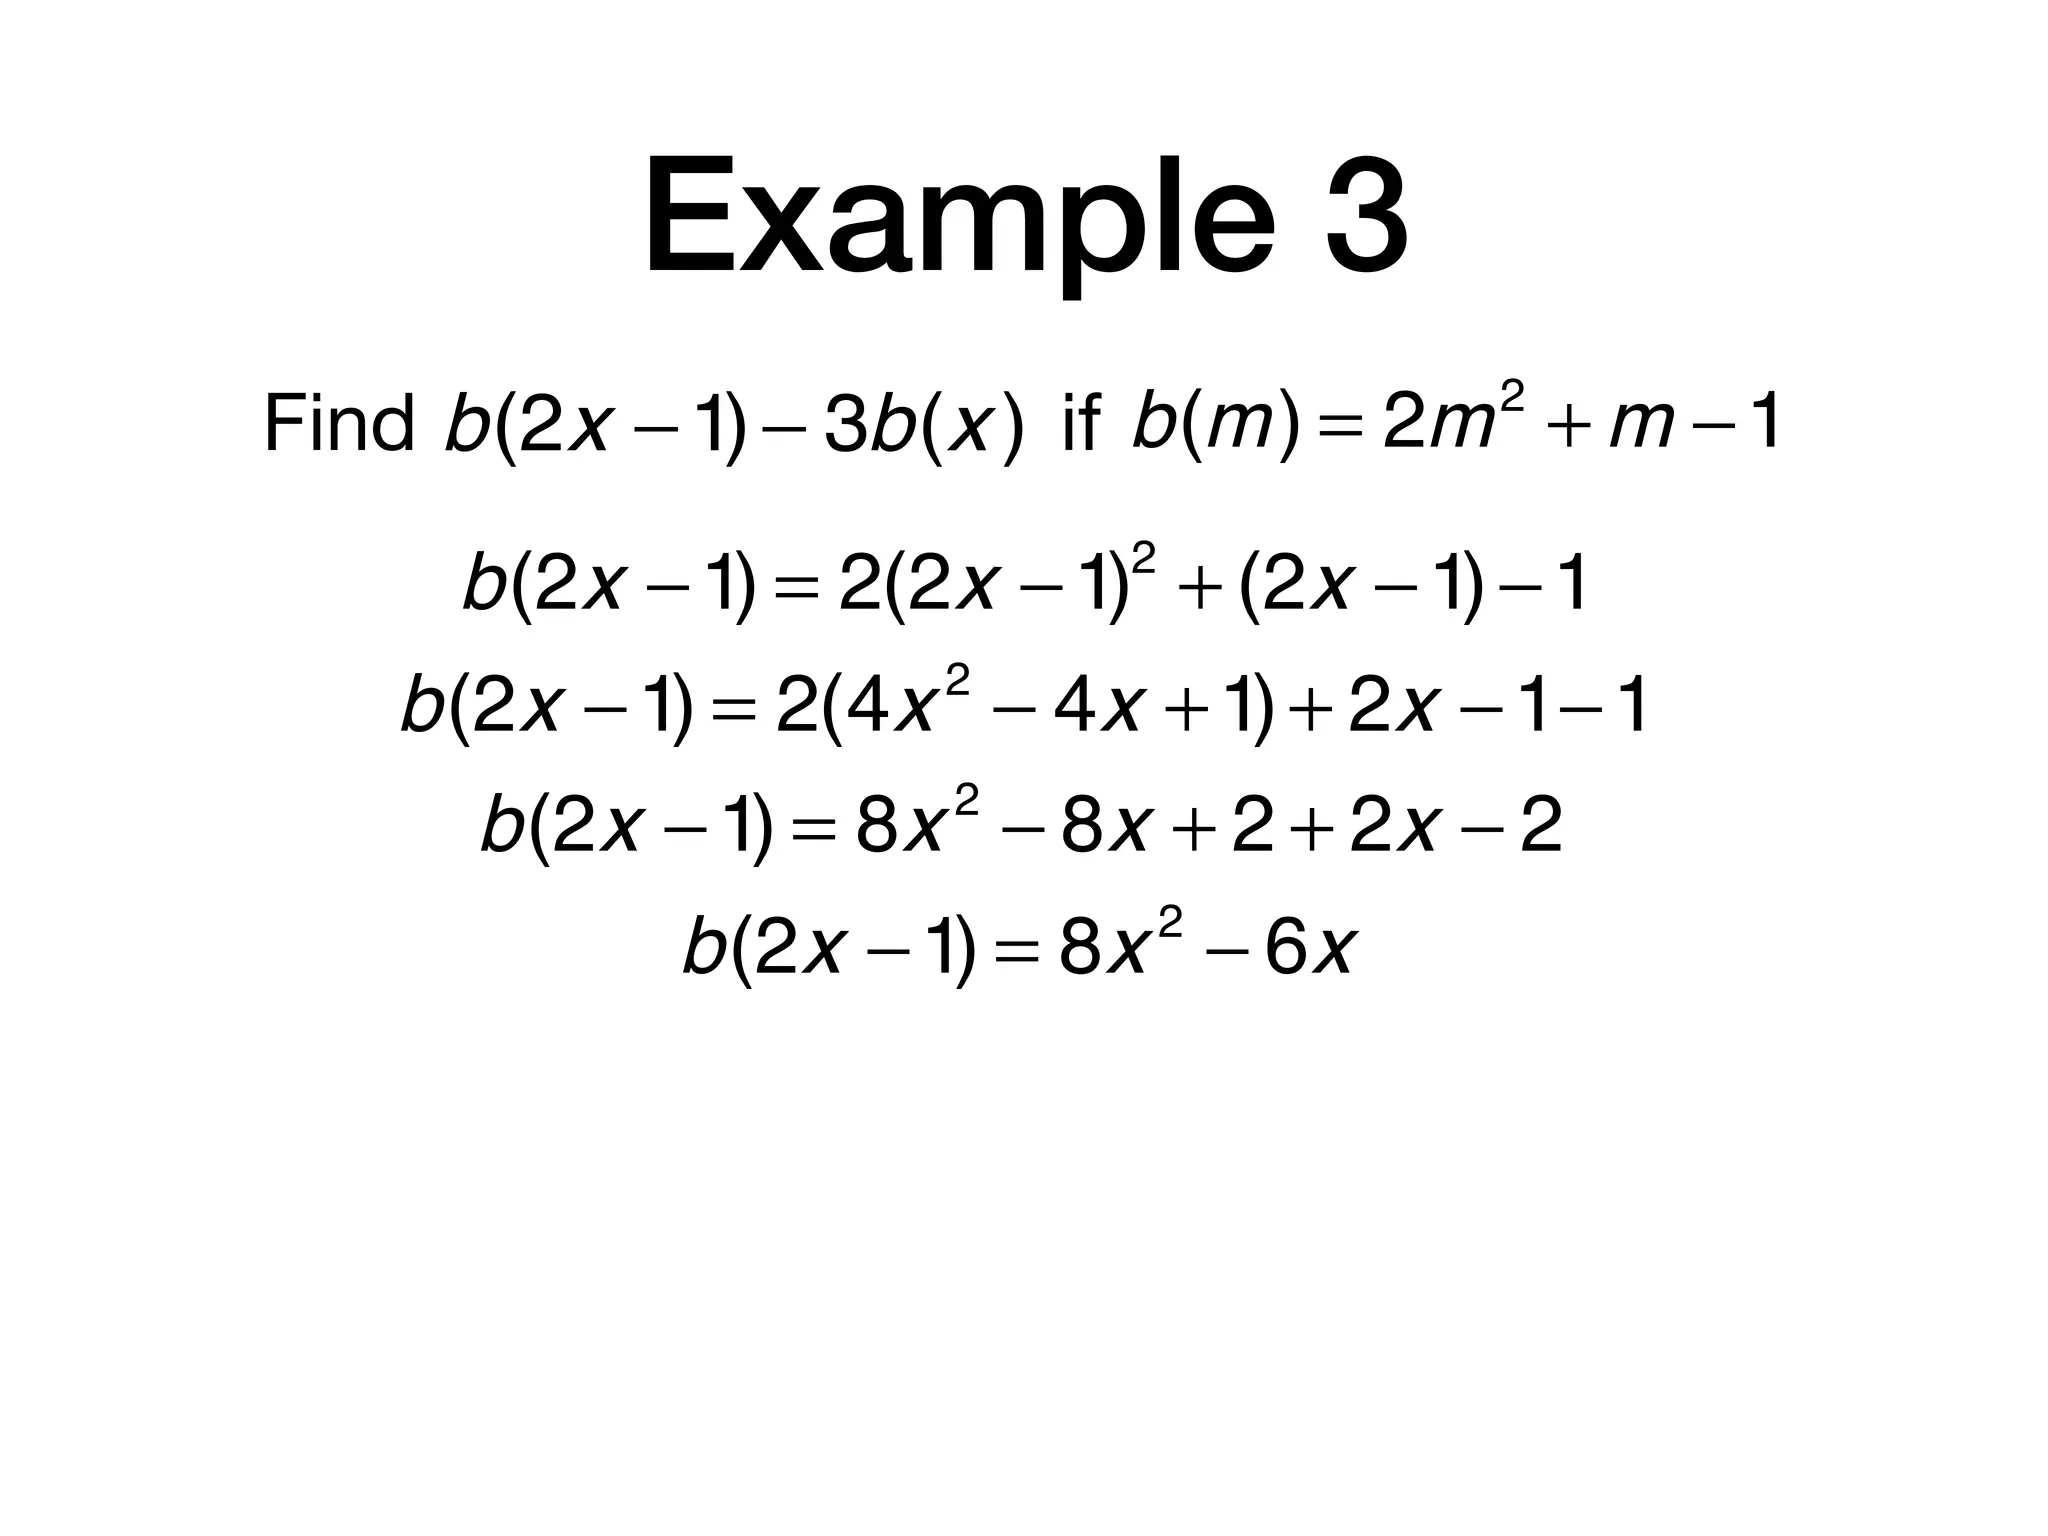
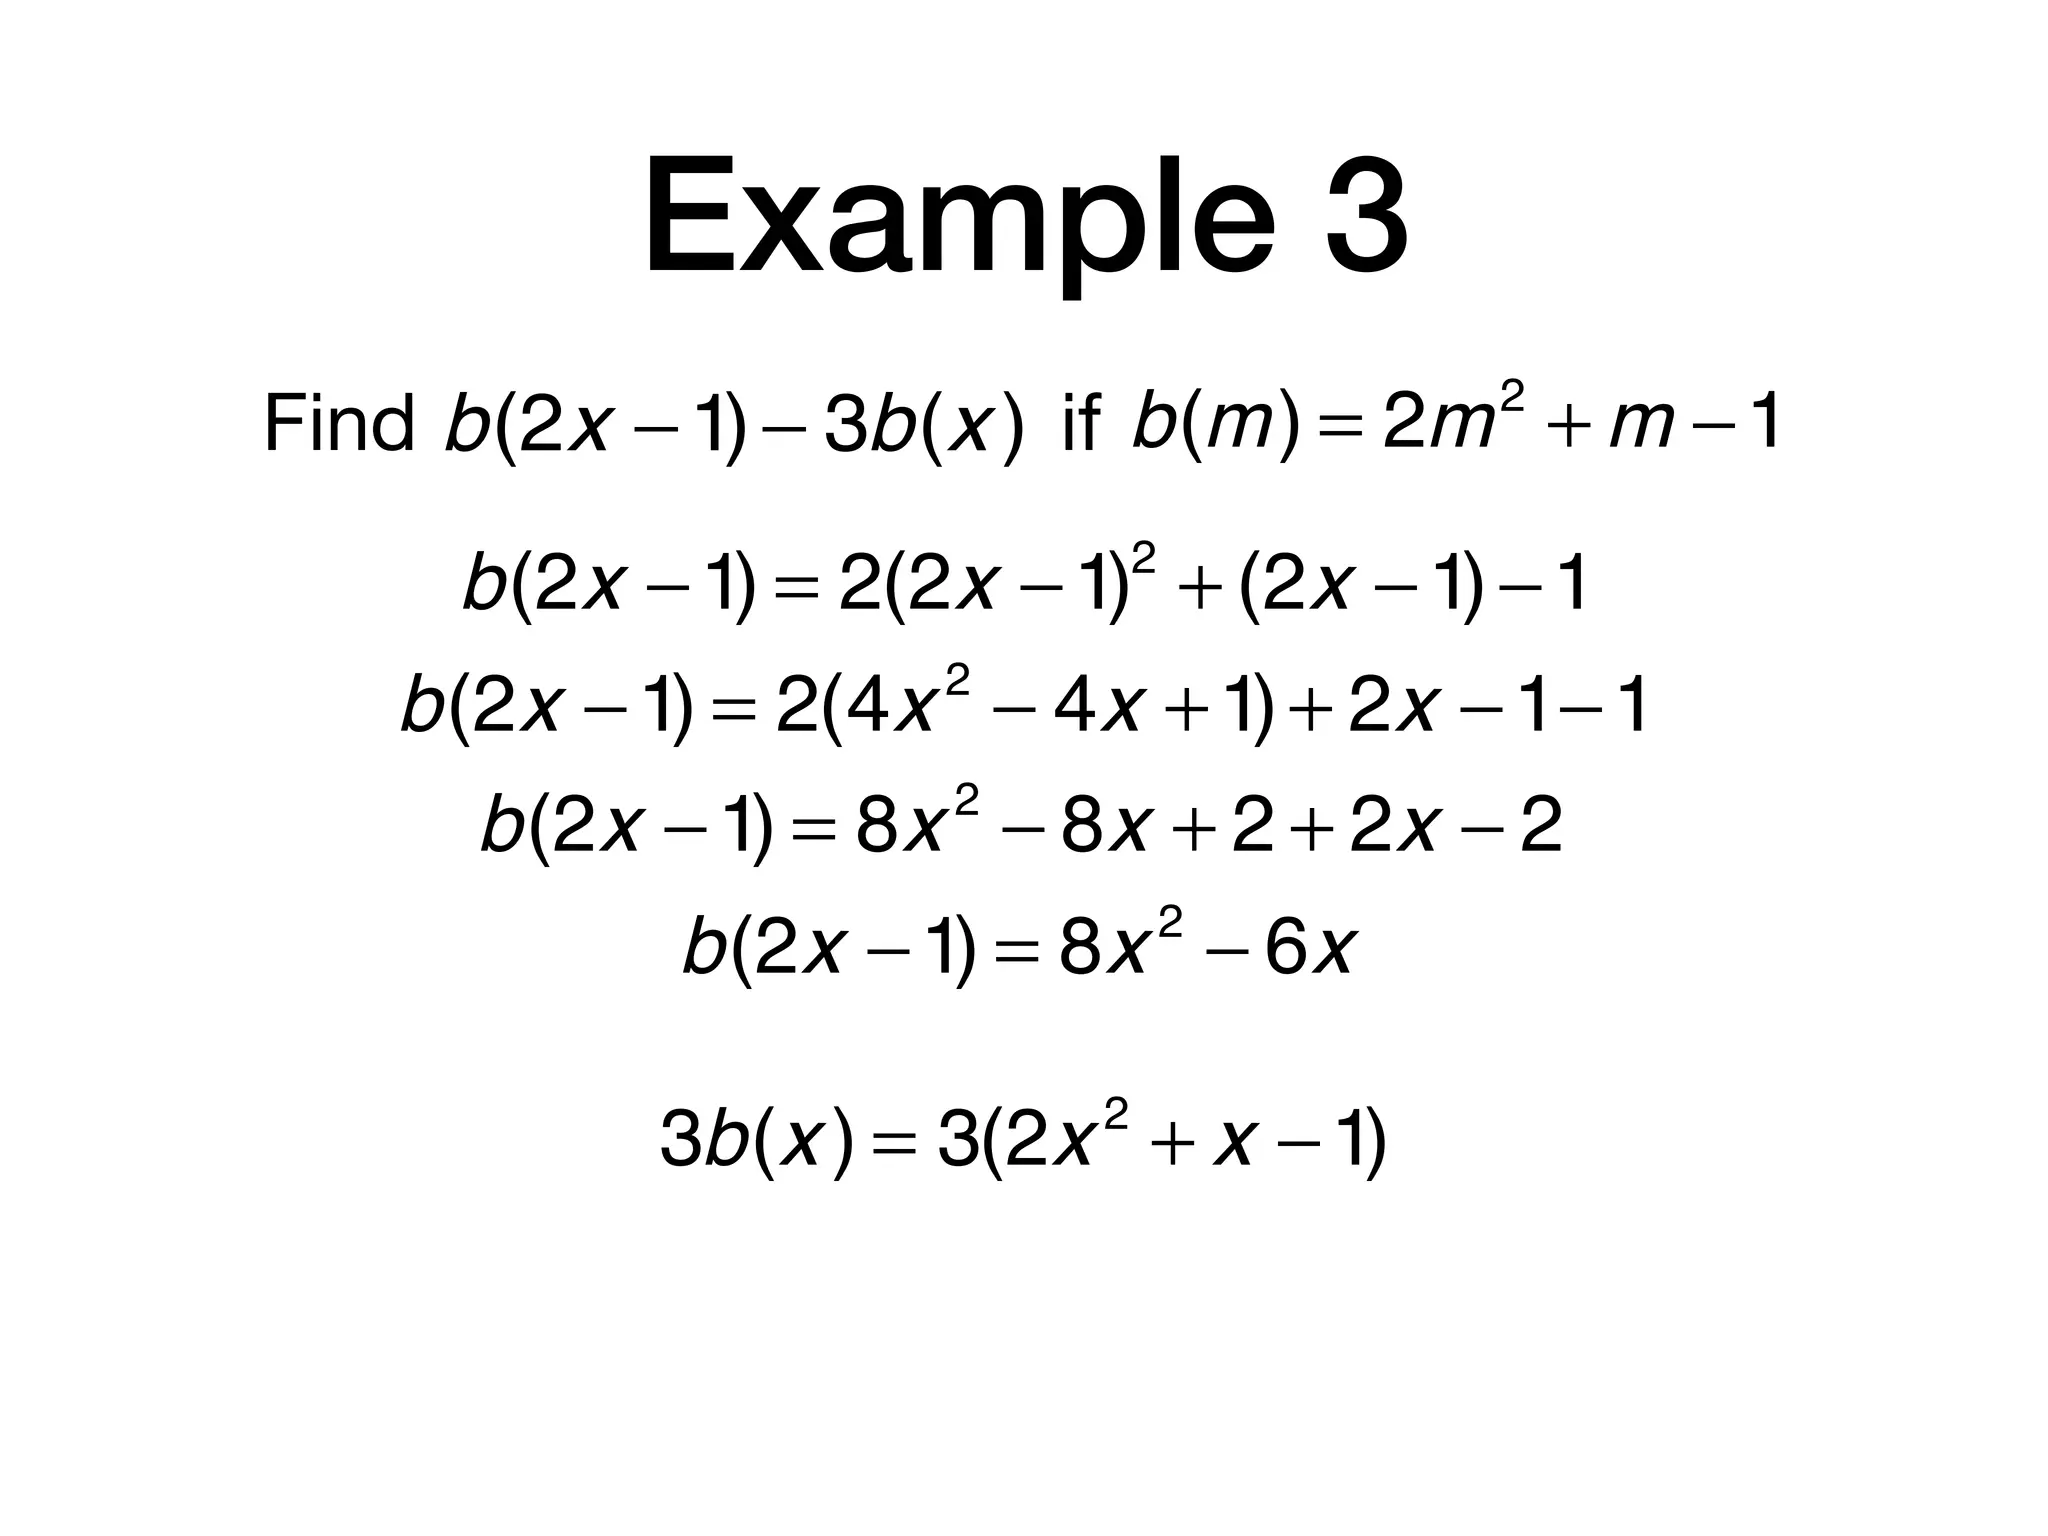
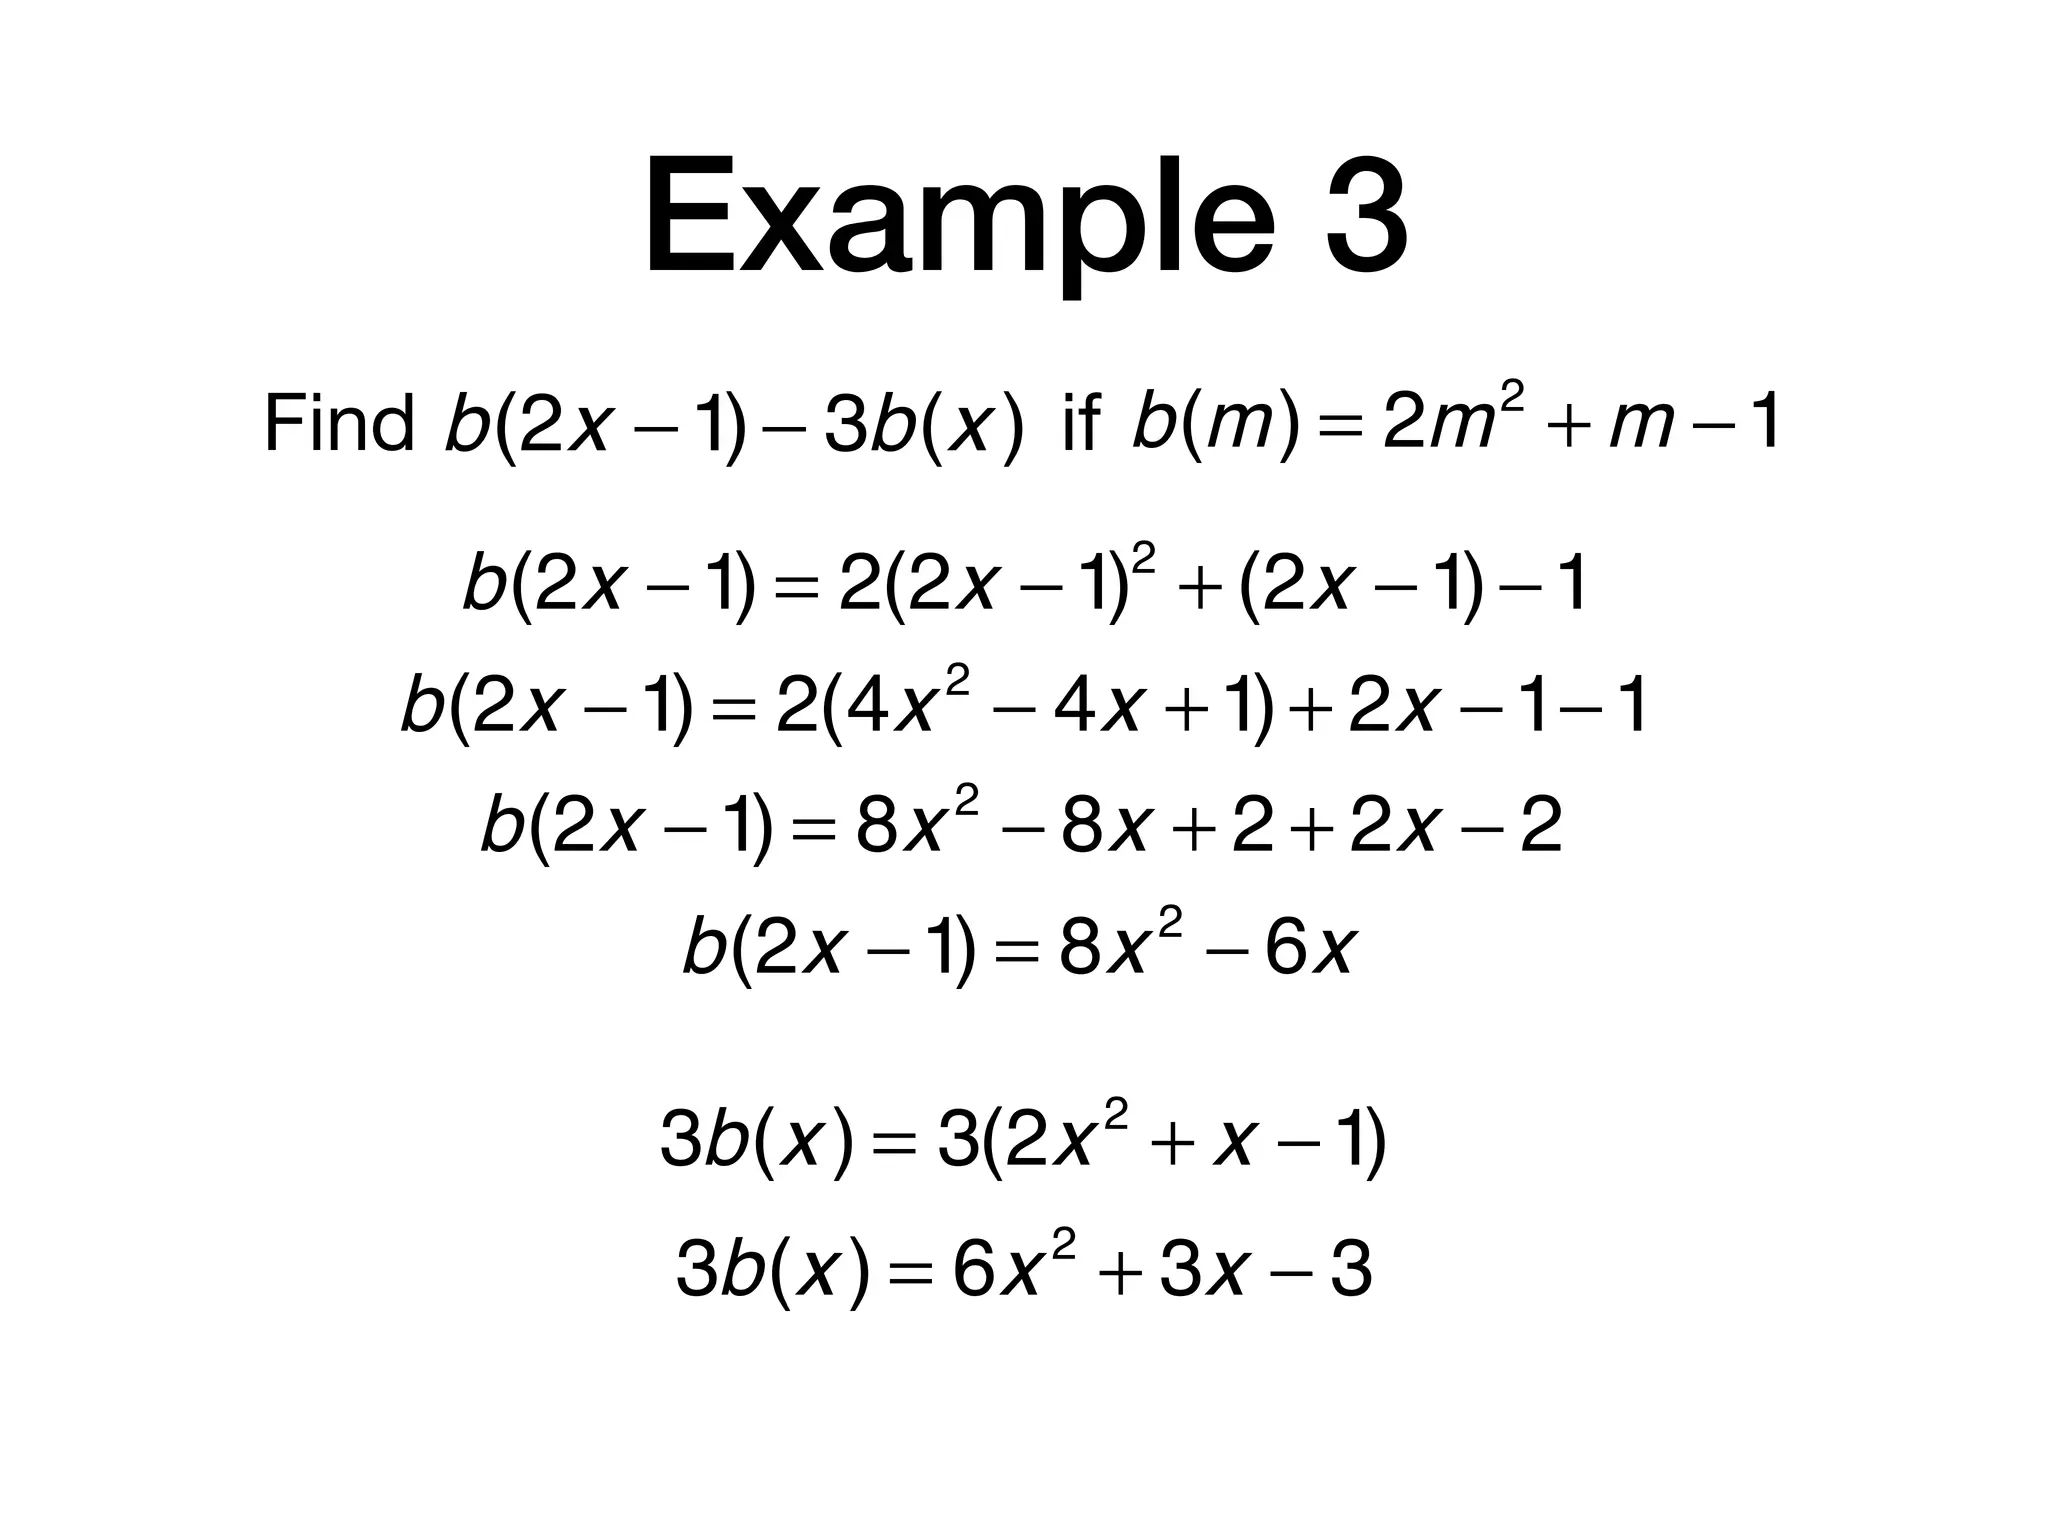
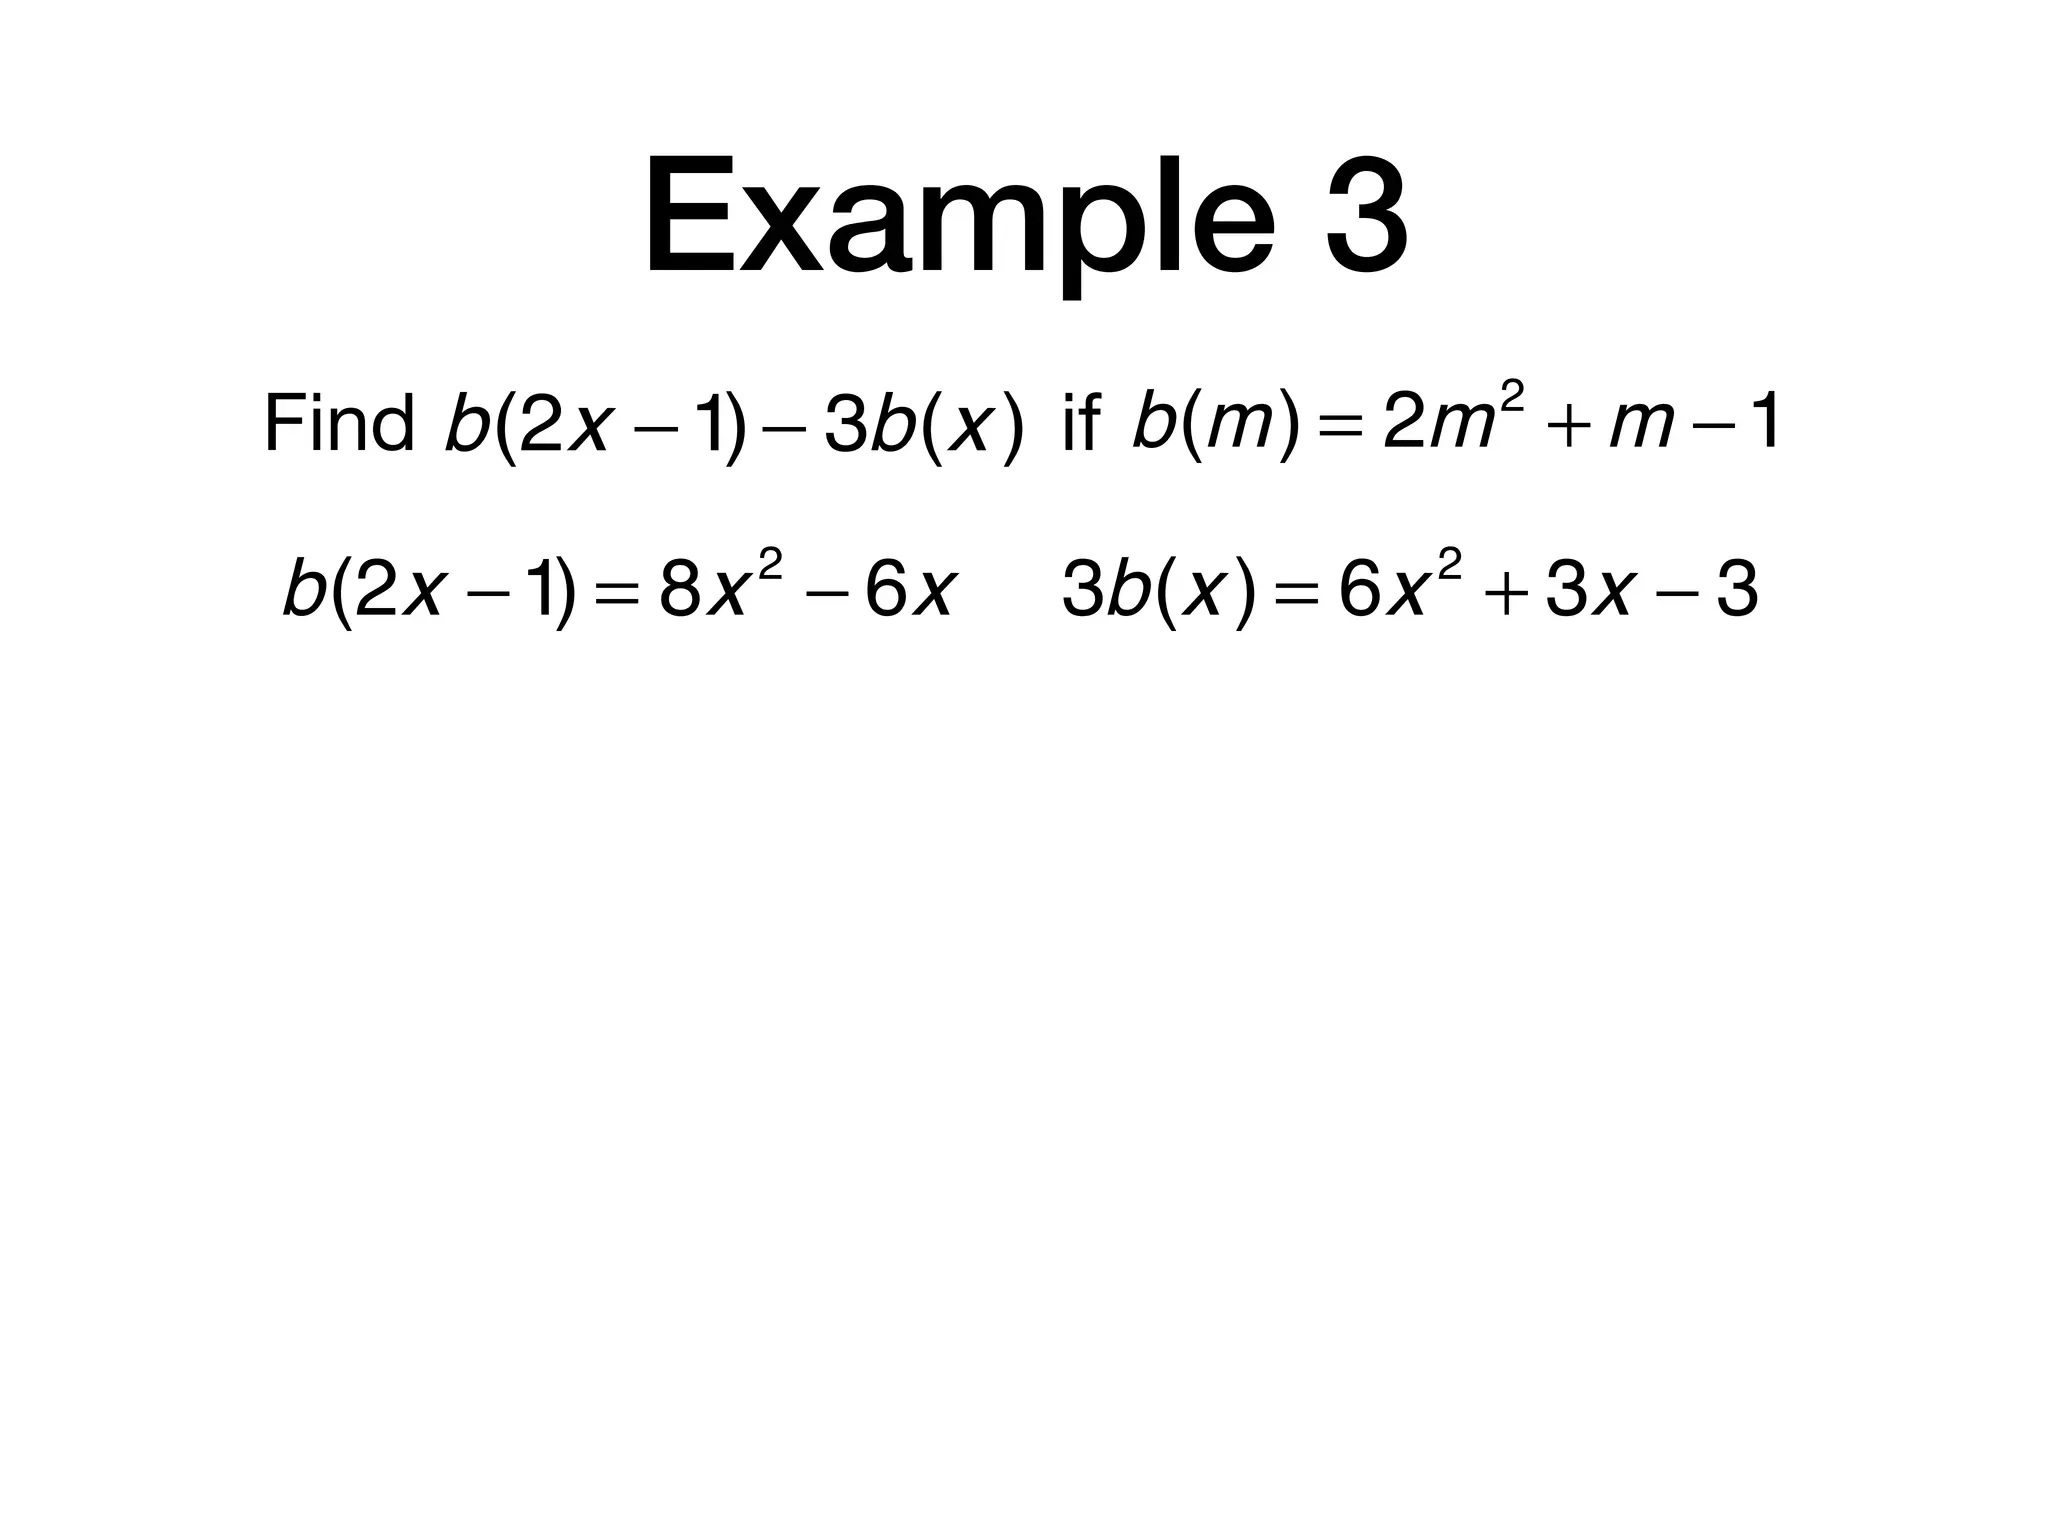
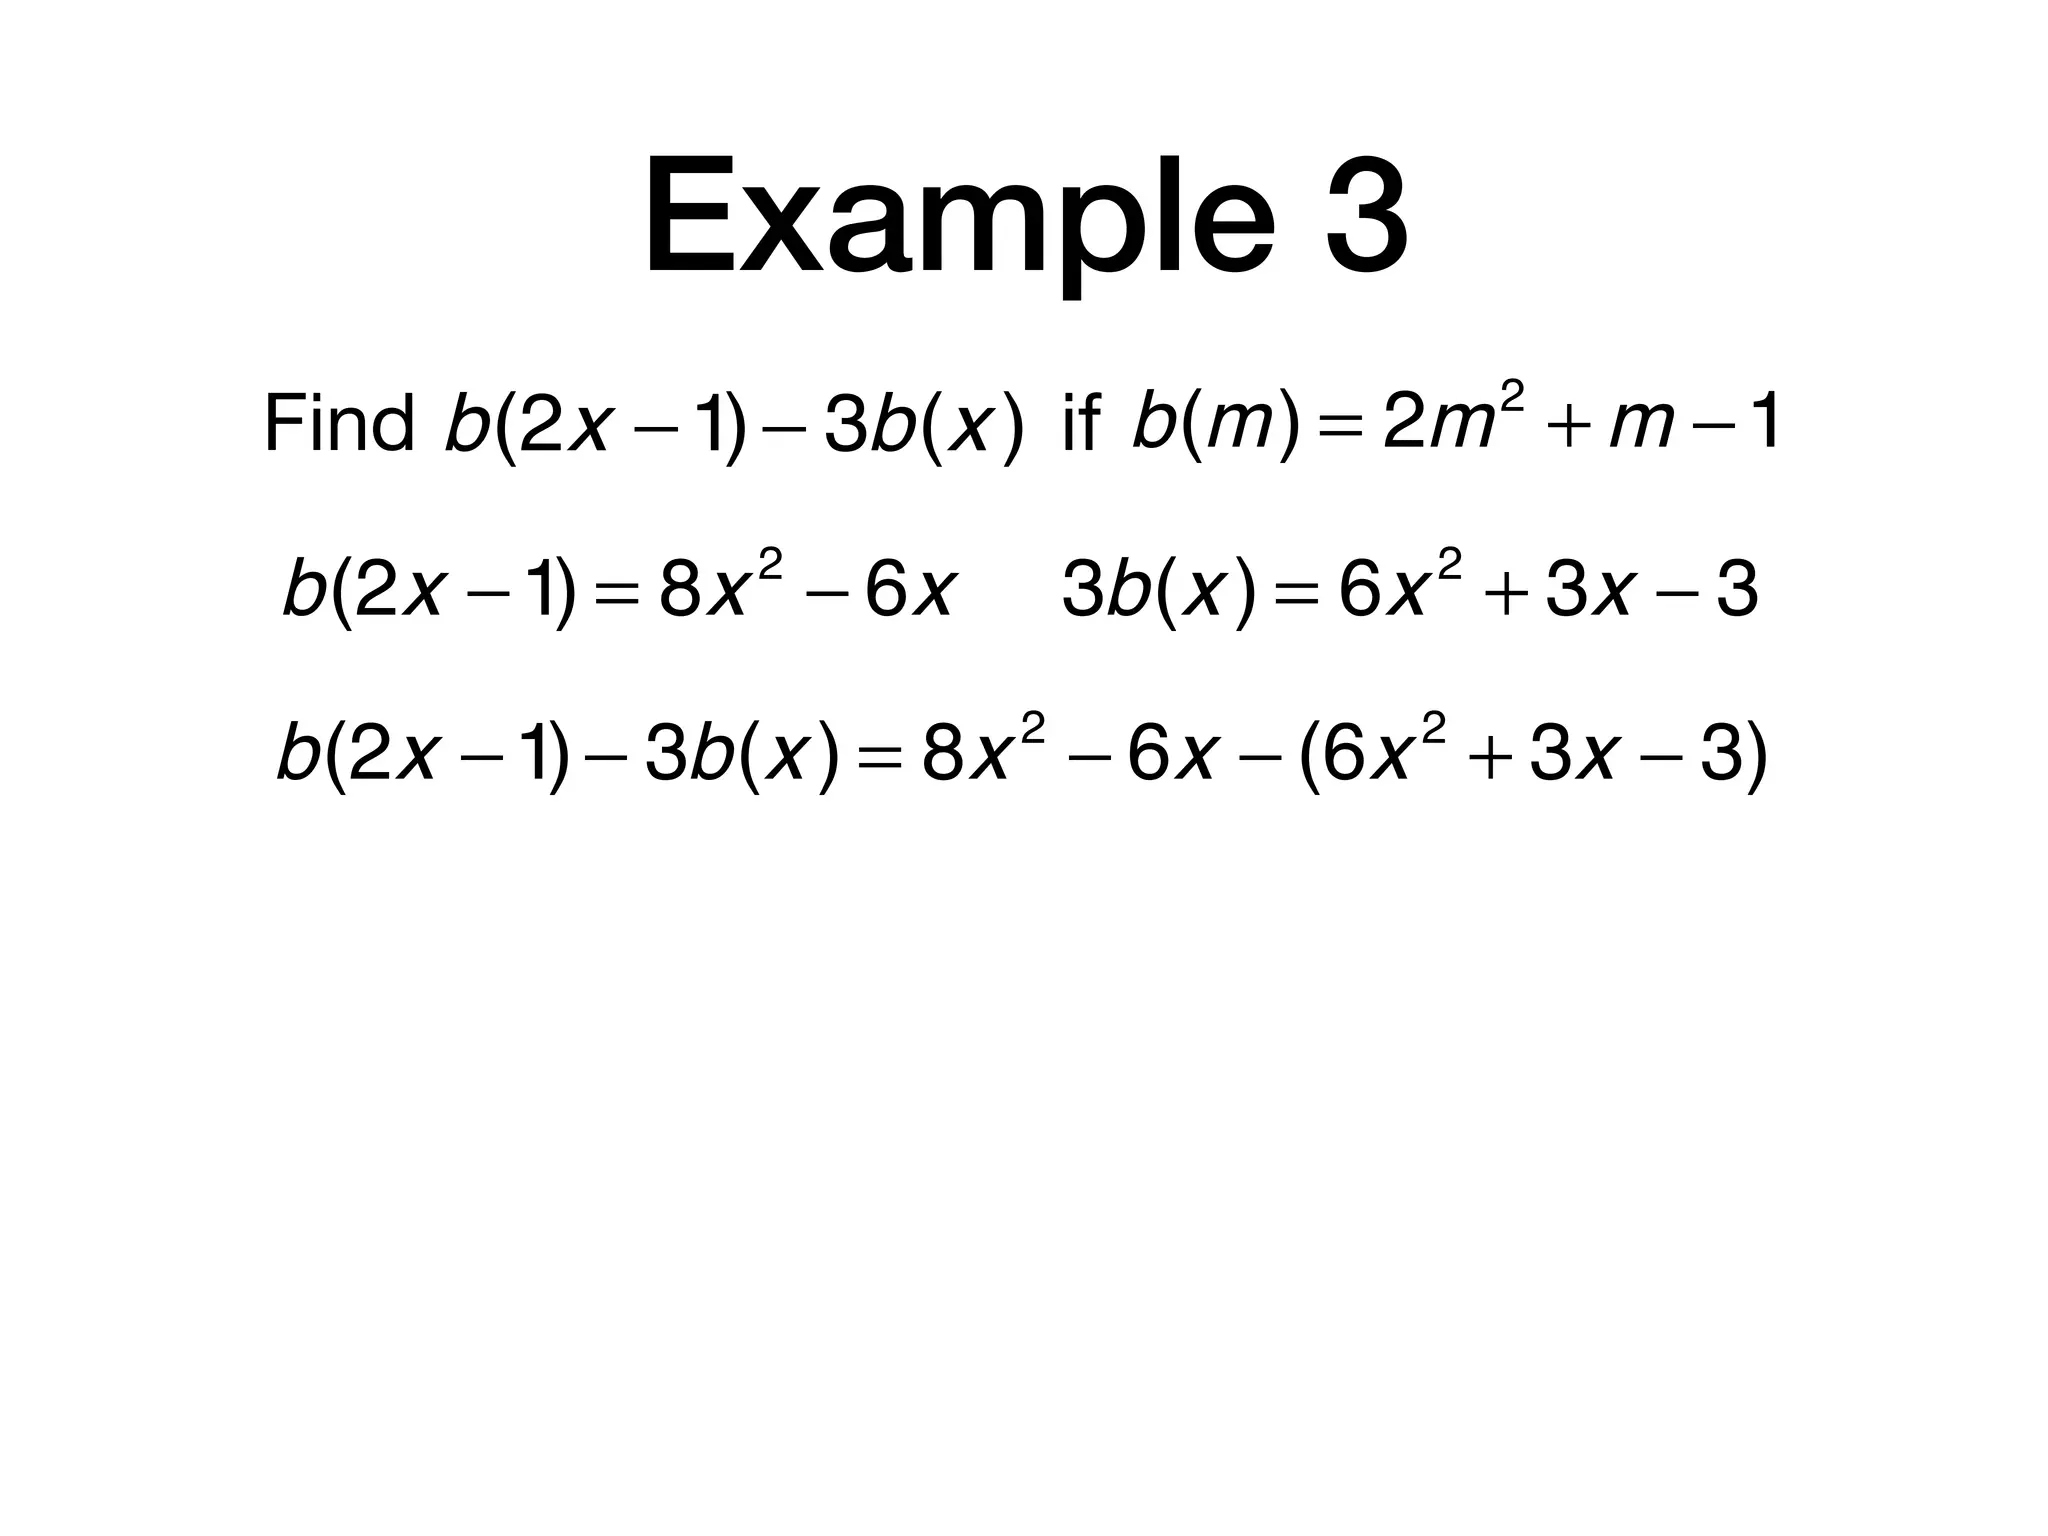
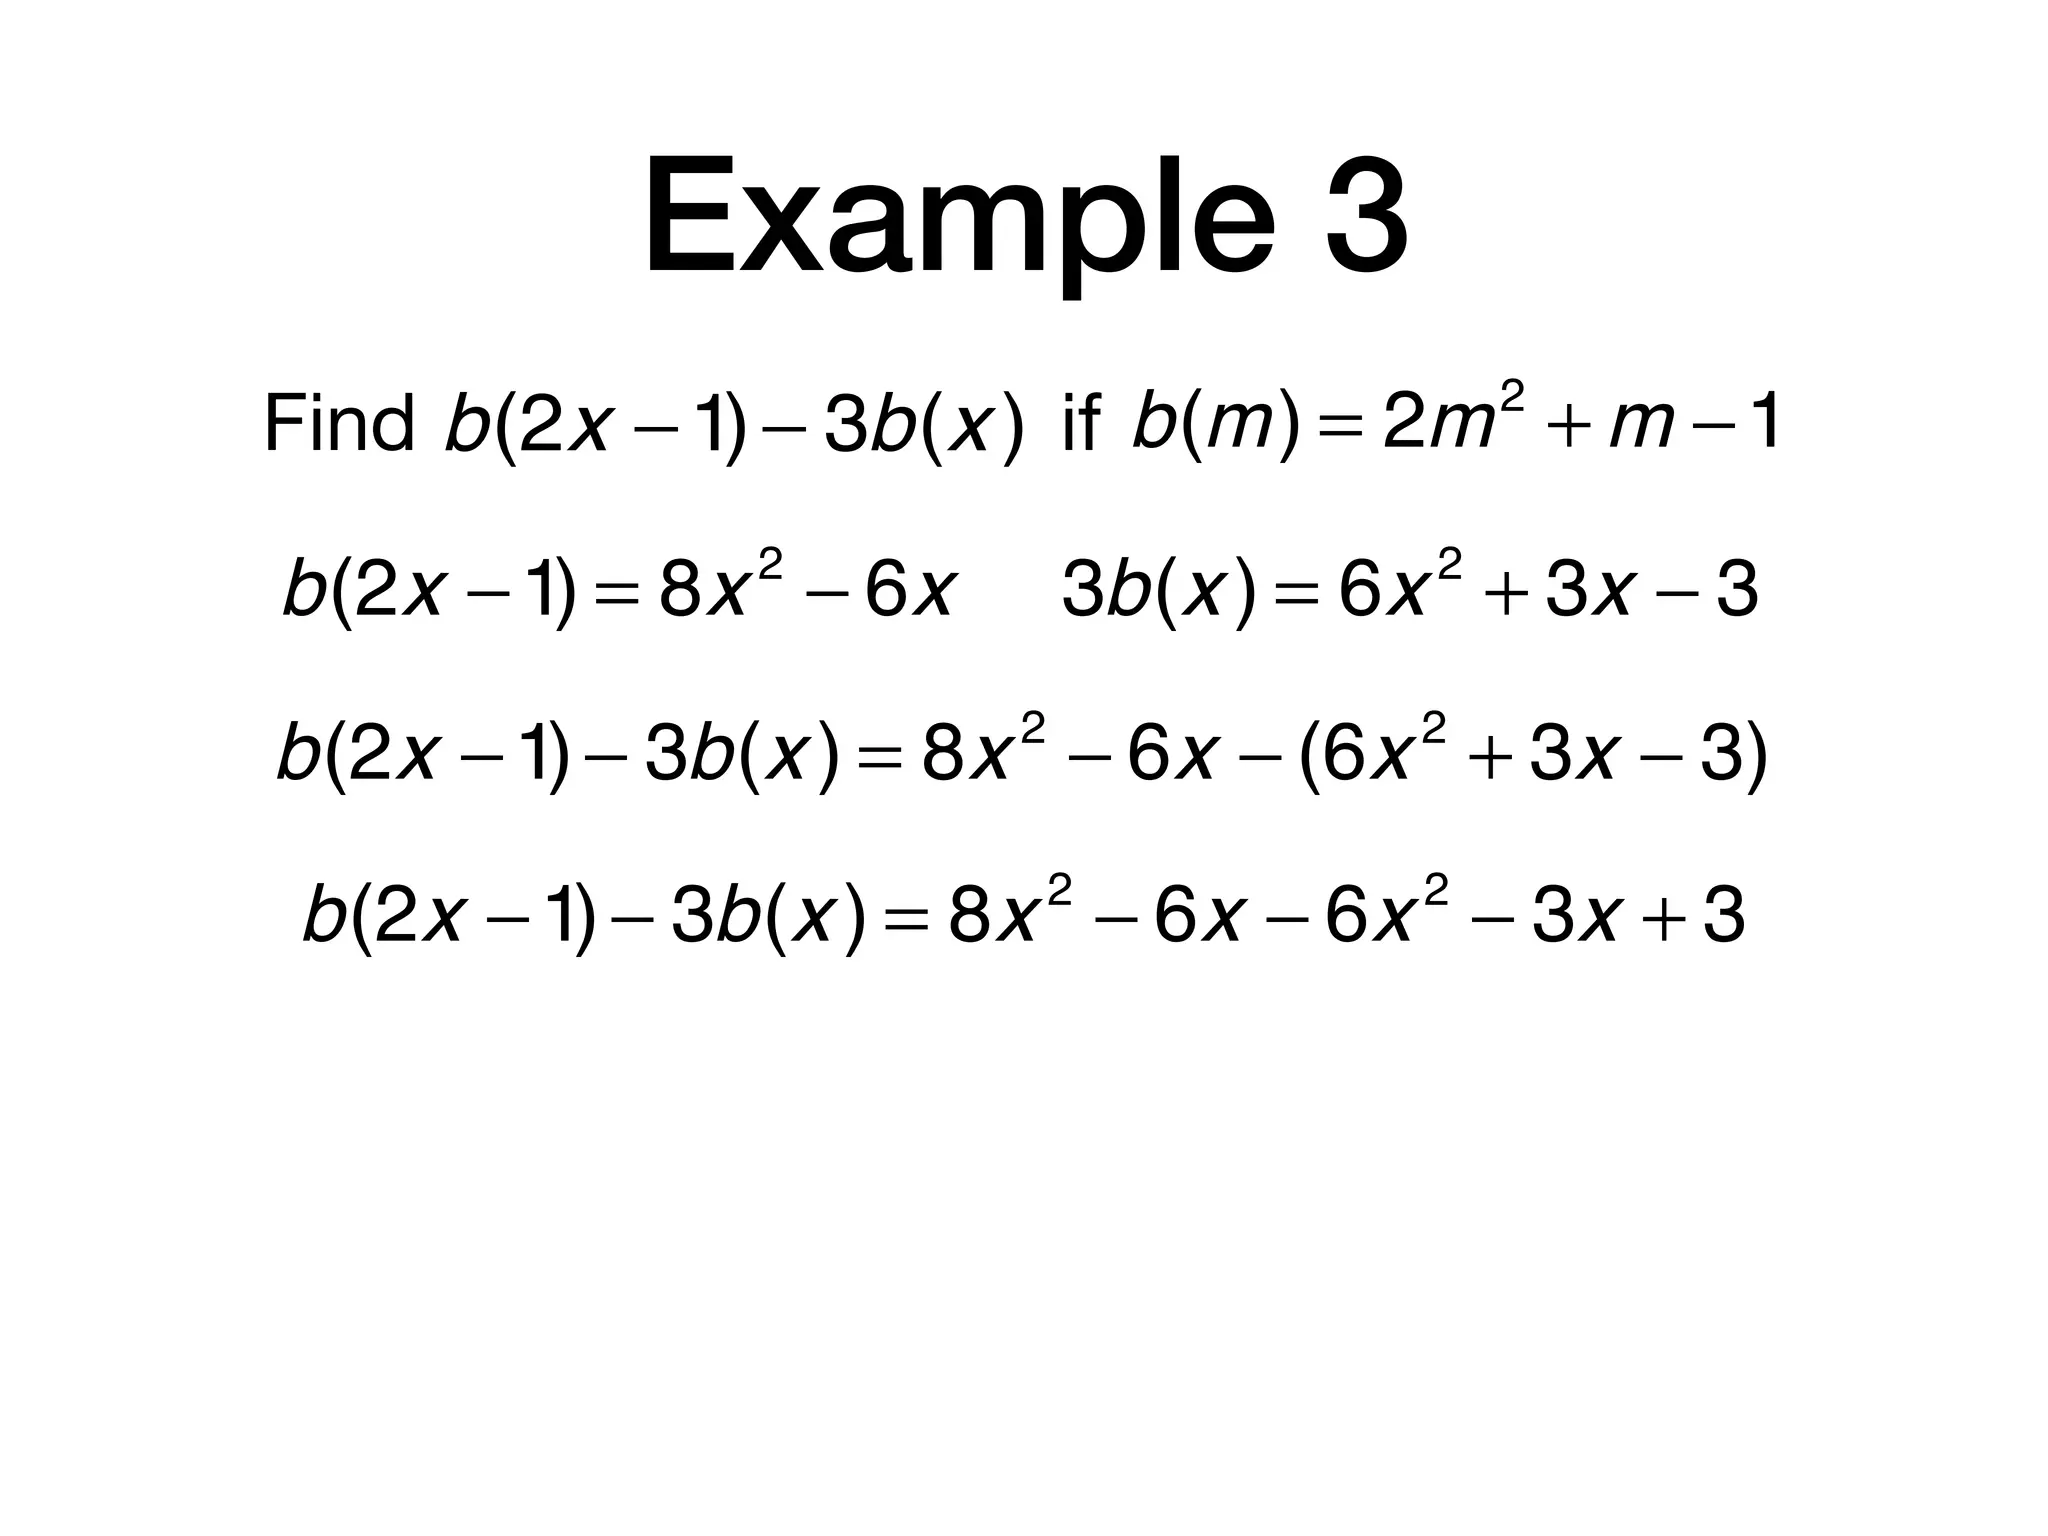
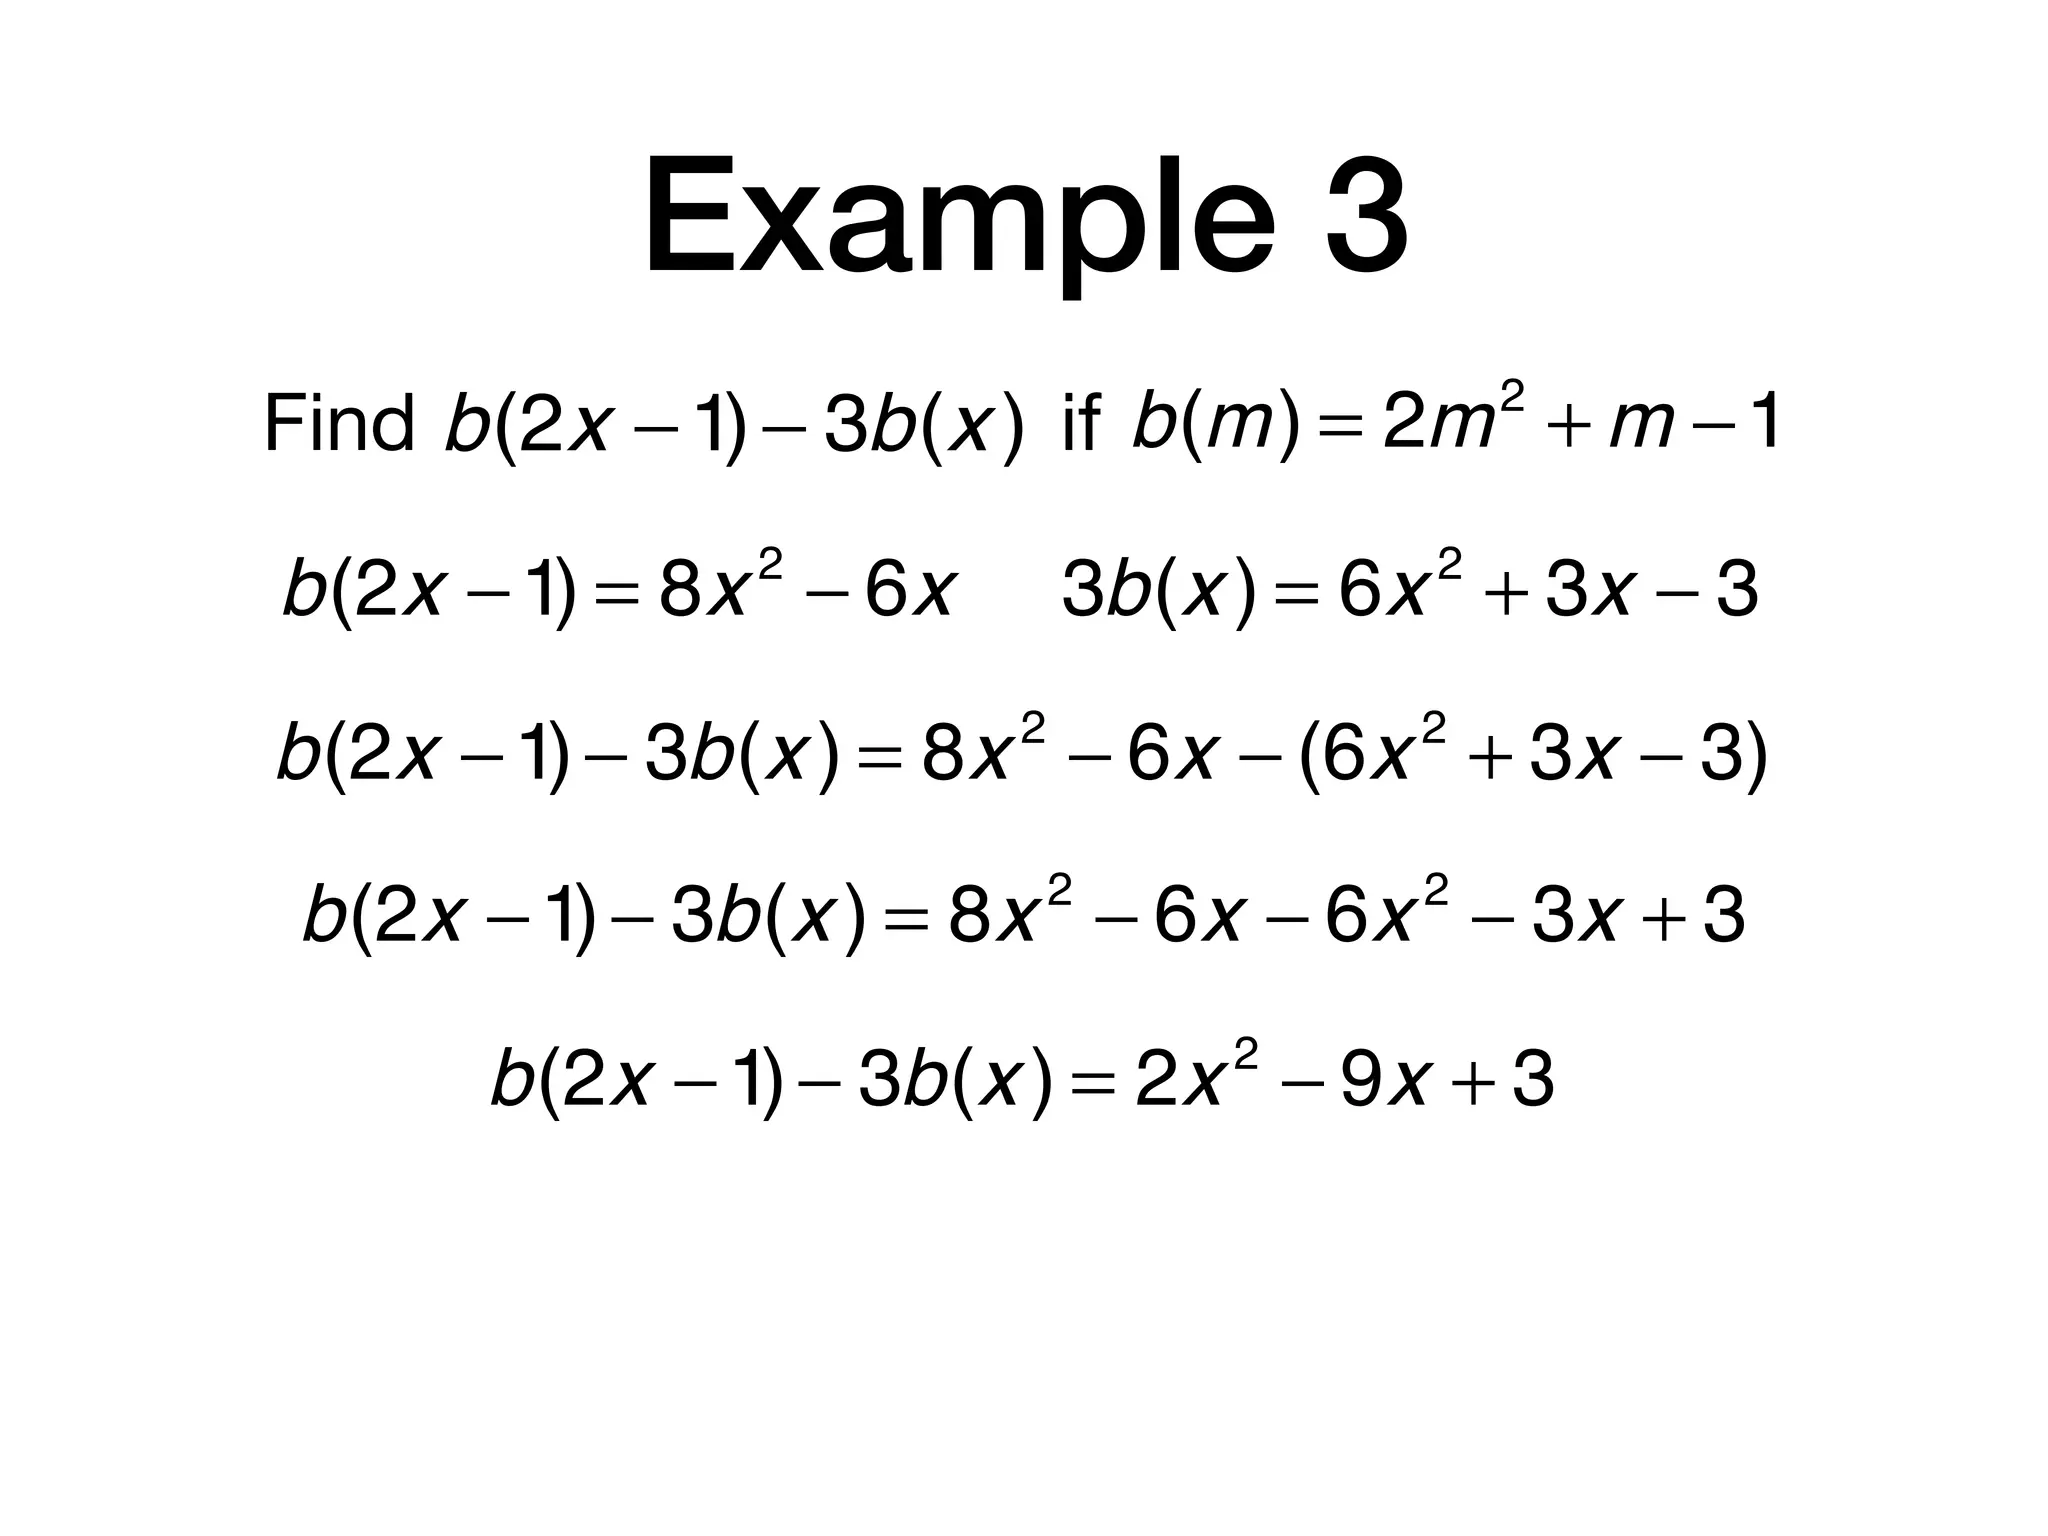
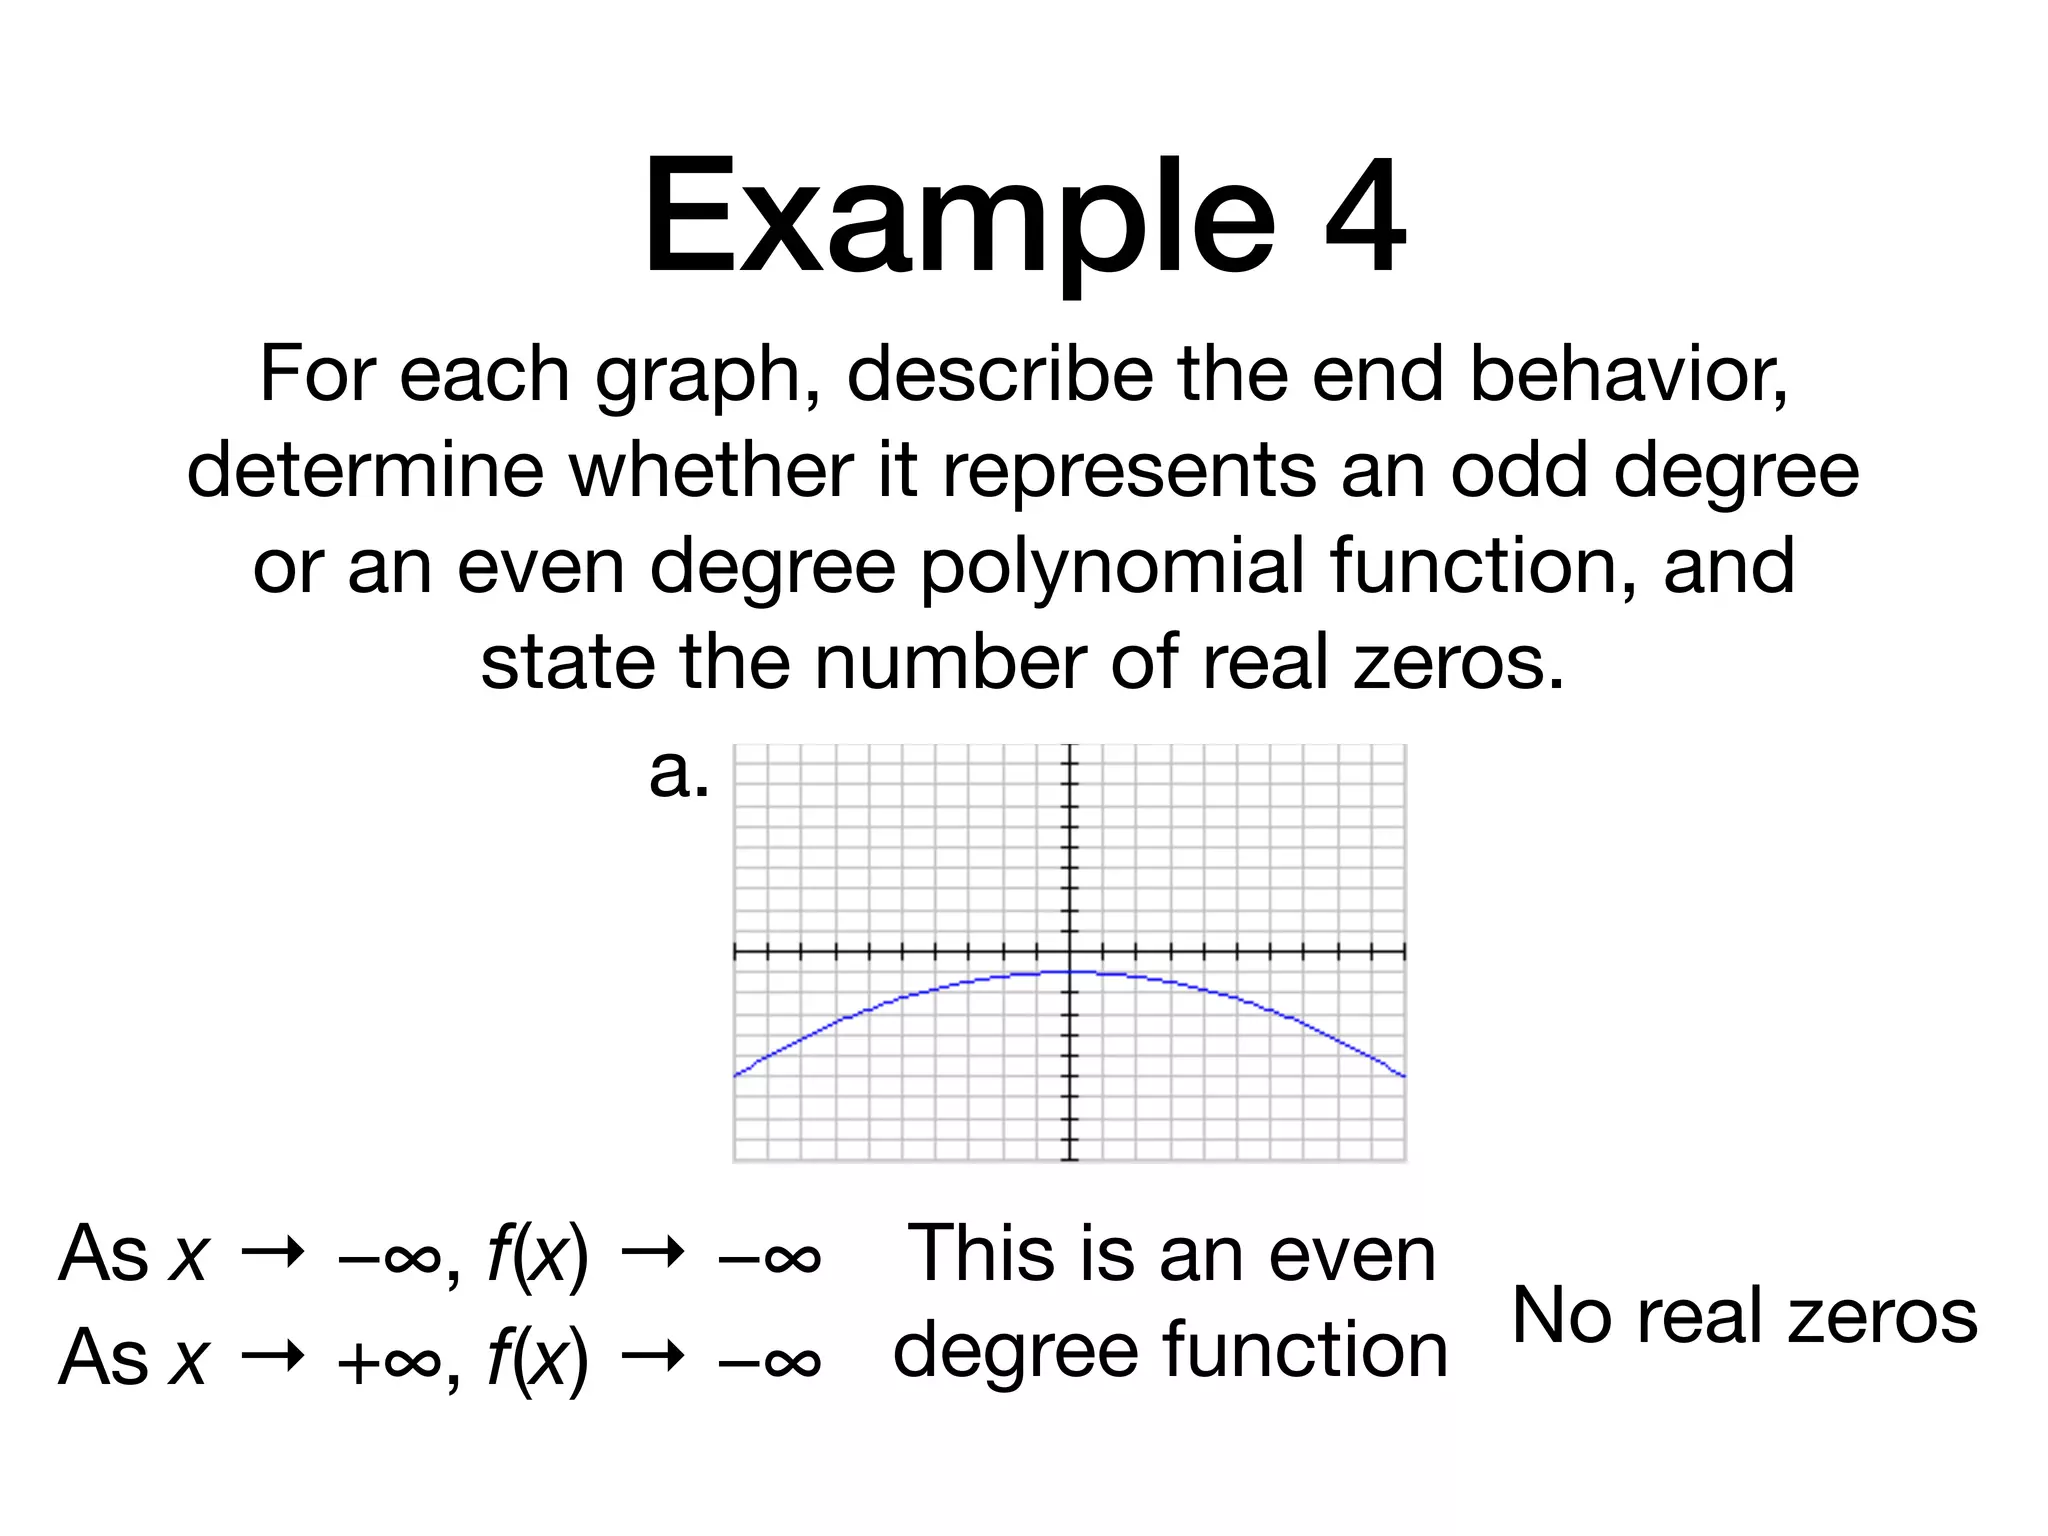
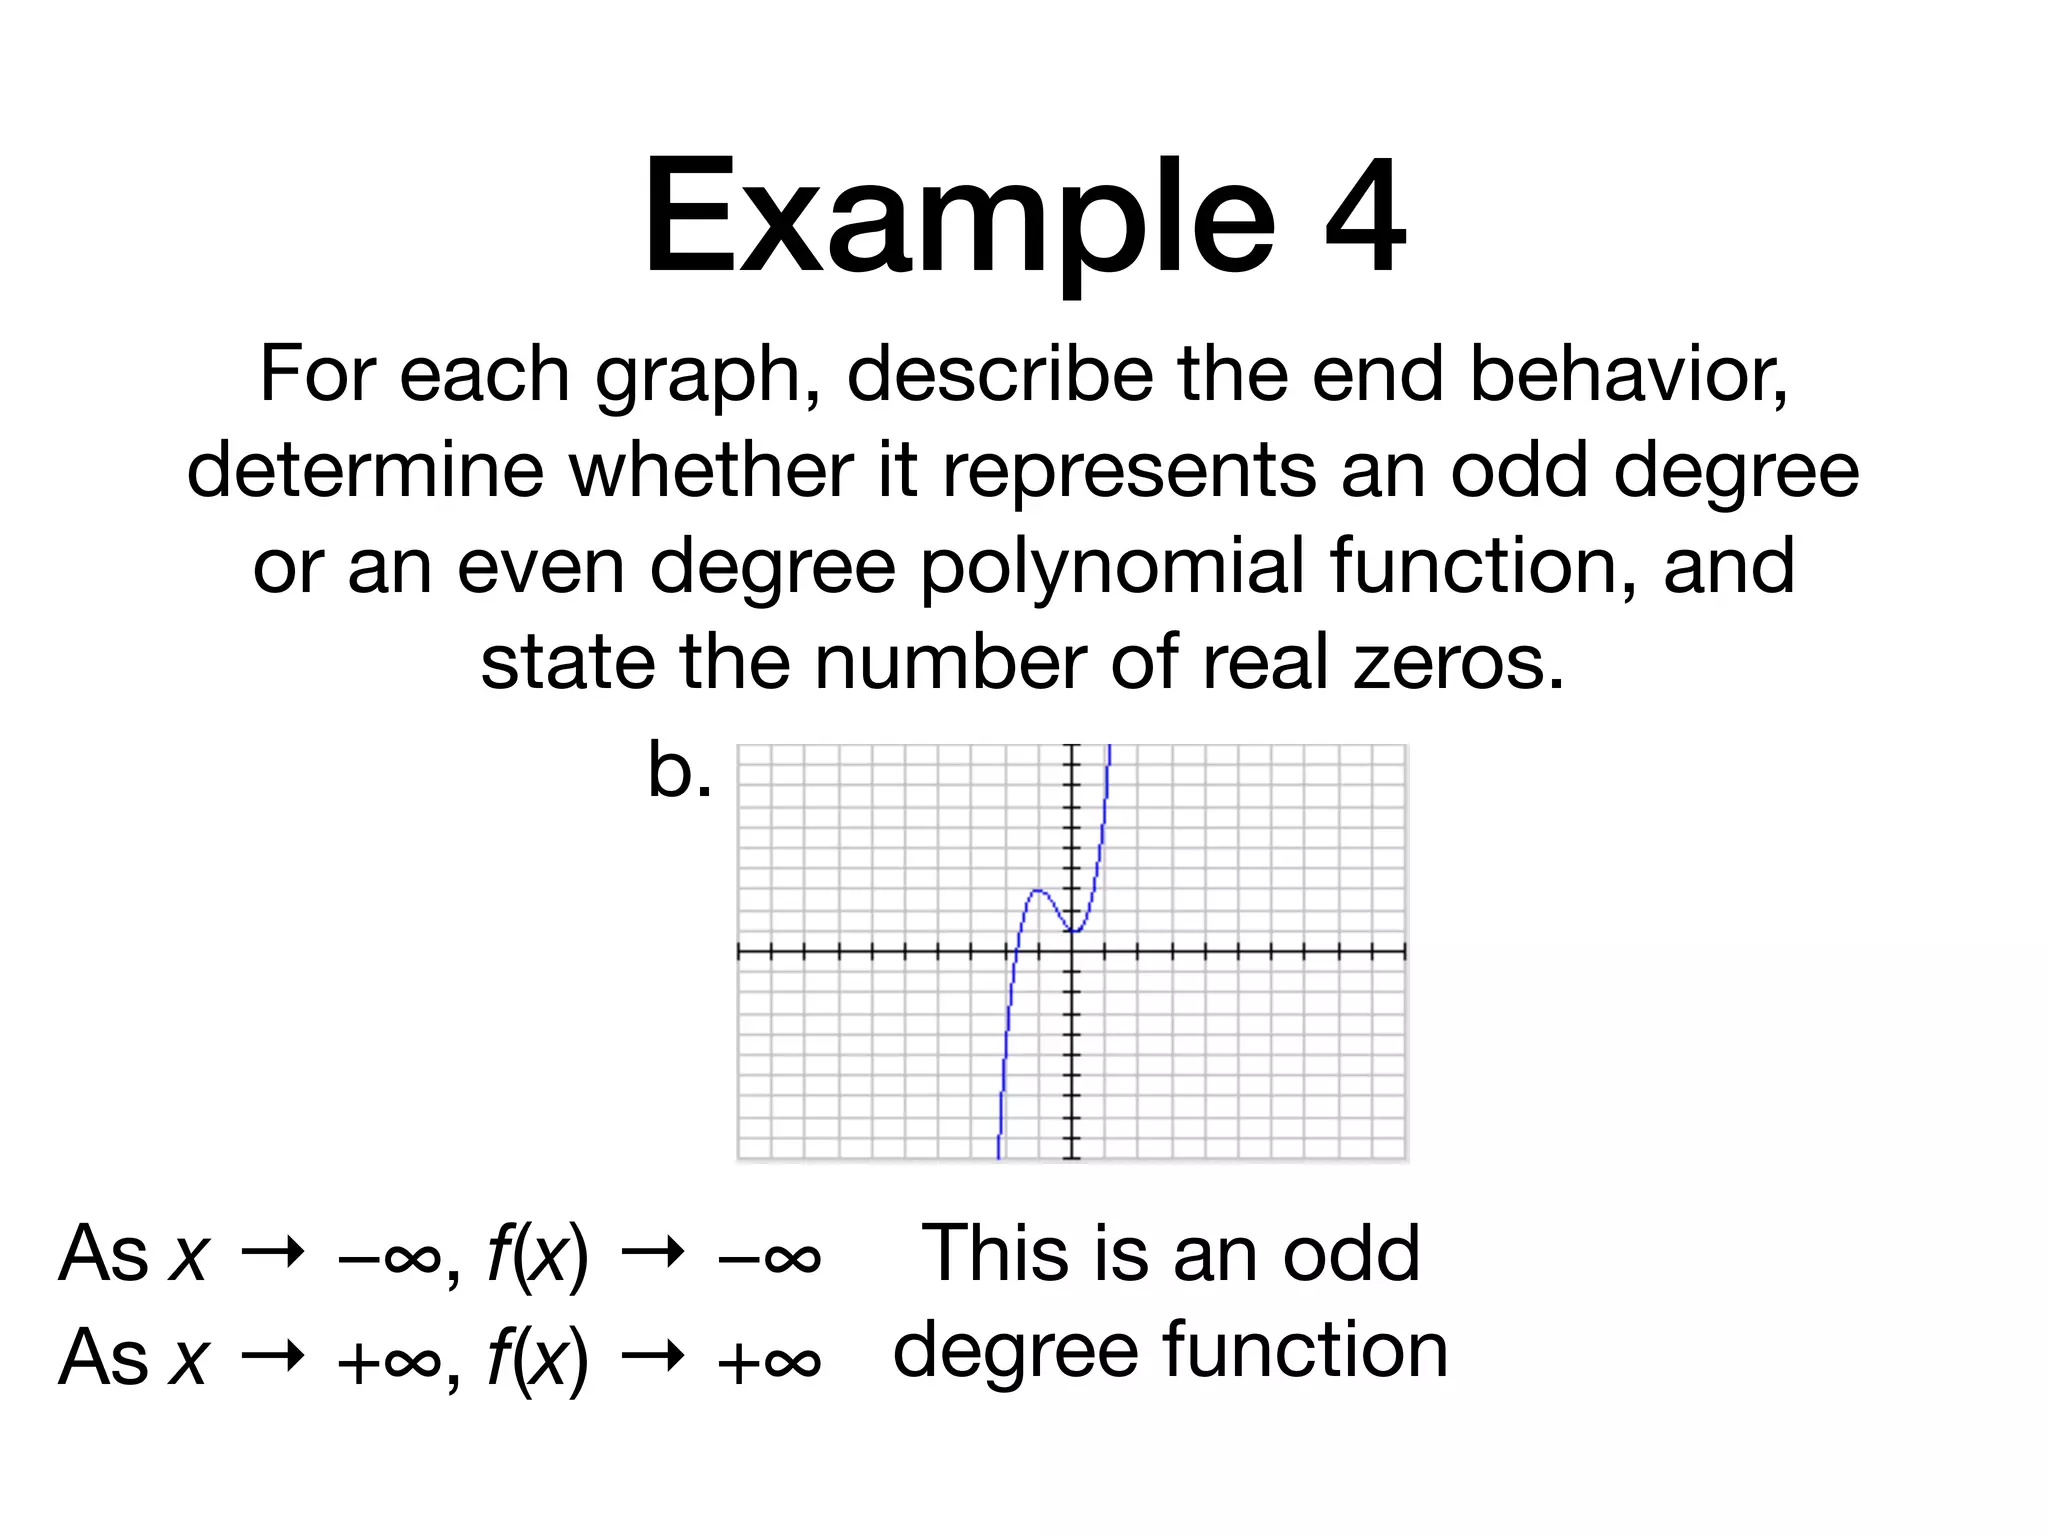
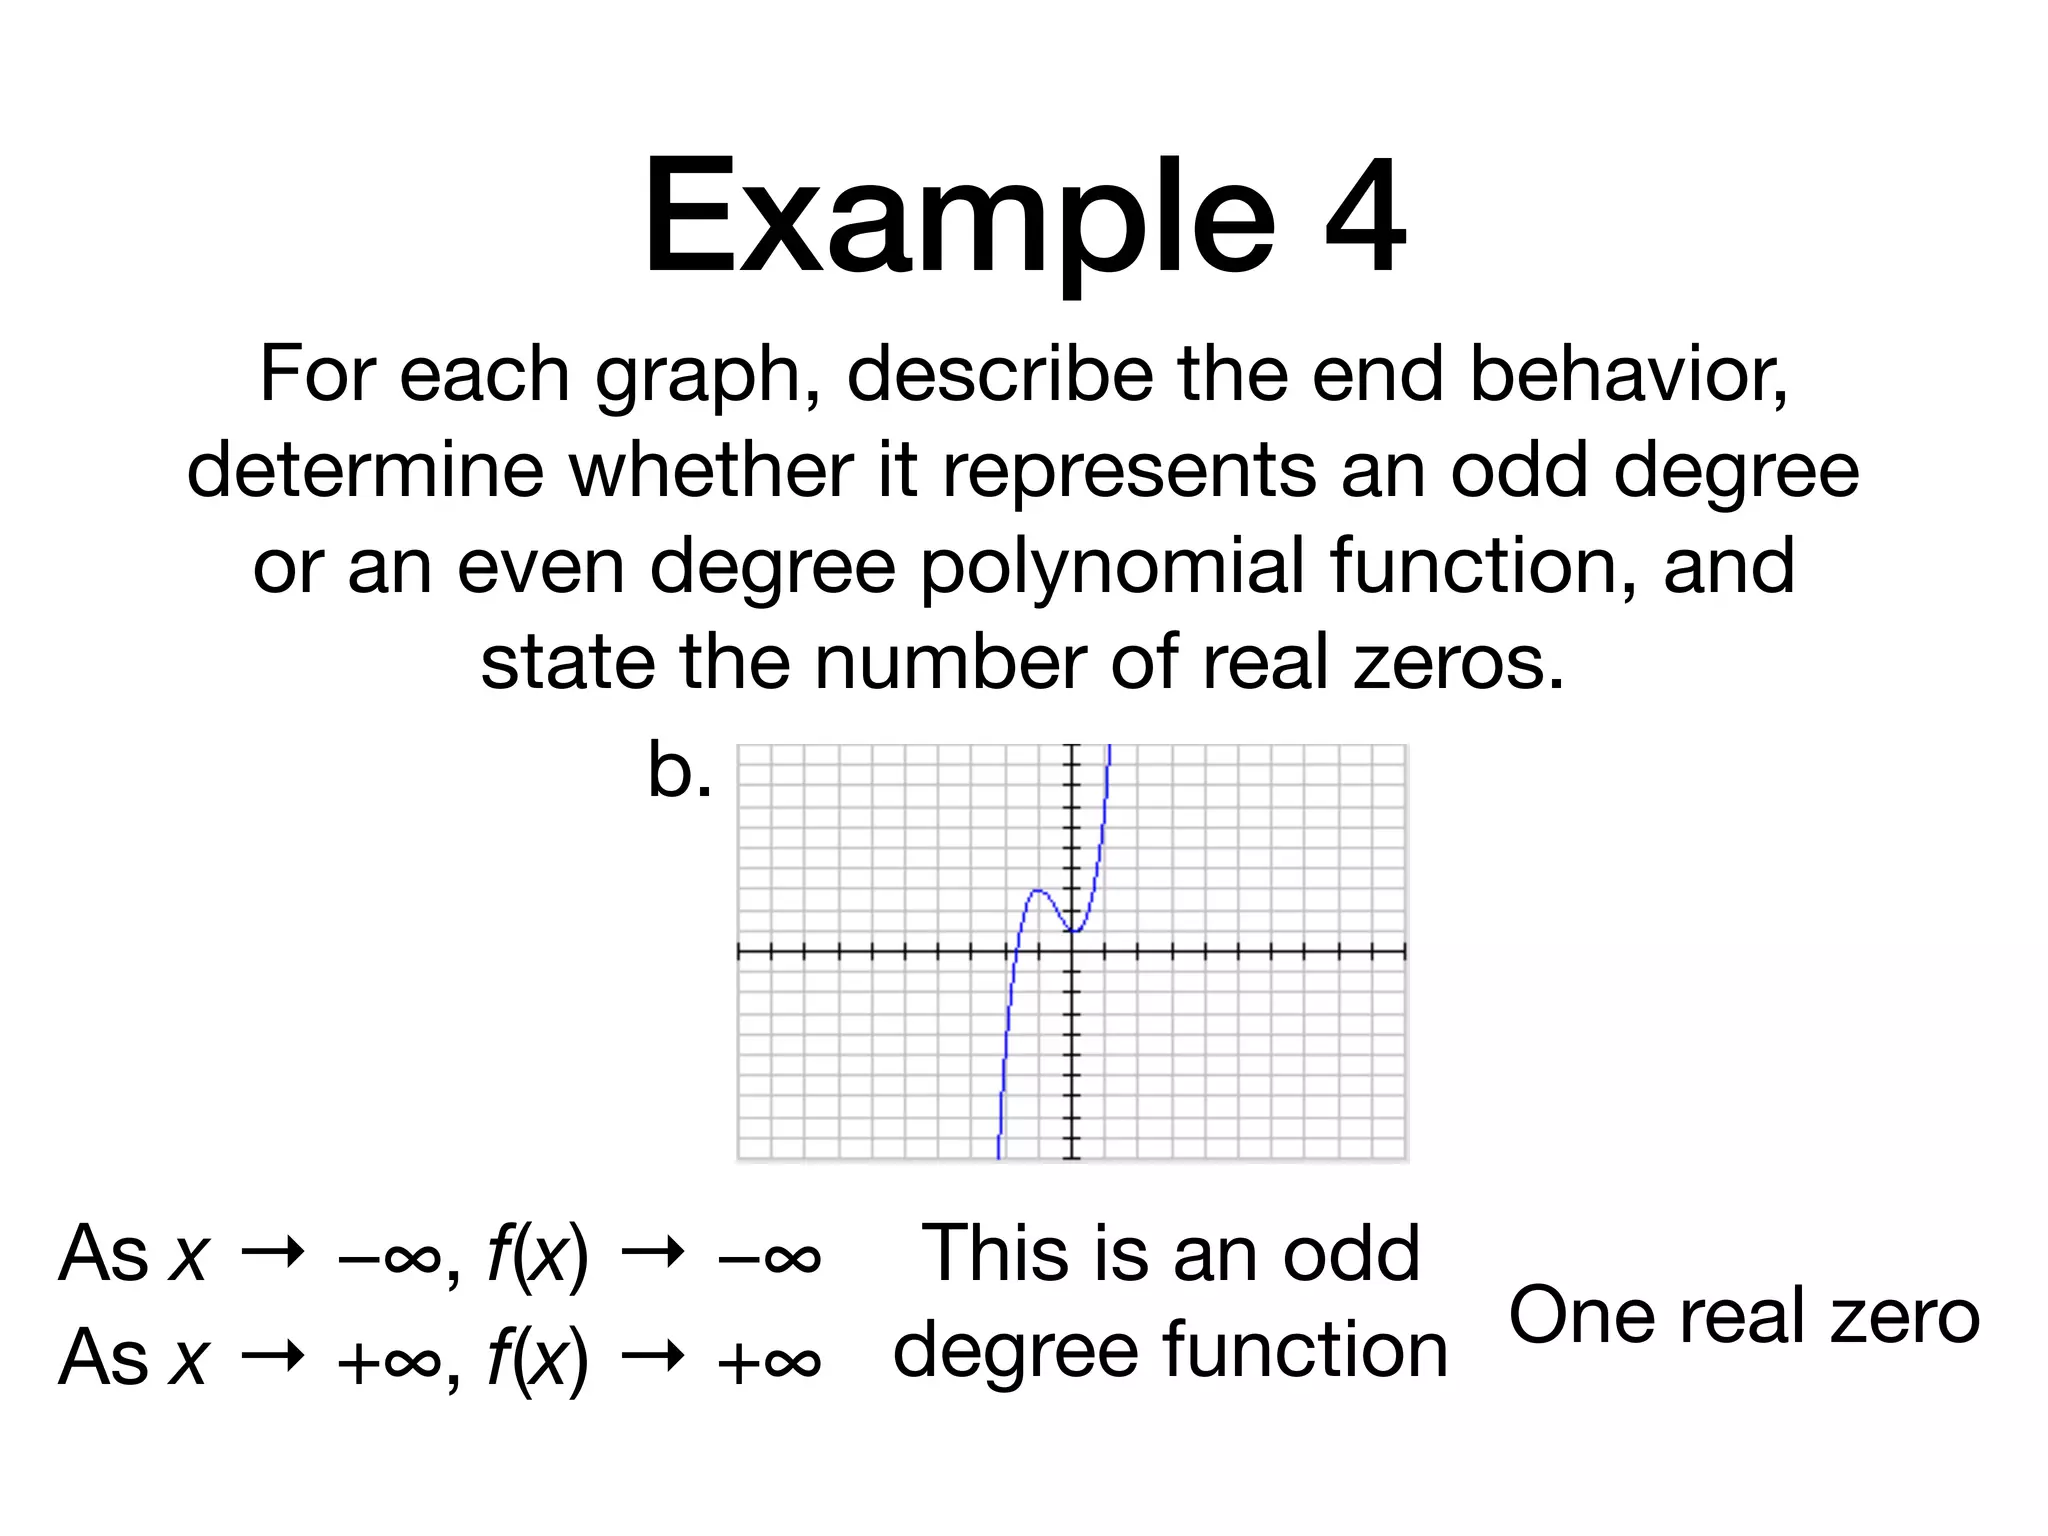
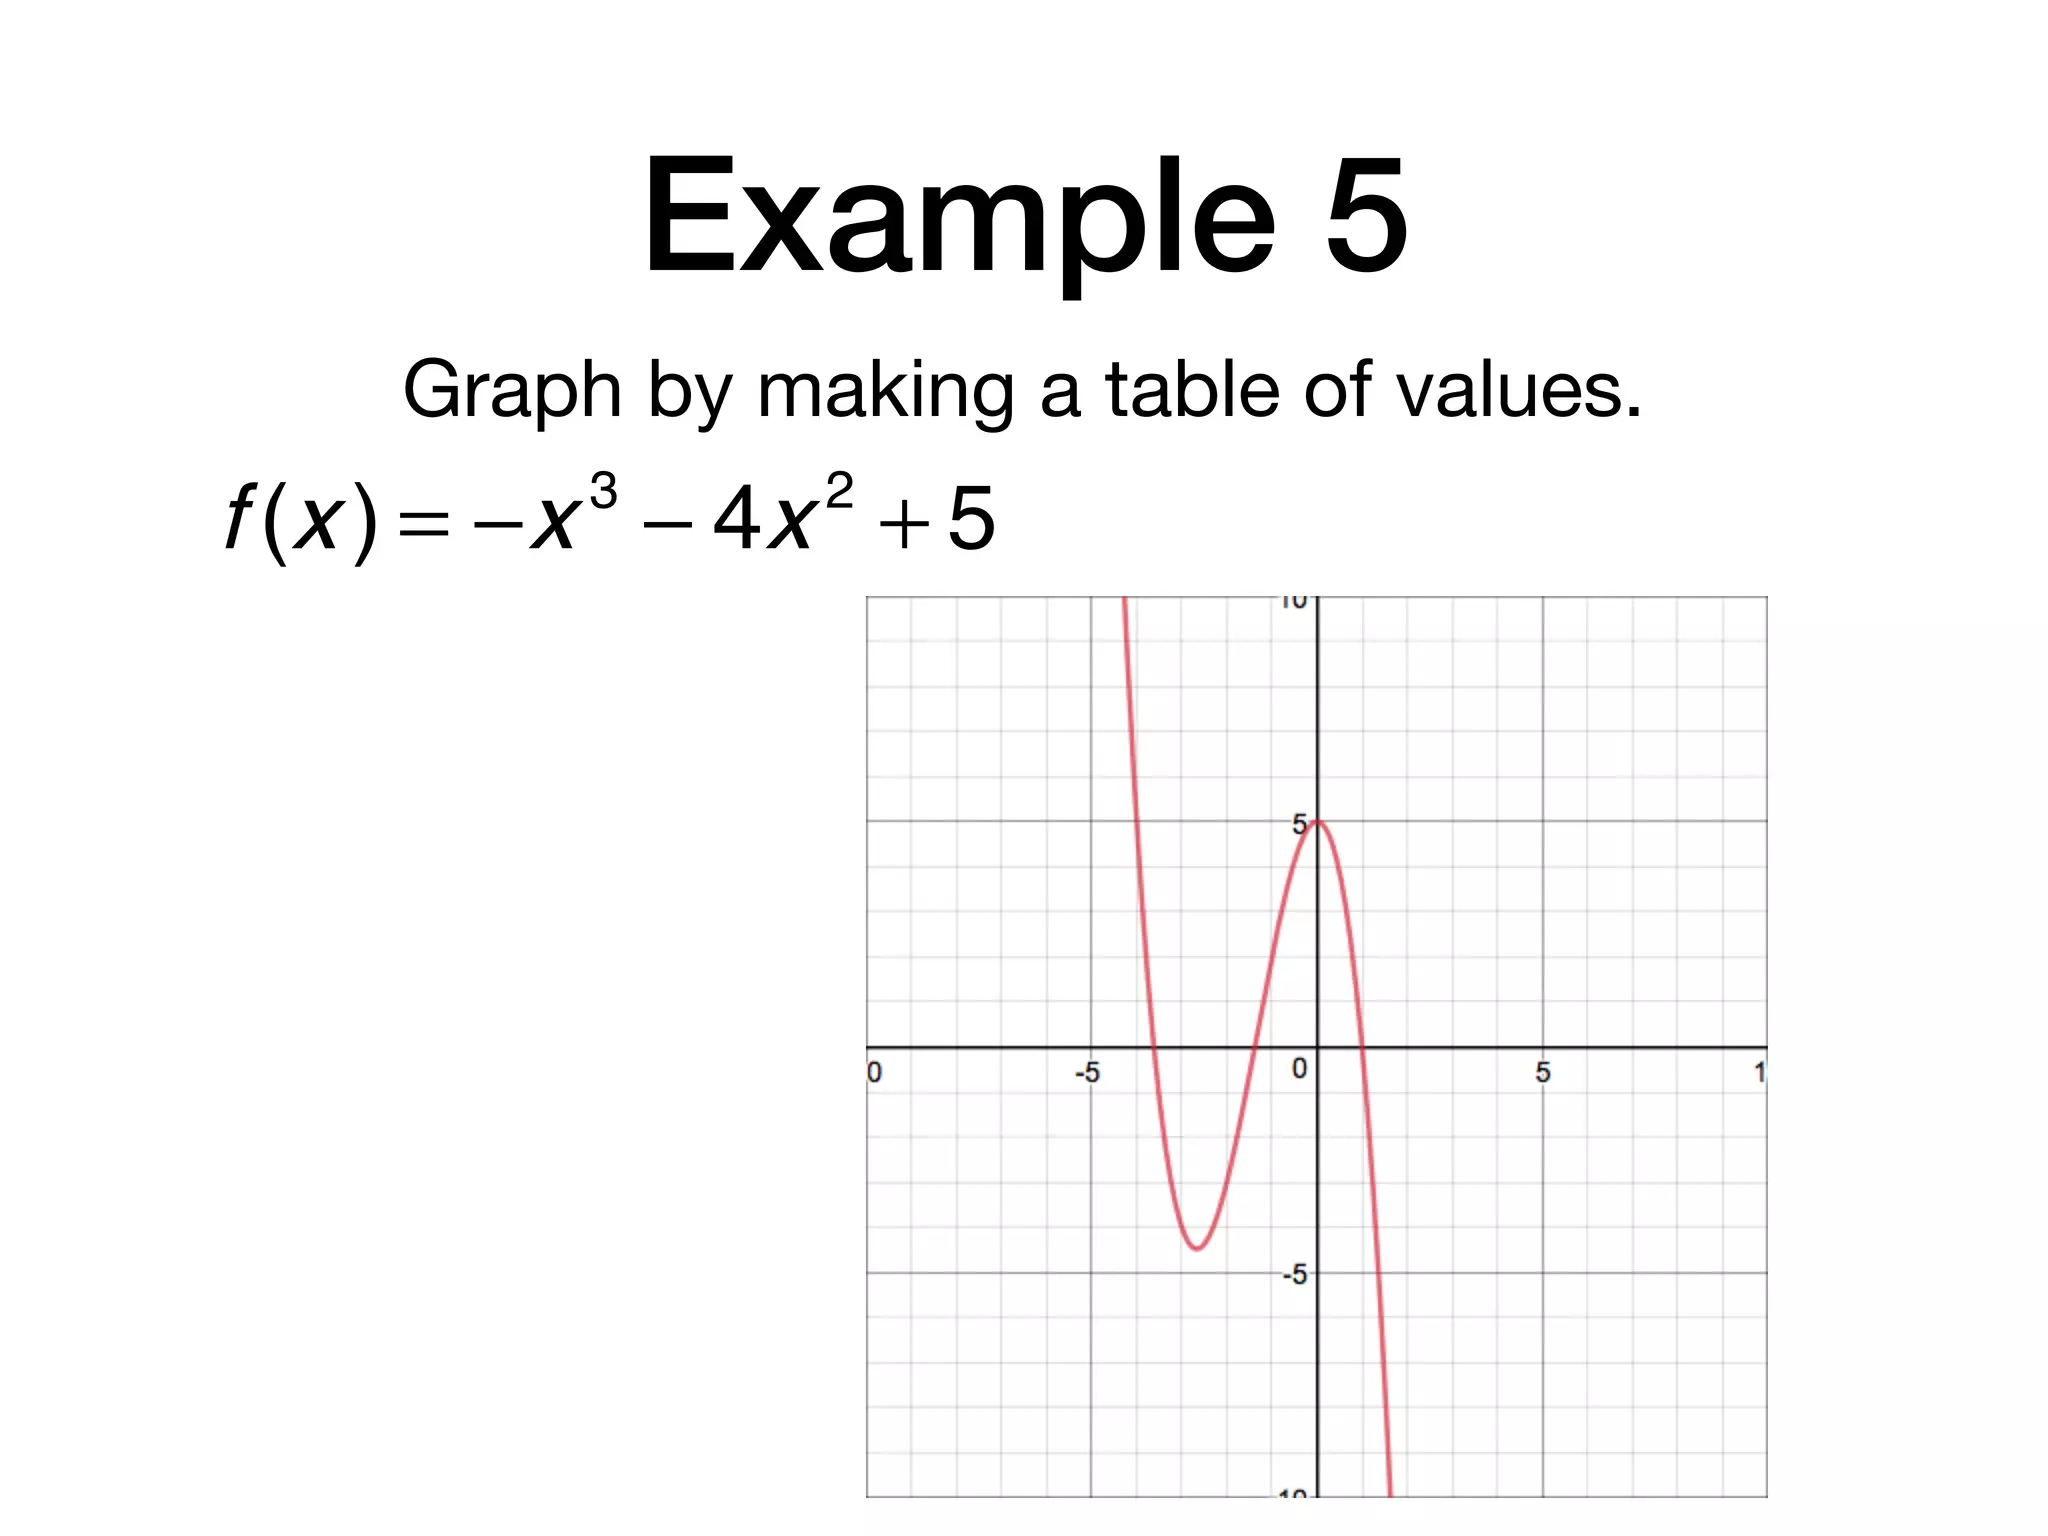
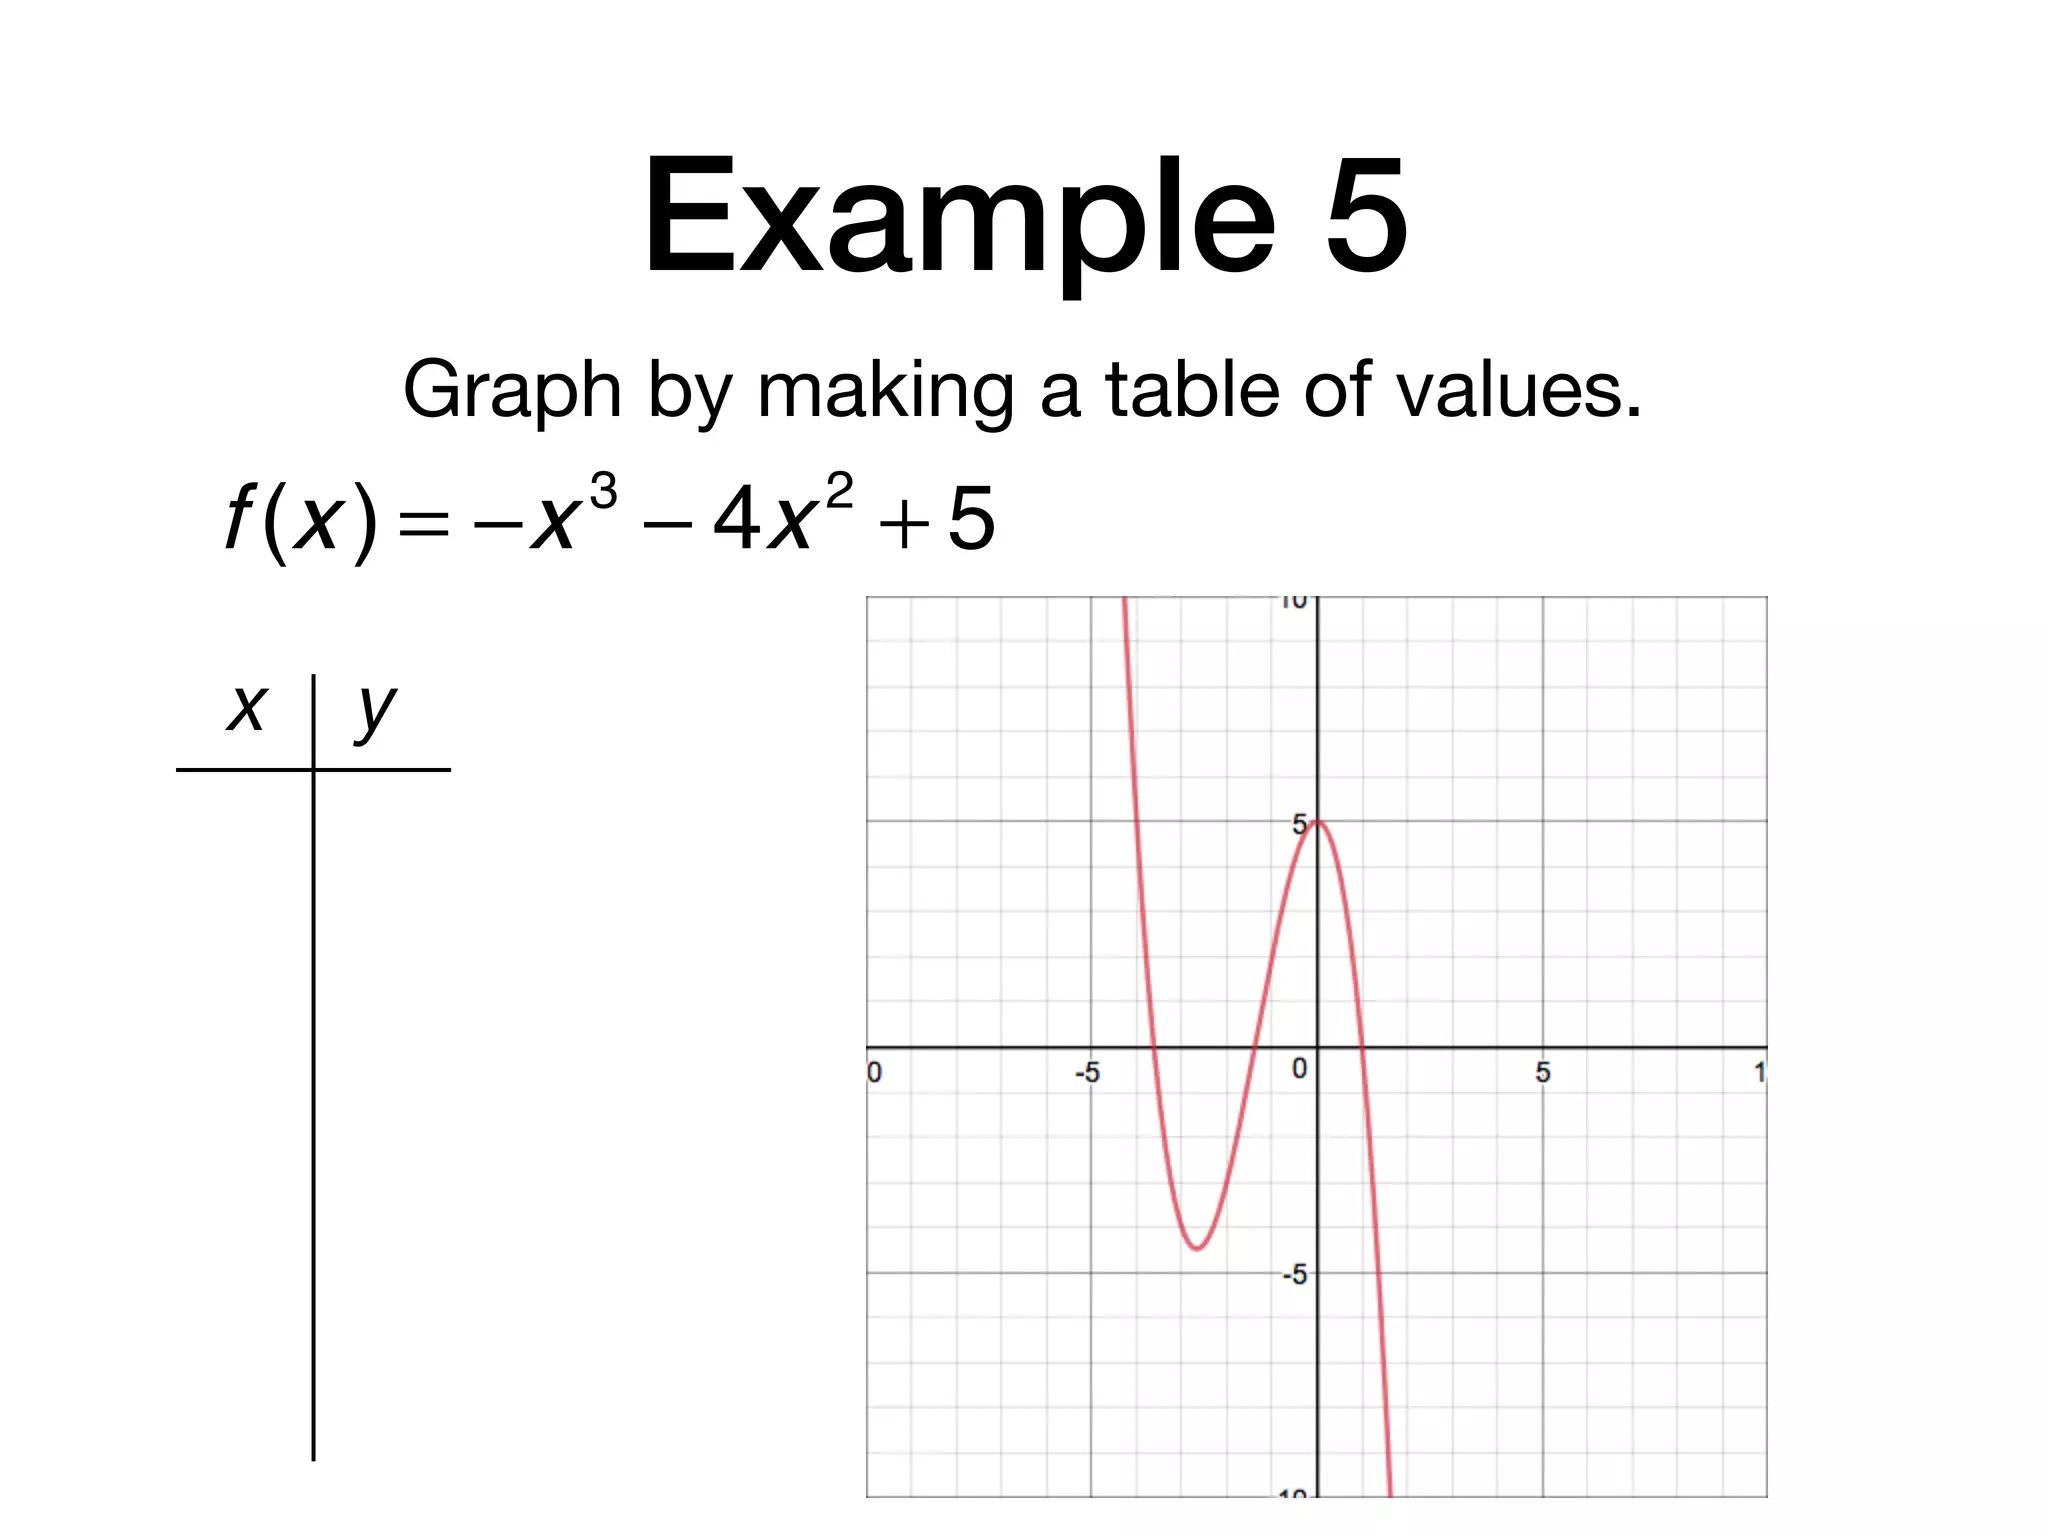
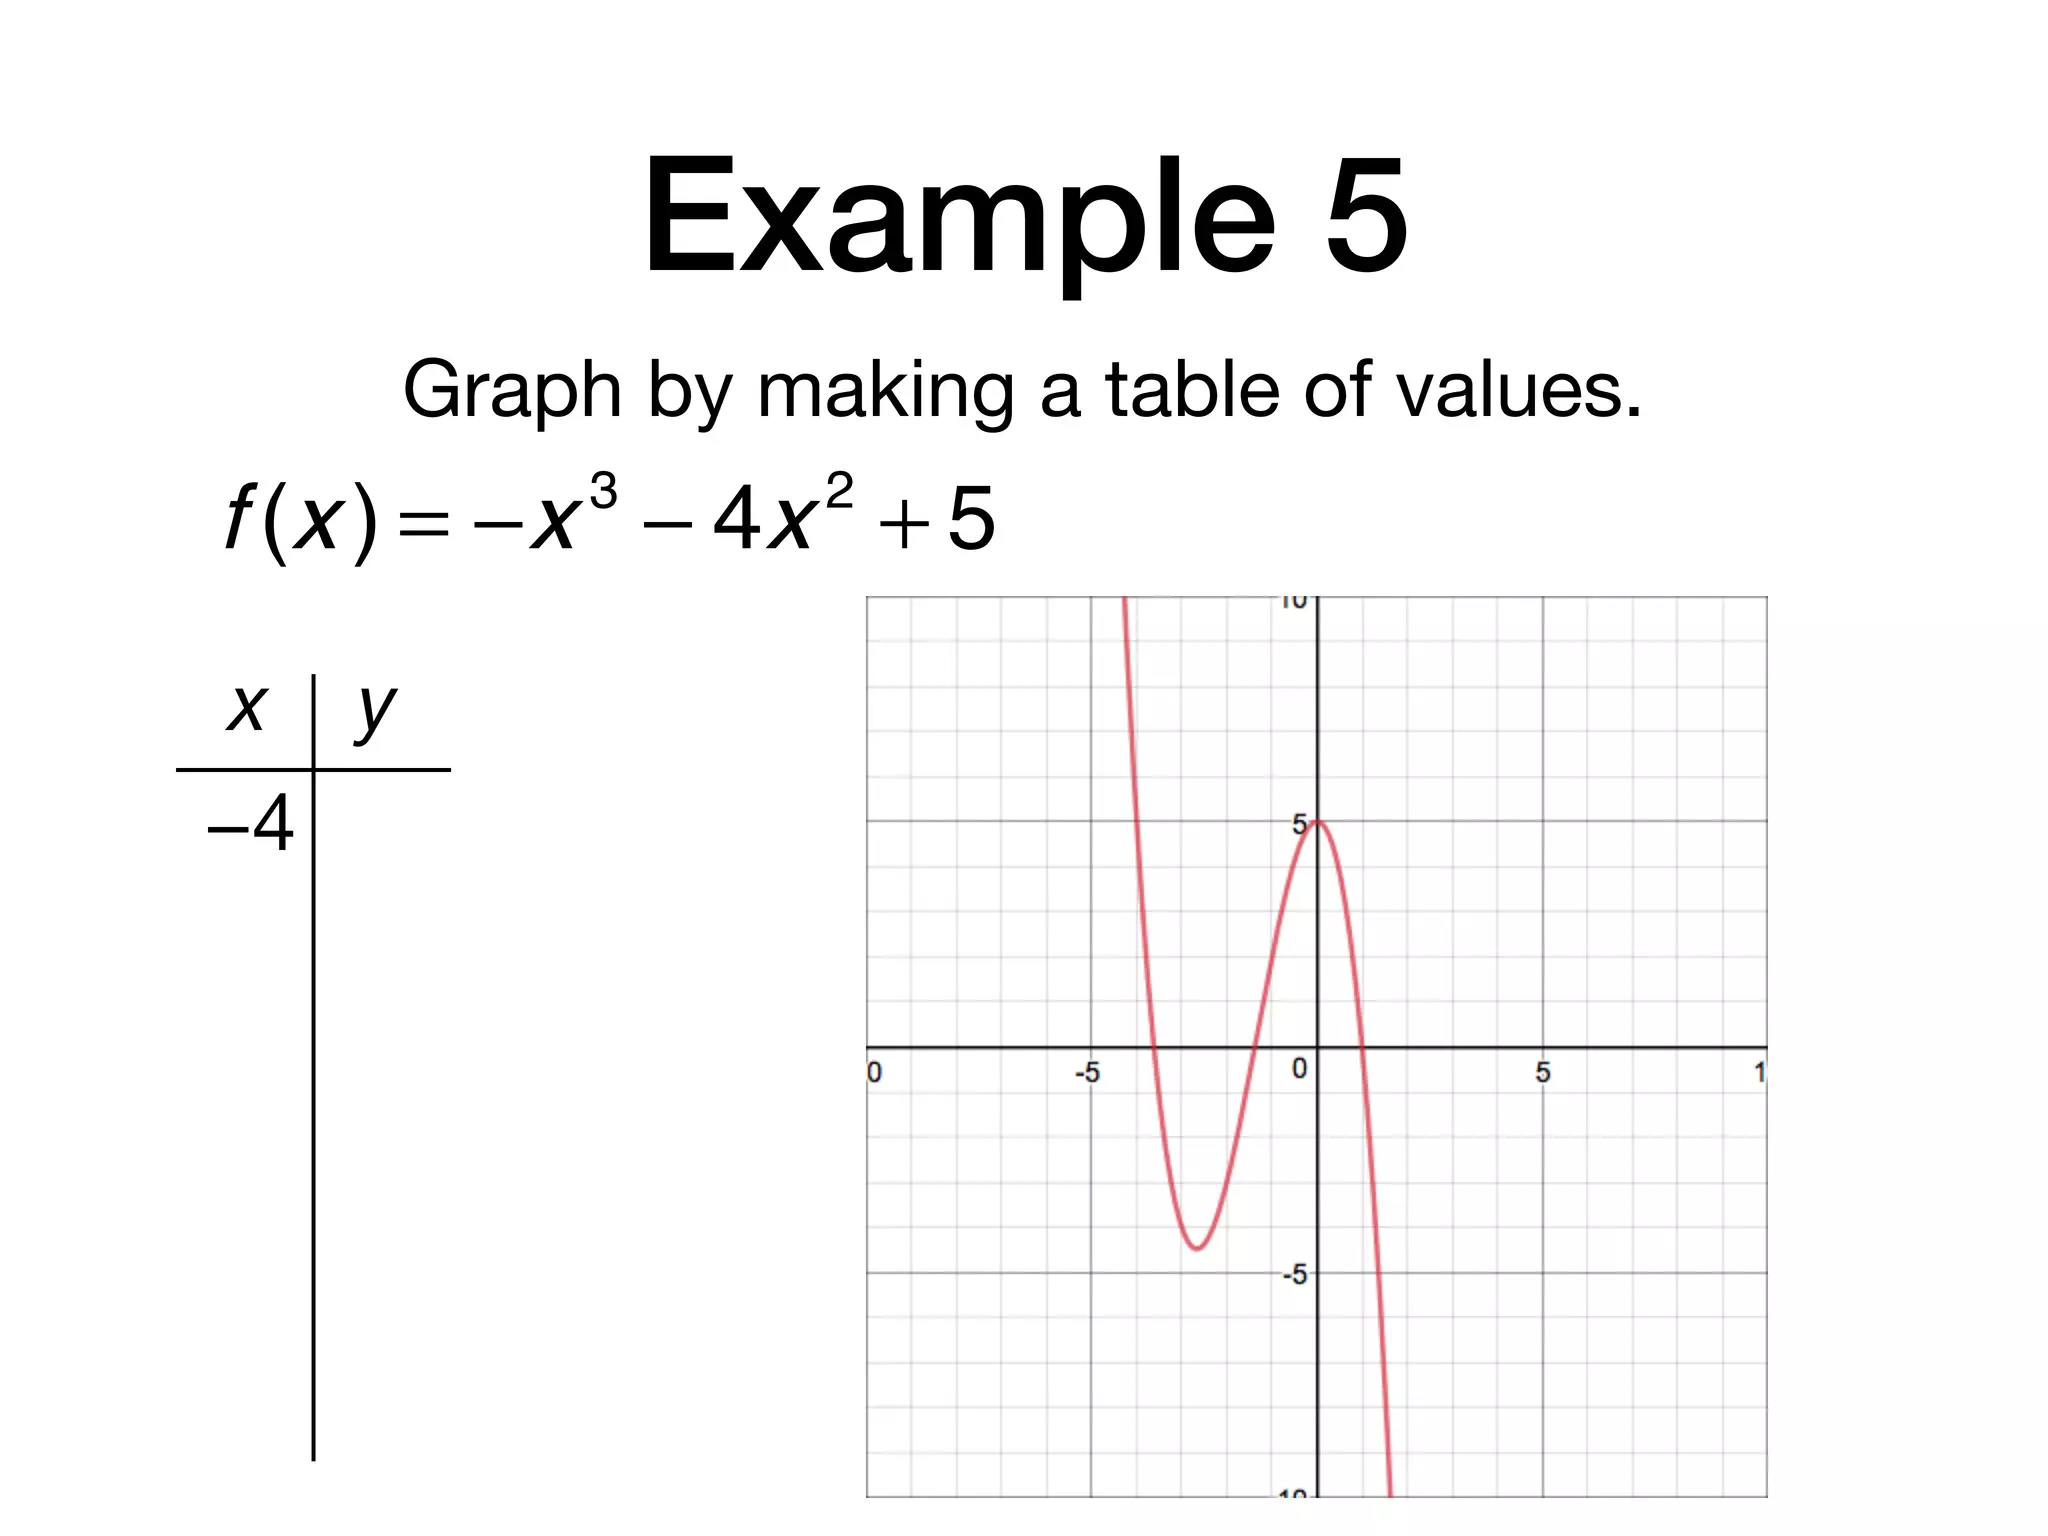
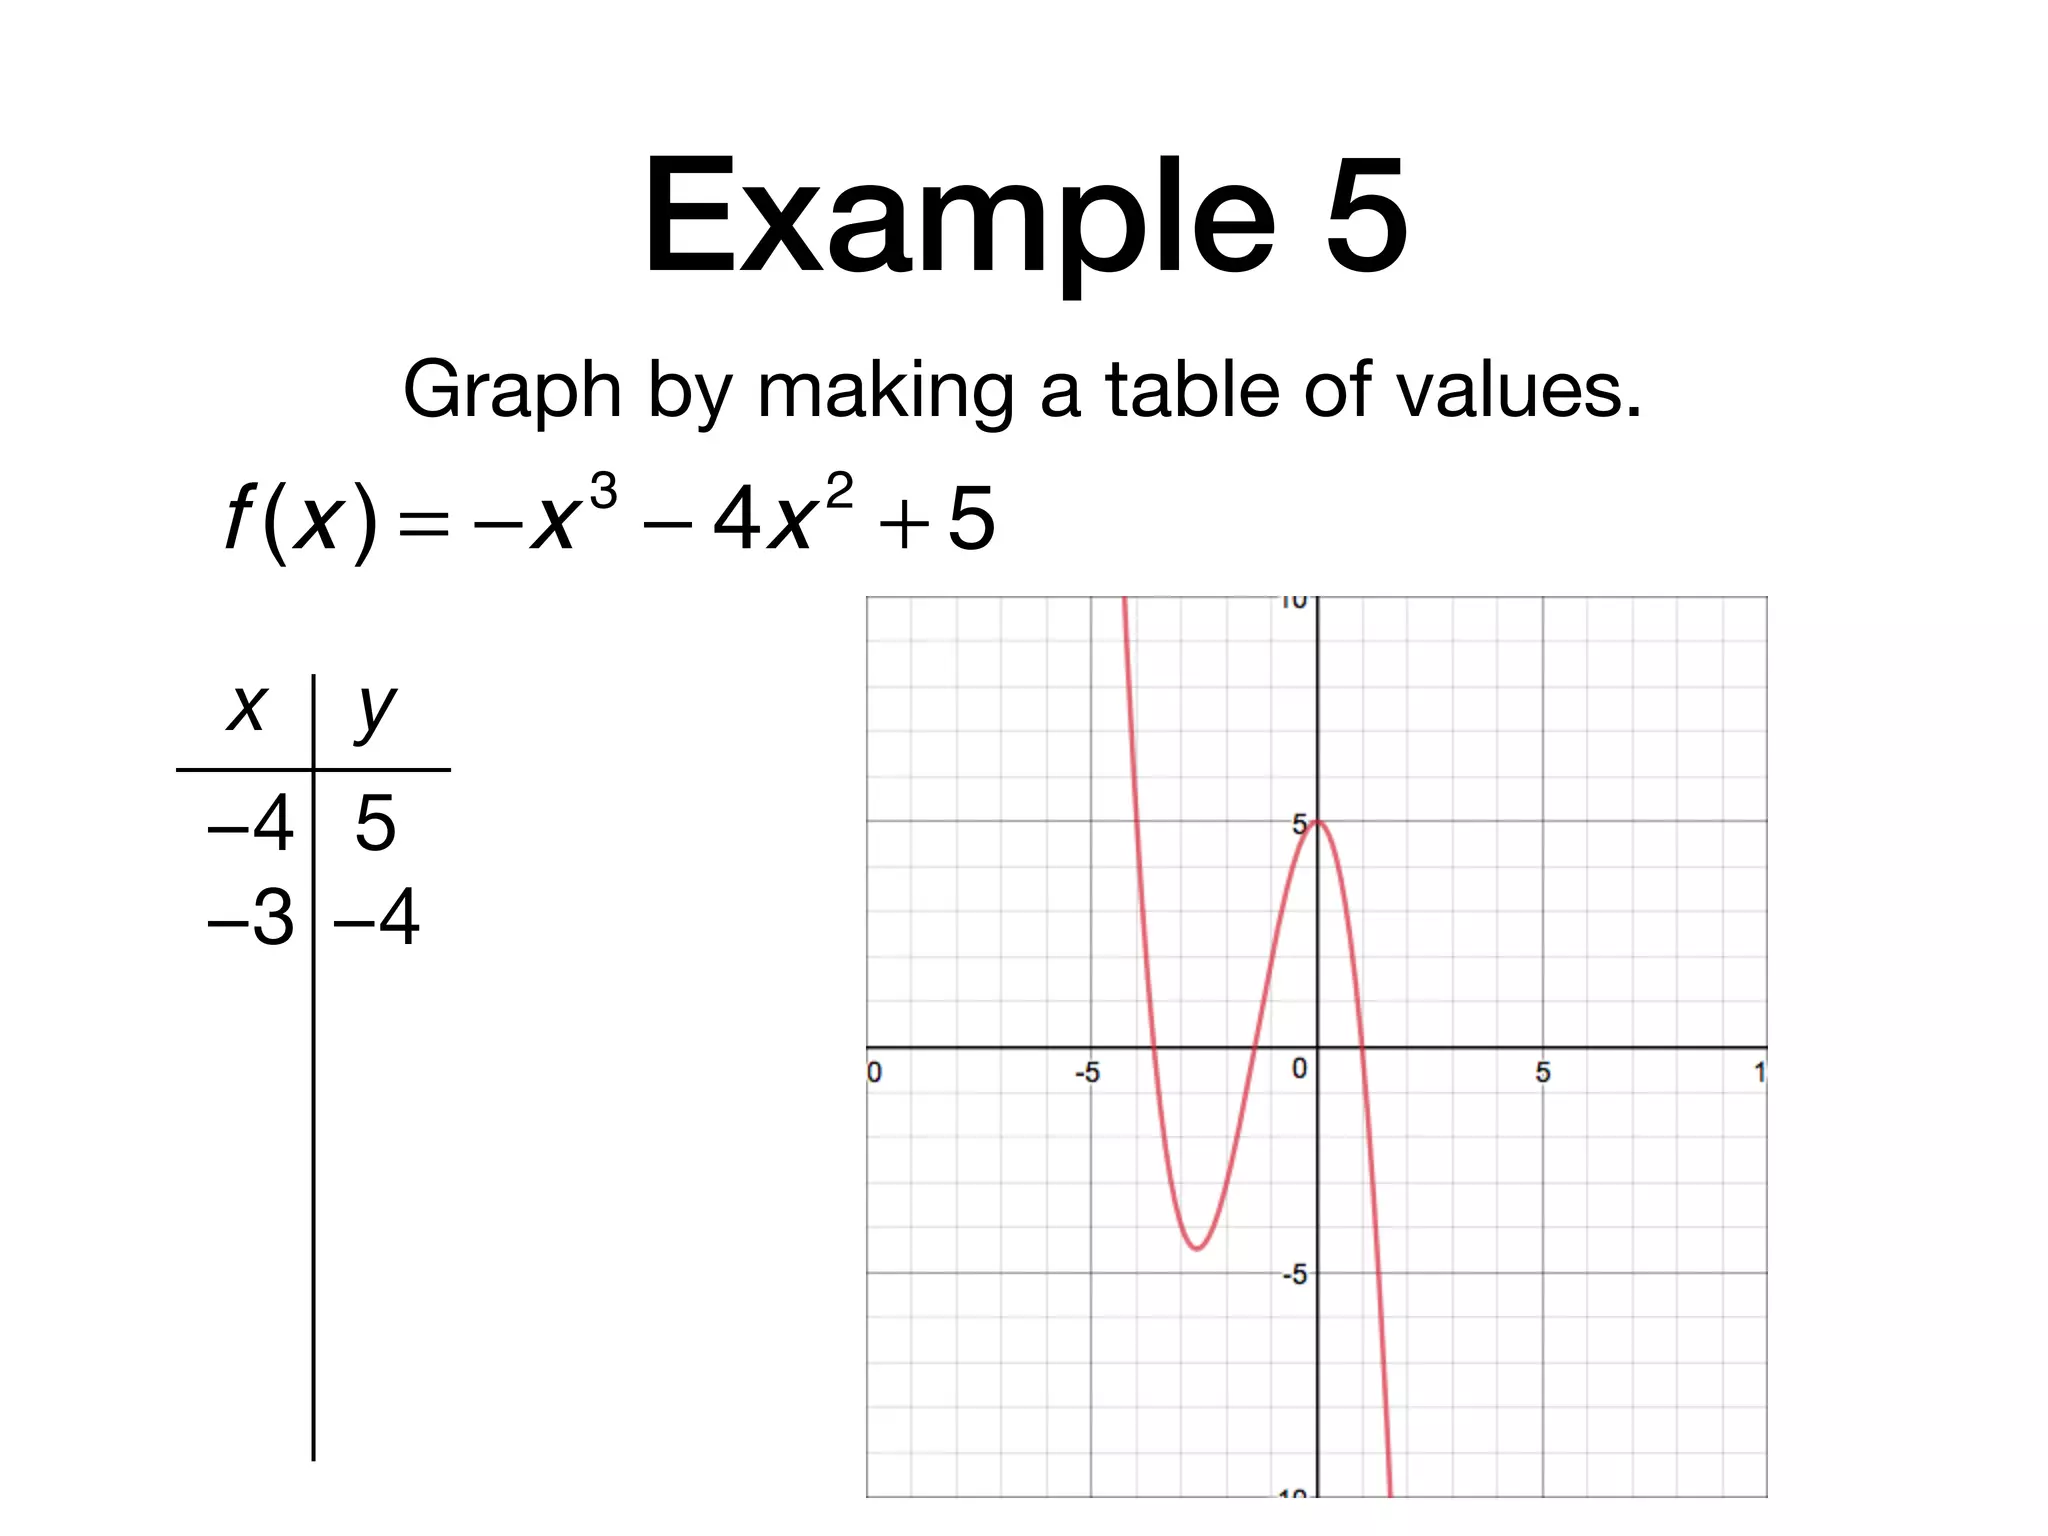
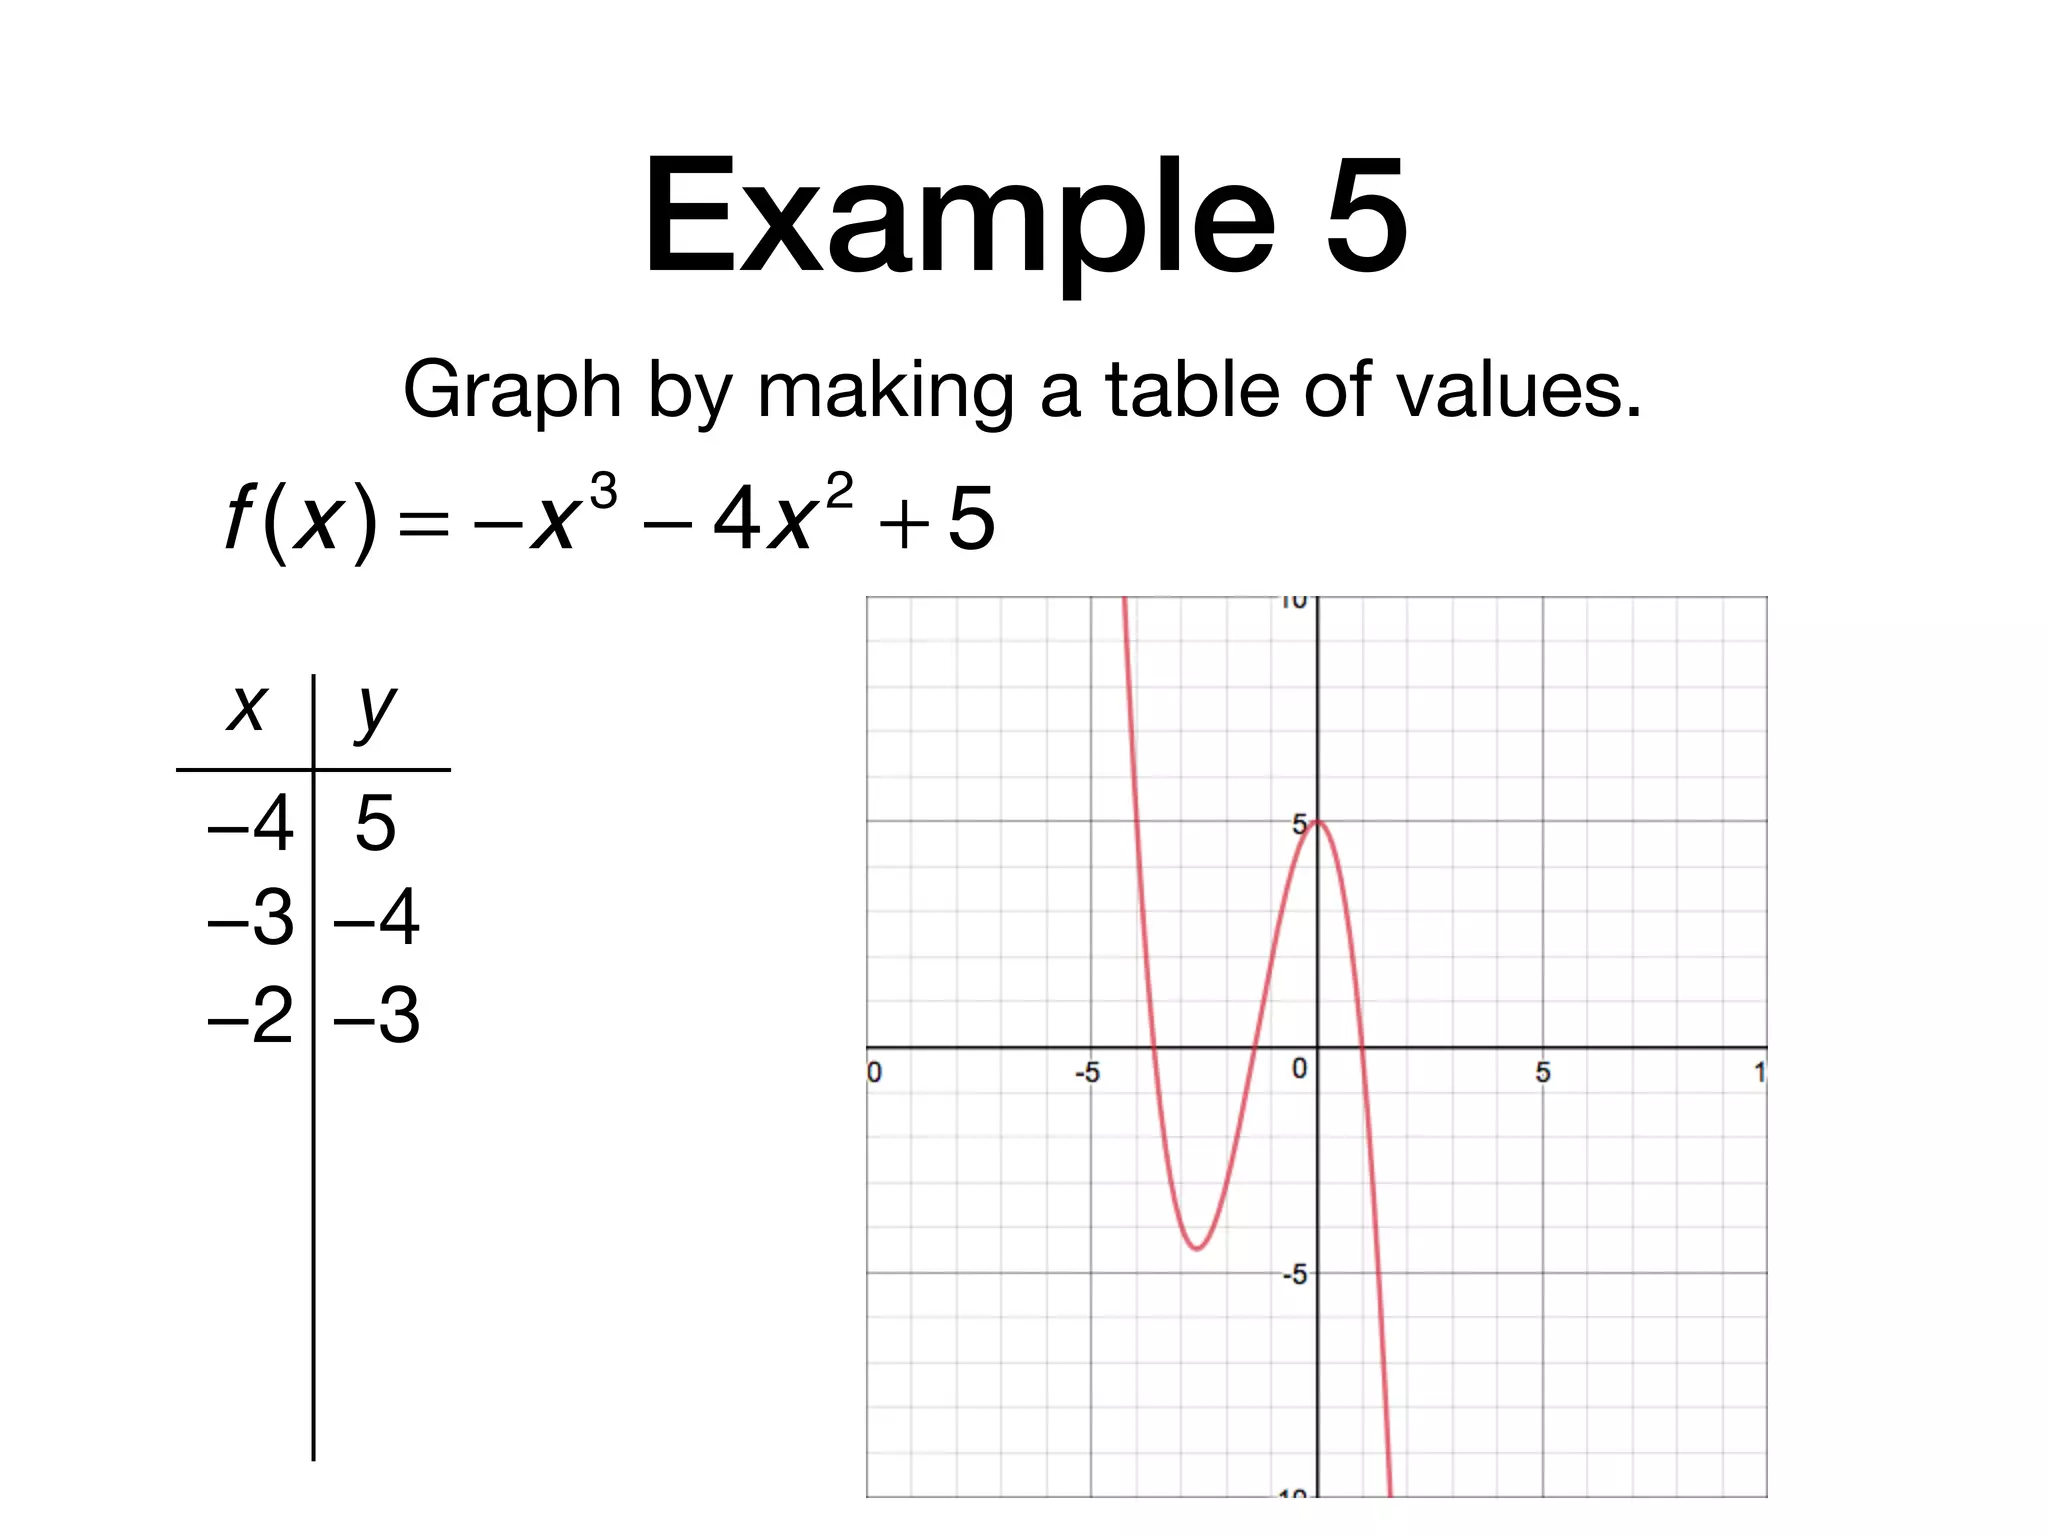
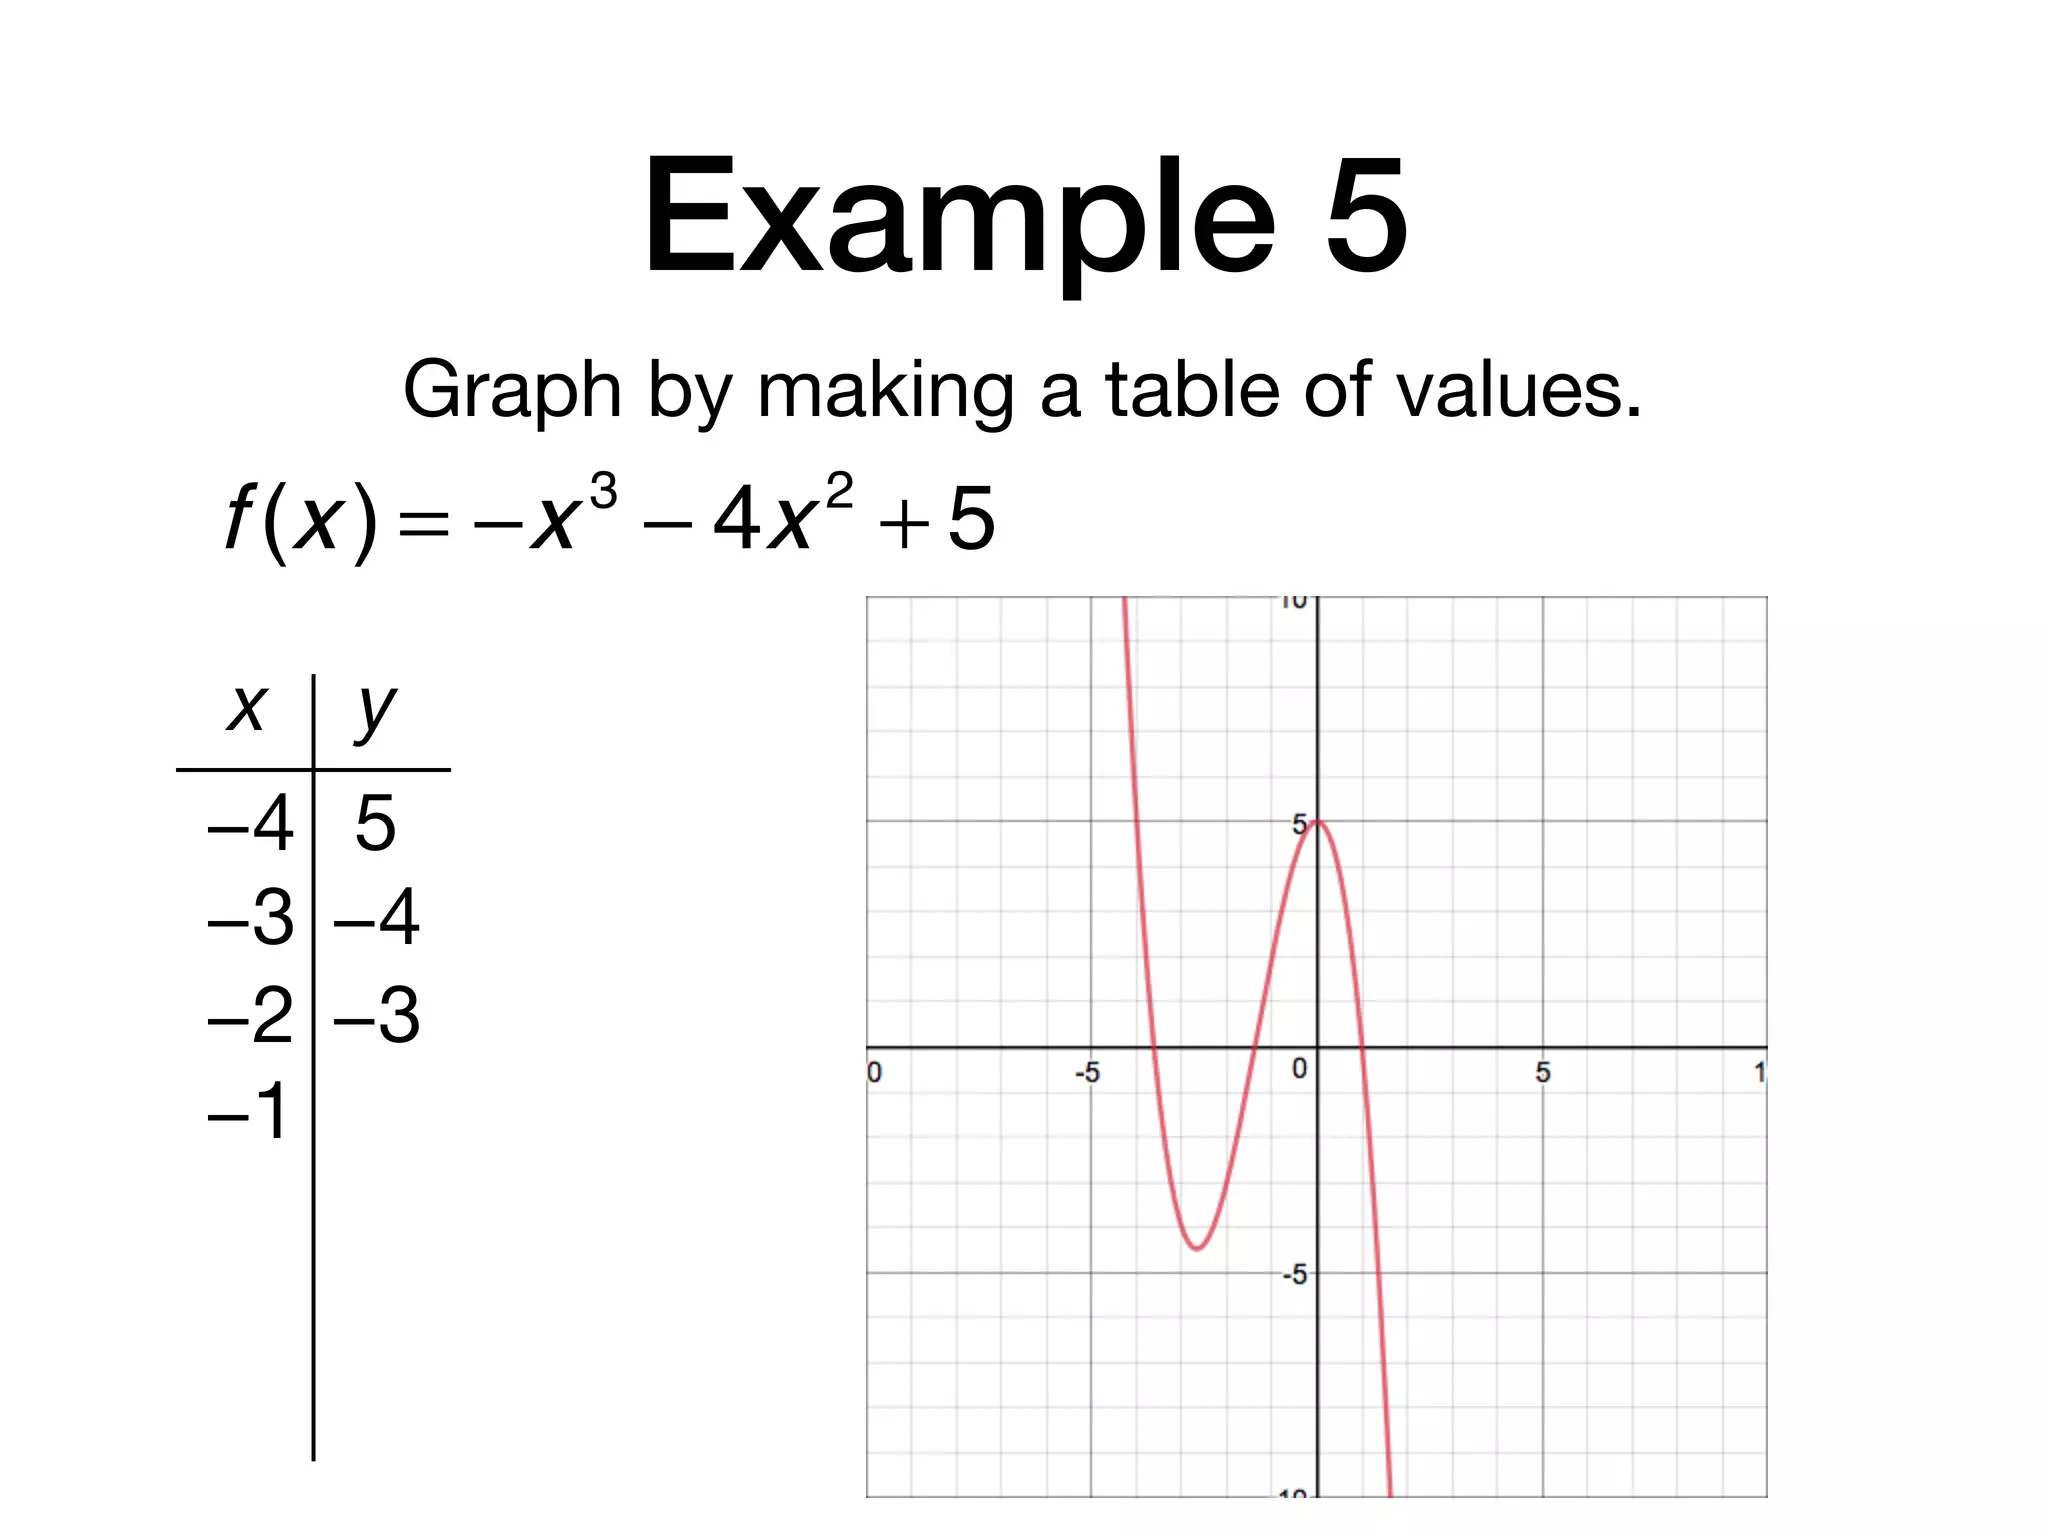
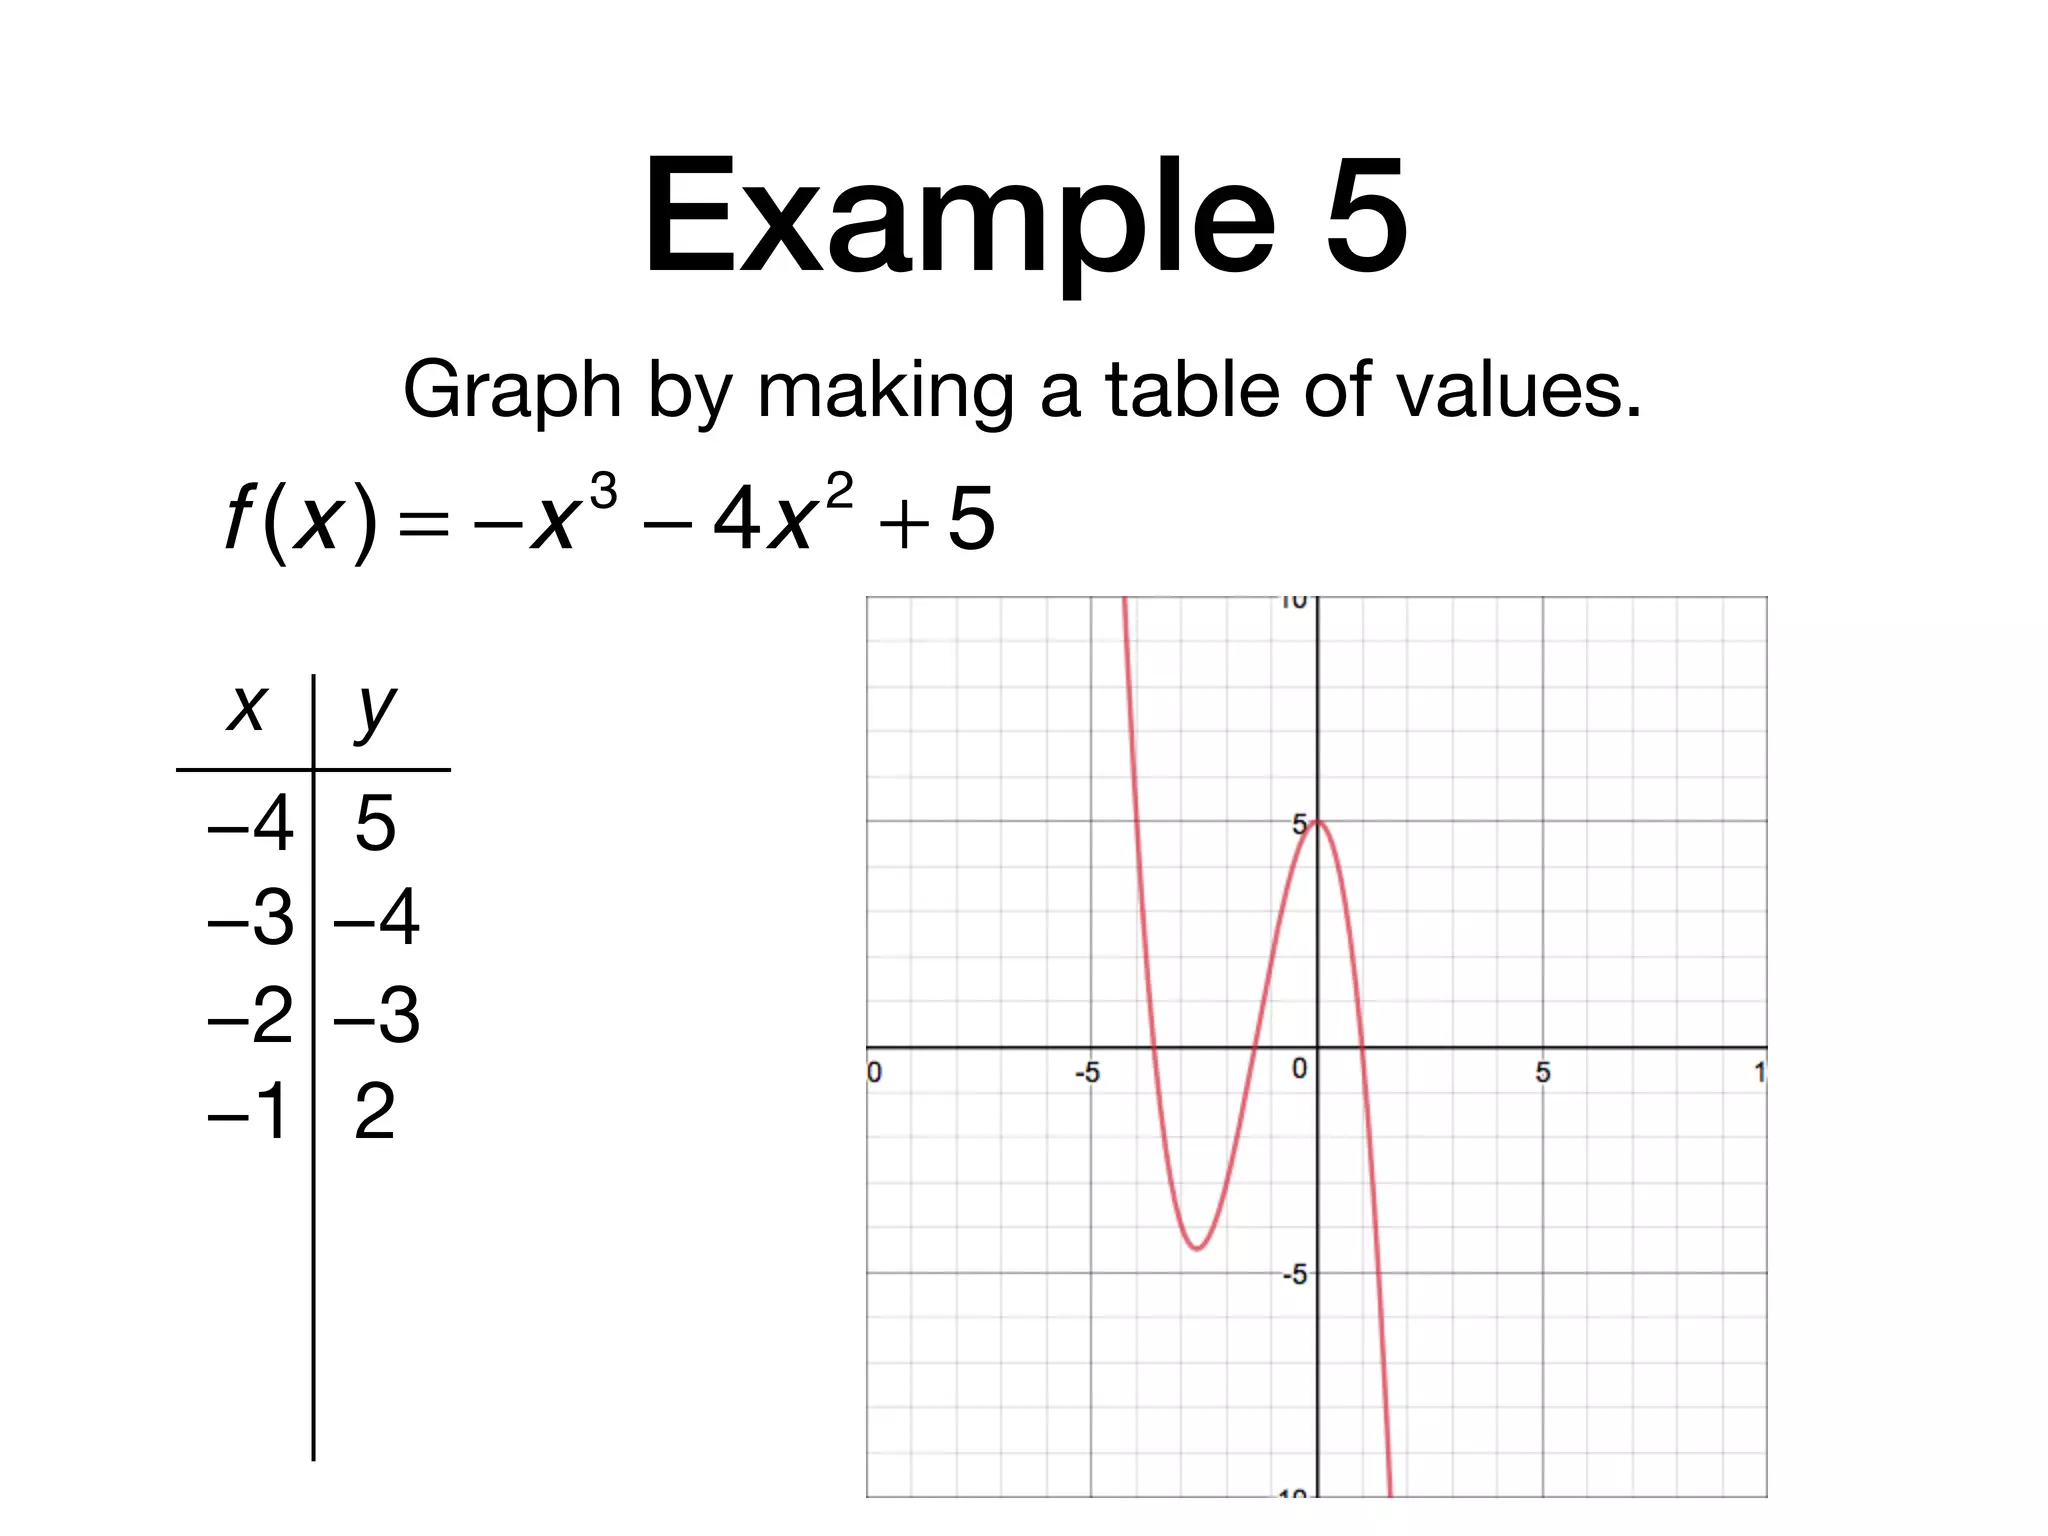
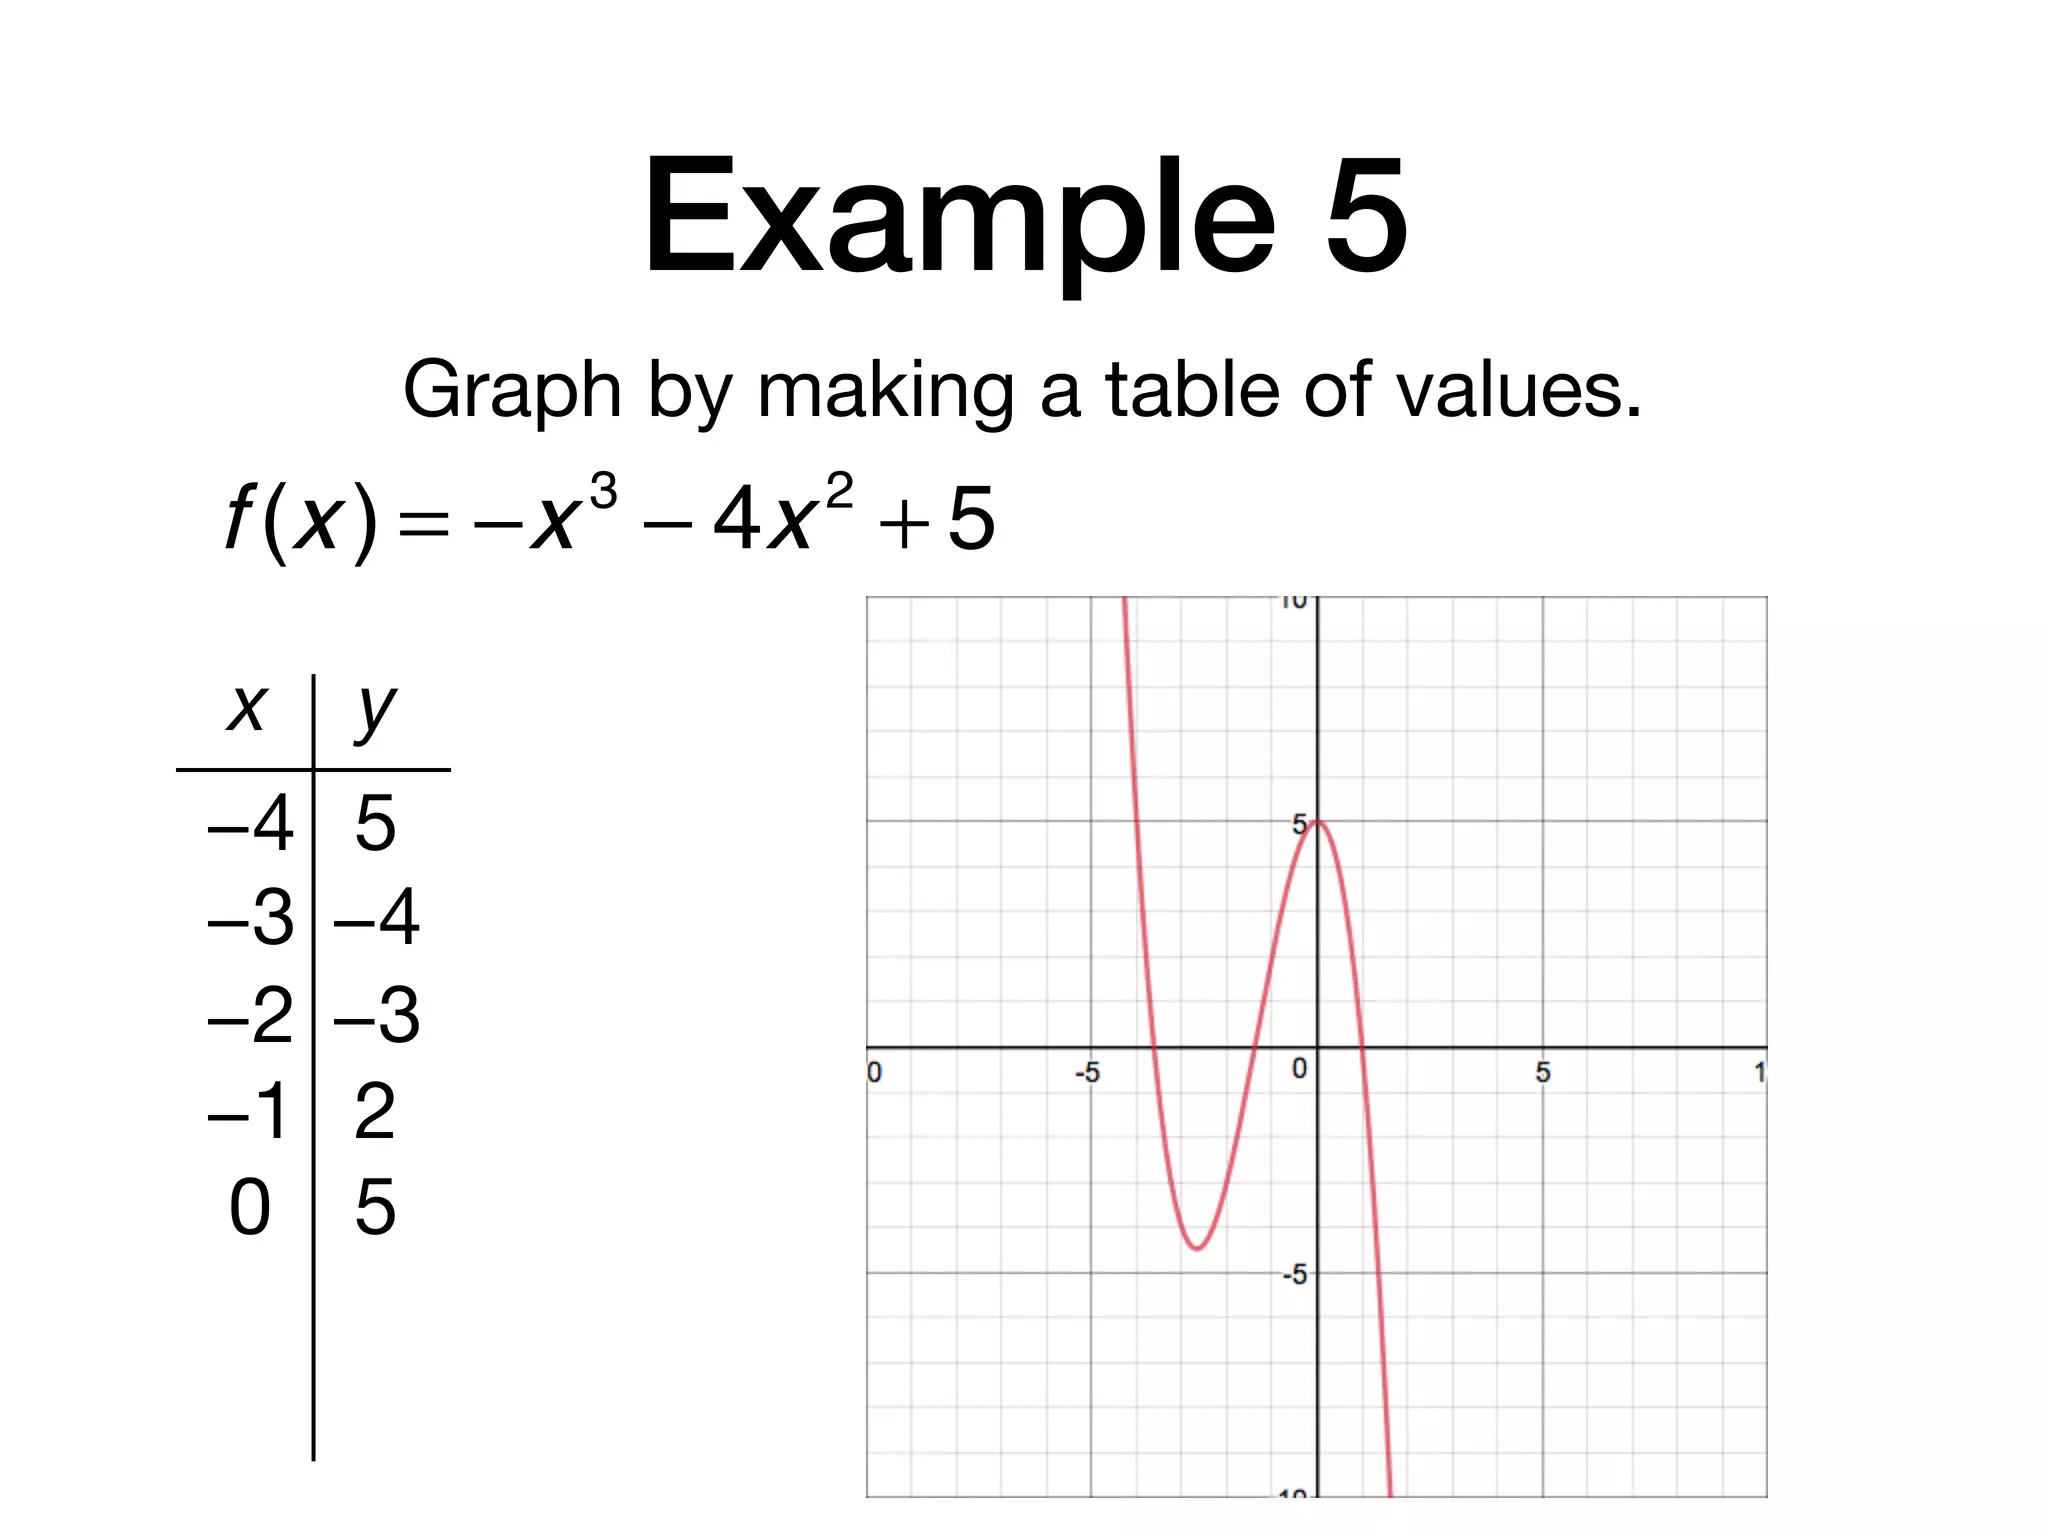
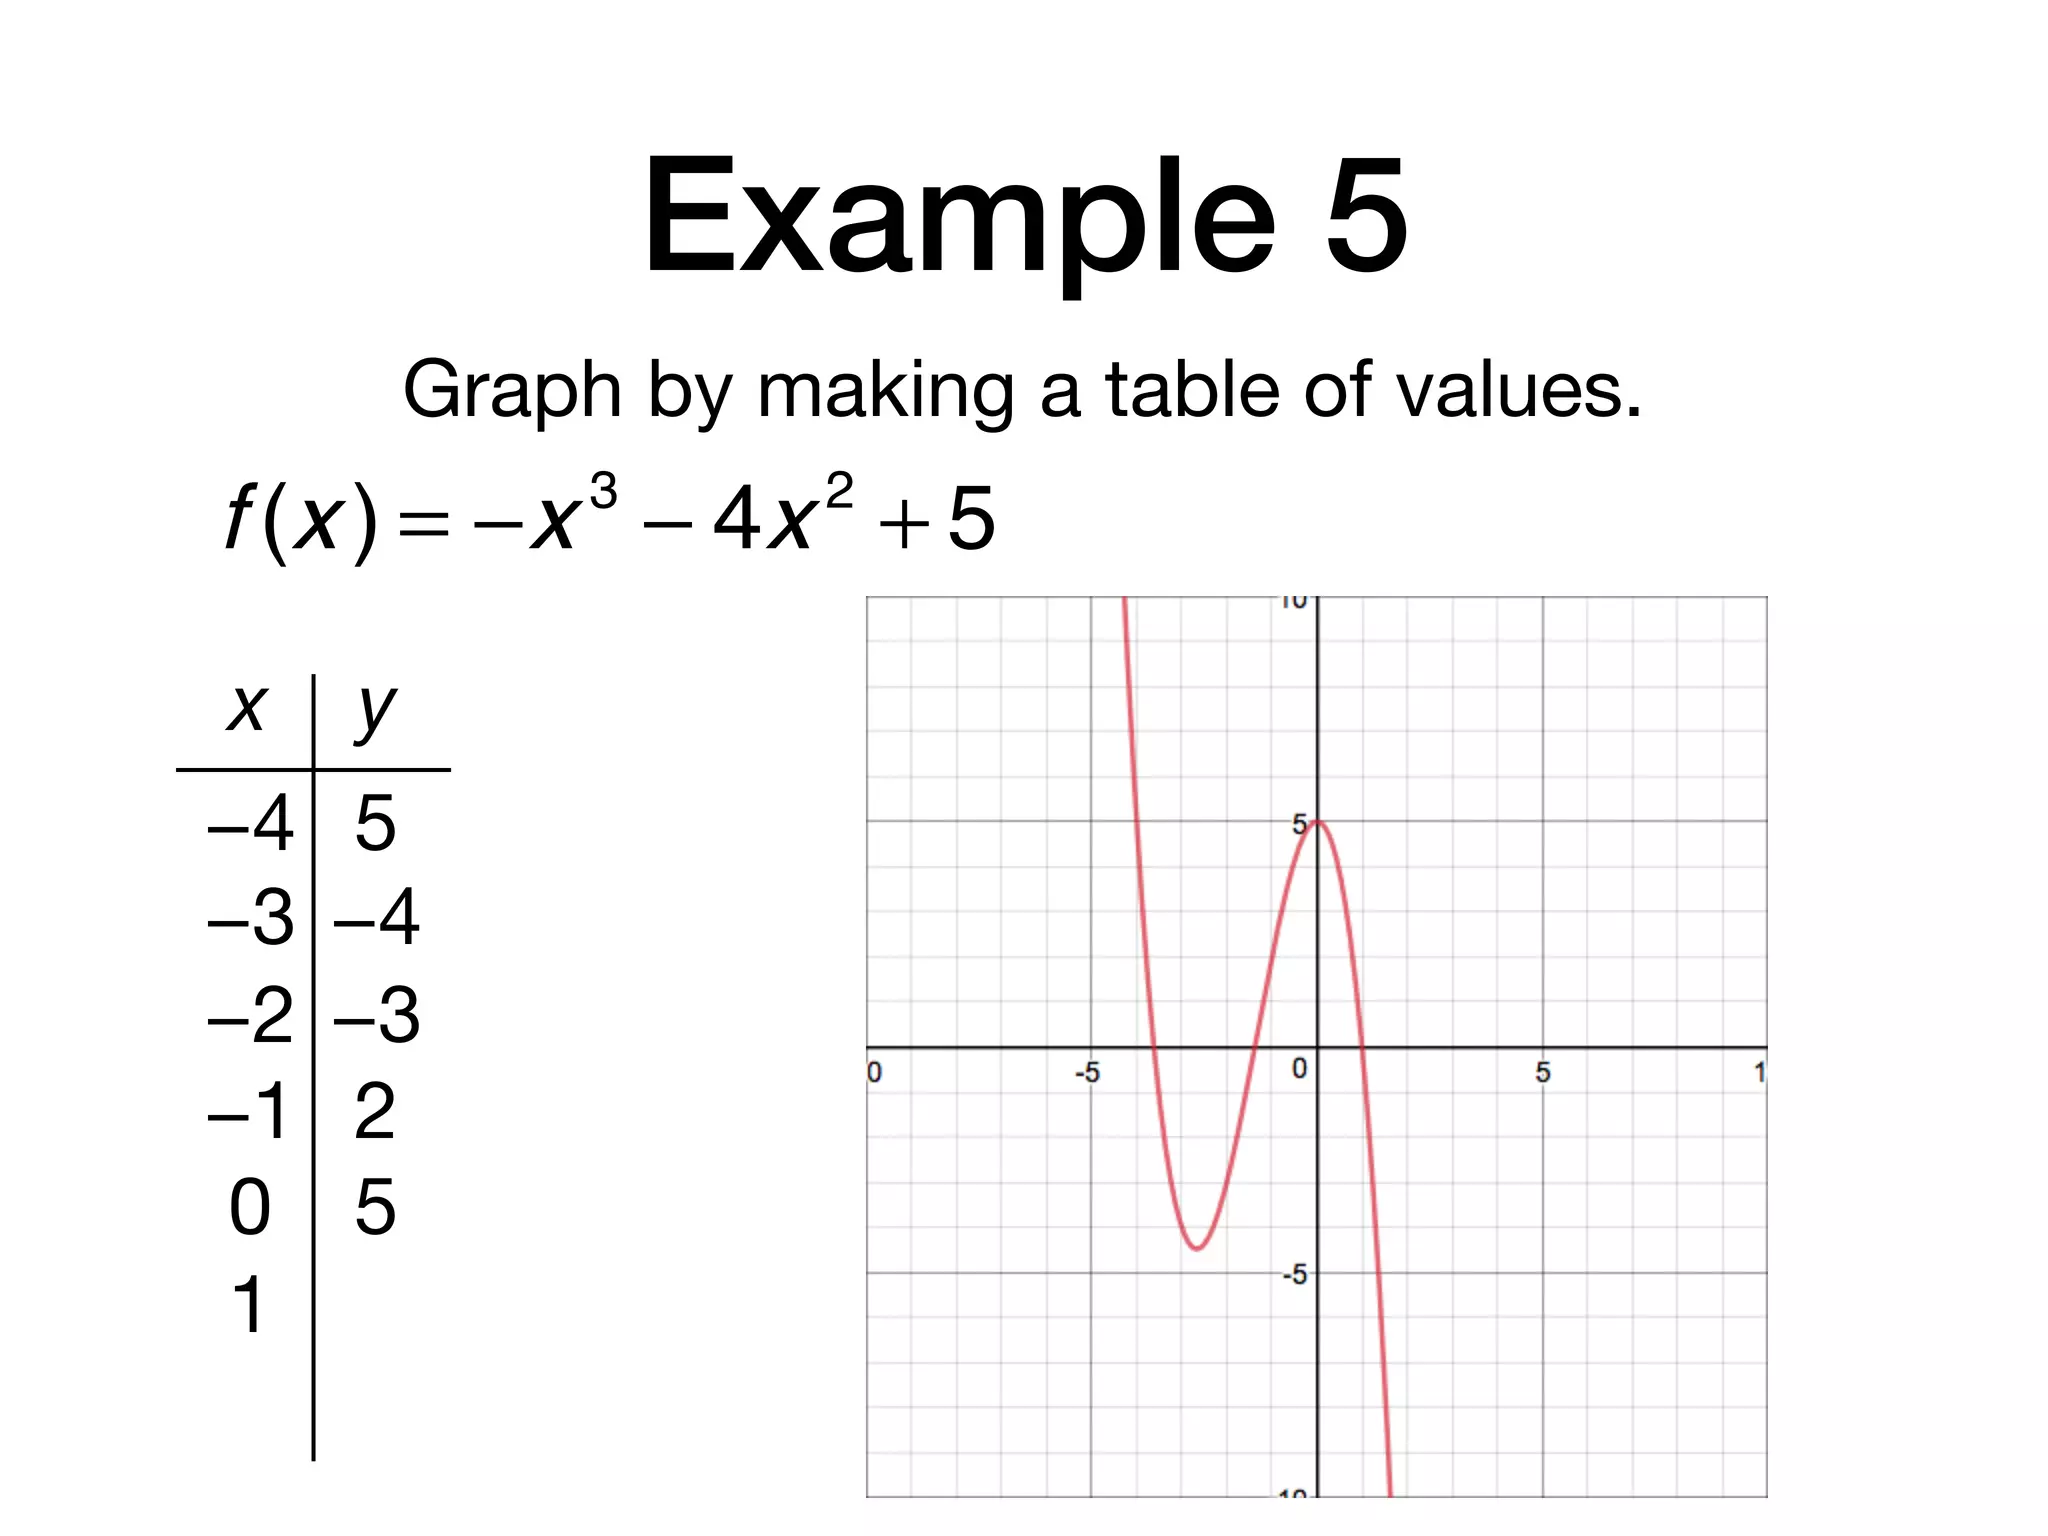
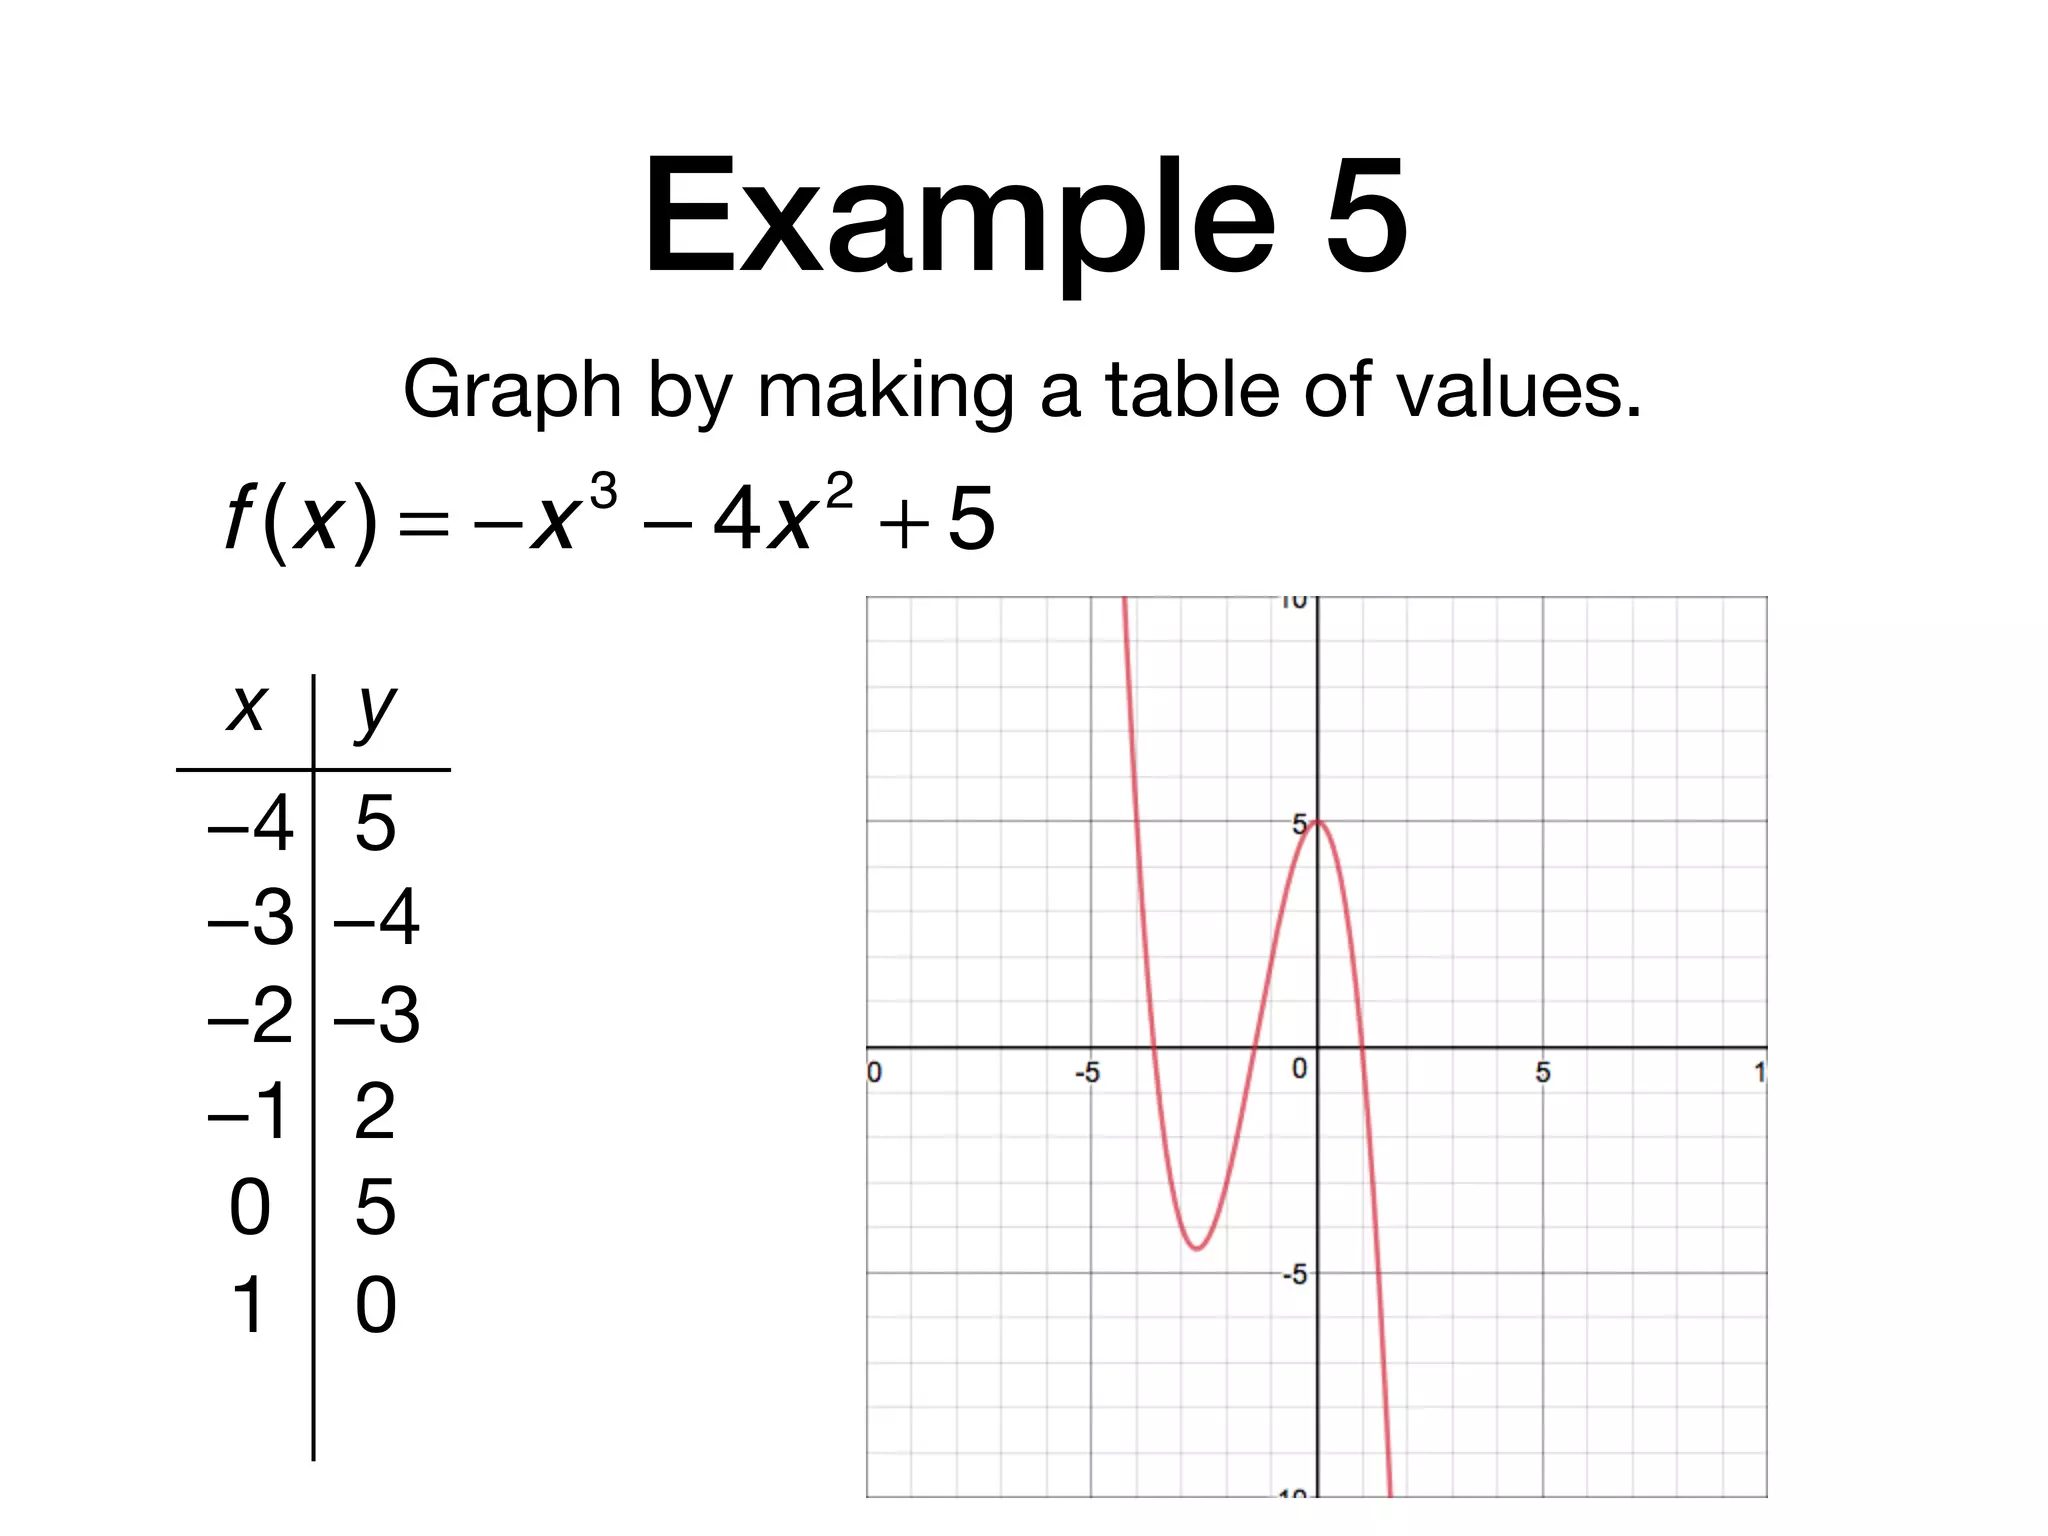
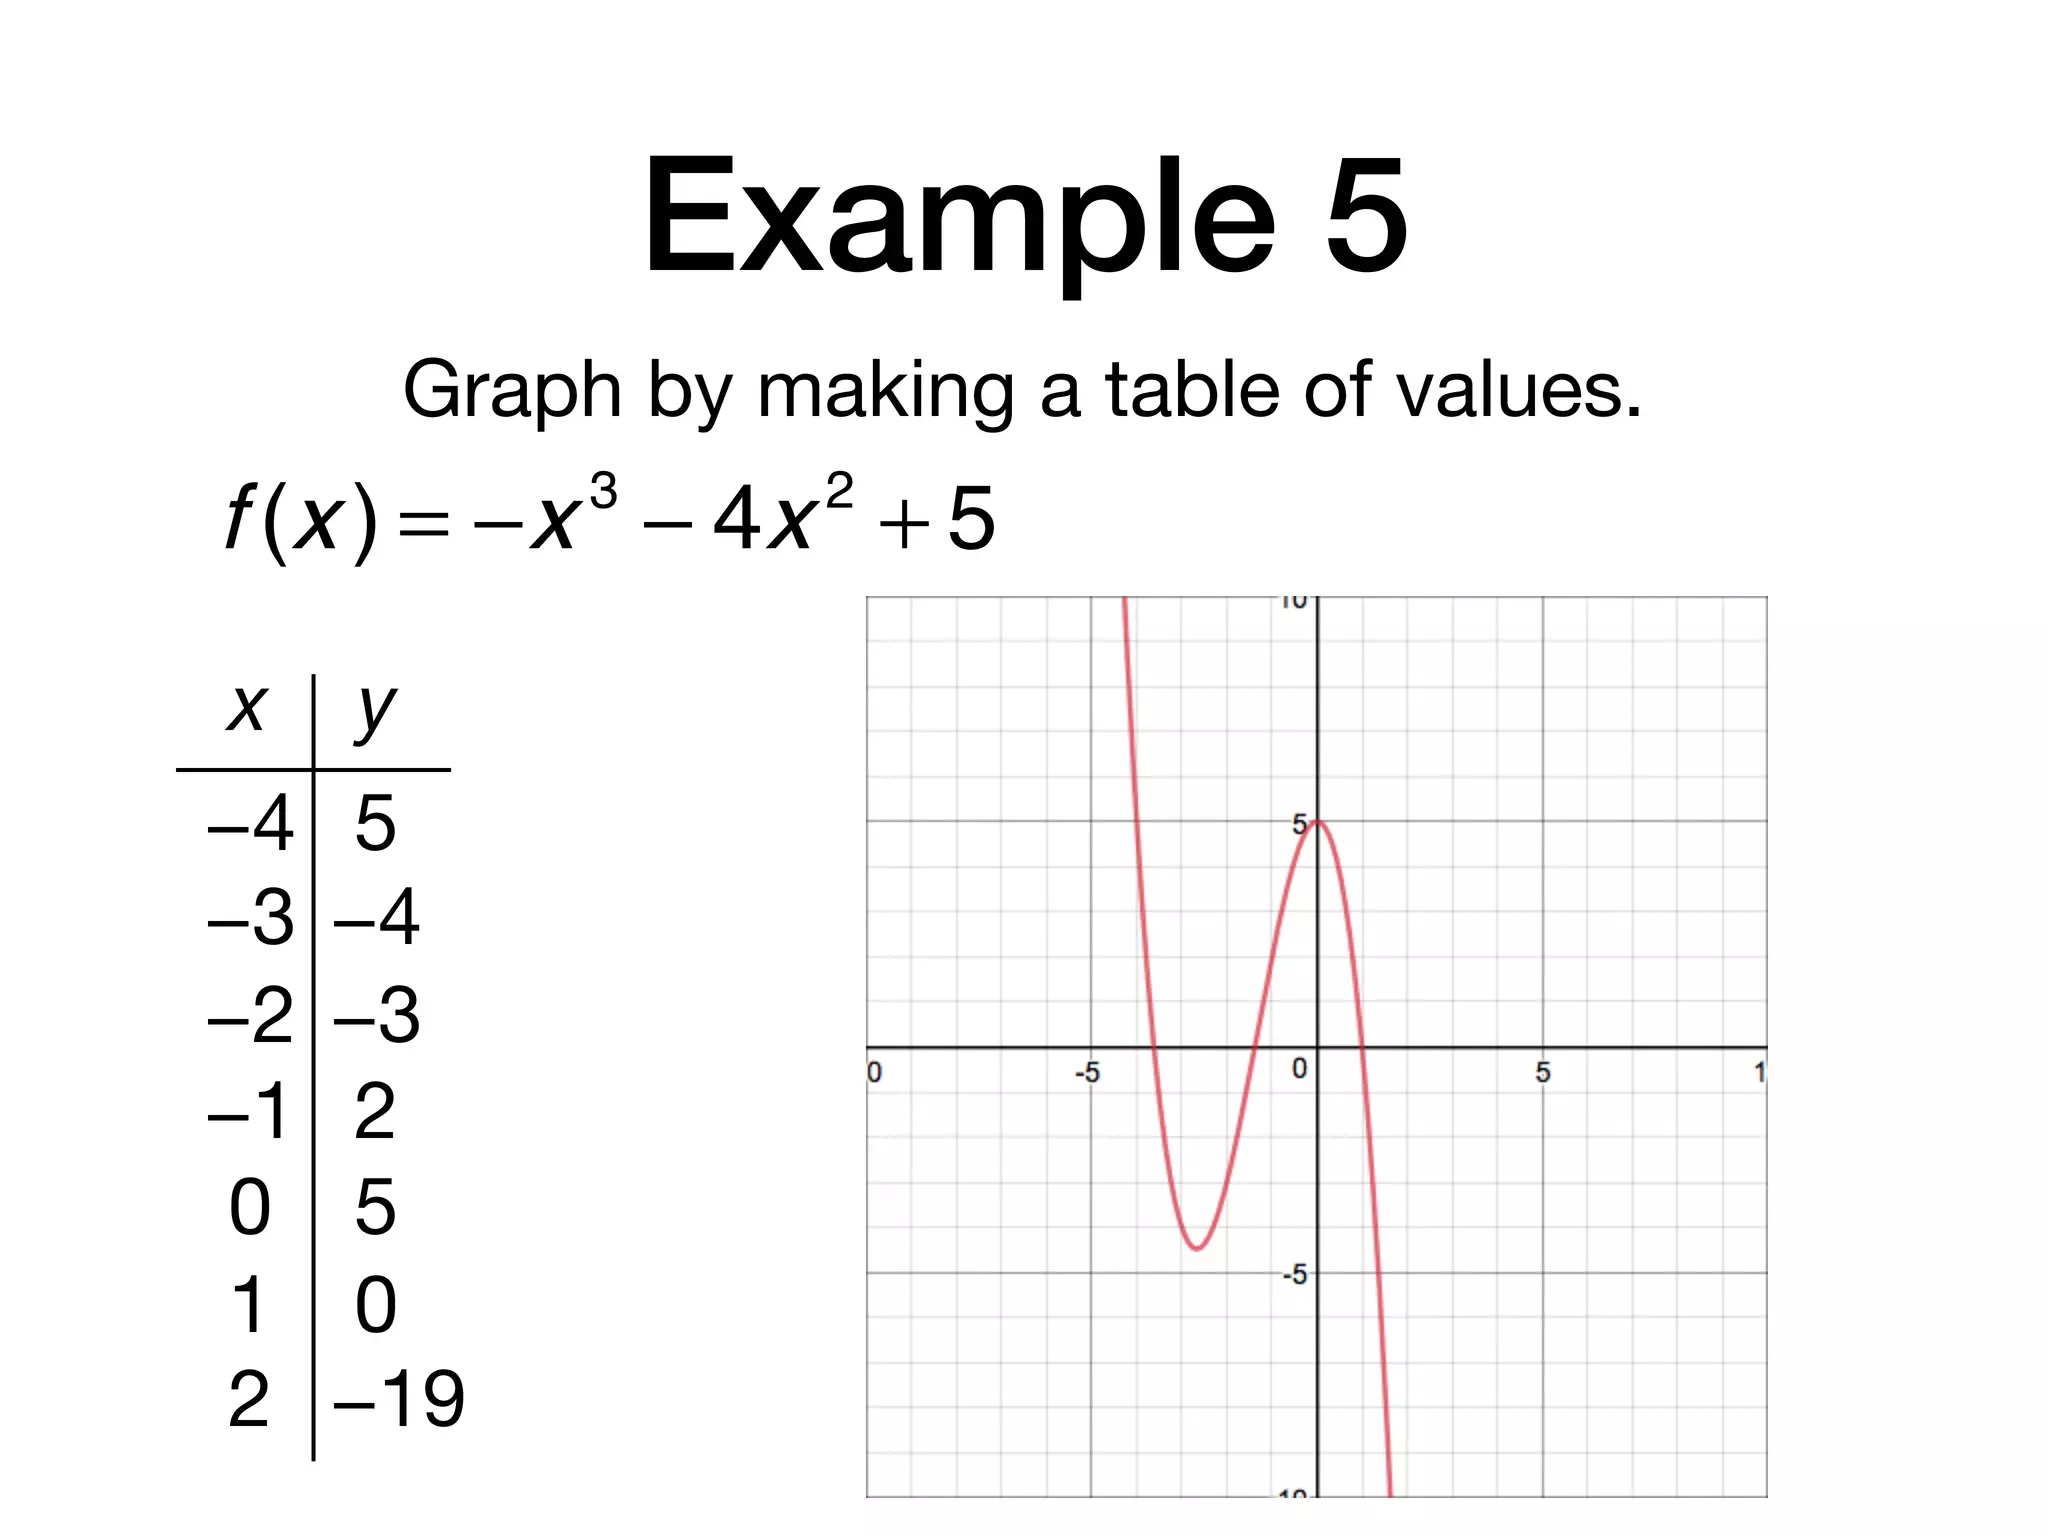
Section 4-4
Graphing Polynomial Functions
Essential Questions
• How do you evaluate polynomial functions?

• How do you identify general shapes of graphs of
polynomial functions?
Vocabulary
1. Polynomial in One Variable:
2. Leading Coefficient:
3. Polynomial Function:
Vocabulary
1. Polynomial in One Variable: An expression
with only one variable with varying
exponents and real number coefficients
2. Leading Coefficient:
3. Polynomial Function:
Vocabulary
1. Polynomial in One Variable: An expression
with only one variable with varying
exponents and real number coefficients
2. Leading Coefficient: The coefficient of the first
term of a polynomial written in standard
form
3. Polynomial Function:
Vocabulary
1. Polynomial in One Variable: An expression
with only one variable with varying
exponents and real number coefficients
2. Leading Coefficient: The coefficient of the first
term of a polynomial written in standard
form
3. Polynomial Function: A continuous function
that can described by a polynomial in one
variable
Vocabulary
4. Power Function:
5. Quartic Function:
6. Quintic Function:
Vocabulary
4. Power Function: The simplest versions of
polynomial functions of the form
5. Quartic Function:
6. Quintic Function:
Vocabulary
4. Power Function: The simplest versions of
polynomial functions of the form
5. Quartic Function:
6. Quintic Function:
f (x ) = axb
, where a and b are nonzero real
numbers
Vocabulary
4. Power Function: The simplest versions of
polynomial functions of the form
5. Quartic Function: A power function with a
degree of 4
6. Quintic Function:
f (x ) = axb
, where a and b are nonzero real
numbers
Vocabulary
4. Power Function: The simplest versions of
polynomial functions of the form
5. Quartic Function: A power function with a
degree of 4
6. Quintic Function: A power function with a
degree of 5
f (x ) = axb
, where a and b are nonzero real
numbers
Power Functions
Constant Function
Power Functions
Constant Function
Degree: 0
Power Functions
Constant Function
Degree: 0
Power Functions
Linear Function
Power Functions
Linear Function
Degree: 1
Power Functions
Linear Function
Degree: 1
Power Functions
Quadratic Function
Power Functions
Quadratic Function
Degree: 2
Power Functions
Quadratic Function
Degree: 2
Power Functions
Cubic Function
Power Functions
Cubic Function
Degree: 3
Power Functions
Cubic Function
Degree: 3
Power Functions
Quartic Function
Power Functions
Quartic Function
Degree: 4
Power Functions
Quartic Function
Degree: 4
Power Functions
Quintic Function
Power Functions
Quintic Function
Degree: 5
Power Functions
Quintic Function
Degree: 5
Example 1
State the degree and leading coefficient of each
polynomial in one variable. If it is not a
polynomial in one variable, explain why.
a. 7z3
− 4z2
+ z
Example 1
State the degree and leading coefficient of each
polynomial in one variable. If it is not a
polynomial in one variable, explain why.
a. 7z3
− 4z2
+ z
Degree: 3
Example 1
State the degree and leading coefficient of each
polynomial in one variable. If it is not a
polynomial in one variable, explain why.
a. 7z3
− 4z2
+ z
Degree: 3
Leading Coefficient: 7
Example 1
State the degree and leading coefficient of each
polynomial in one variable. If it is not a
polynomial in one variable, explain why.
b. 6a3
− 4a2
+ ab2
Example 1
State the degree and leading coefficient of each
polynomial in one variable. If it is not a
polynomial in one variable, explain why.
b. 6a3
− 4a2
+ ab2
Not a polynomial in one variable; Has a and b
Example 1
State the degree and leading coefficient of each
polynomial in one variable. If it is not a
polynomial in one variable, explain why.
c. 3x5
+ 2x 2
− 4 − 8x 6
Example 1
State the degree and leading coefficient of each
polynomial in one variable. If it is not a
polynomial in one variable, explain why.
c. 3x5
+ 2x 2
− 4 − 8x 6
Degree: 6
Example 1
State the degree and leading coefficient of each
polynomial in one variable. If it is not a
polynomial in one variable, explain why.
c. 3x5
+ 2x 2
− 4 − 8x 6
Degree: 6
Leading Coefficient: −8
Example 2
The volume of the air in the lungs during a 5
second respiratory cycle can be modeled by the
function below, where v is the volume in liters
and t is the time in seconds. Find the volume of
air in the lungs 1.5 seconds into the respiratory
cycle.
v (t) = −0.037t 3
+ 0.152t2
+ 0.173t
Example 2
The volume of the air in the lungs during a 5
second respiratory cycle can be modeled by the
function below, where v is the volume in liters
and t is the time in seconds. Find the volume of
air in the lungs 1.5 seconds into the respiratory
cycle.
v (t) = −0.037t 3
+ 0.152t2
+ 0.173t
v (1.5) = −0.037(1.5)3
+ 0.152(1.5)2
+ 0.173(1.5)
v (1.5) = .476625
Example 2
The volume of the air in the lungs during a 5
second respiratory cycle can be modeled by the
function below, where v is the volume in liters
and t is the time in seconds. Find the volume of
air in the lungs 1.5 seconds into the respiratory
cycle.
v (t) = −0.037t 3
+ 0.152t2
+ 0.173t
v (1.5) = −0.037(1.5)3
+ 0.152(1.5)2
+ 0.173(1.5)
v (1.5) = .476625 liters
Example 3
Find b(m) = 2m2
+ m −1b(2x −1)− 3b(x ) if
Example 3
Find b(m) = 2m2
+ m −1b(2x −1)− 3b(x ) if
b(2x −1) = 2(2x −1)2
+ (2x −1)−1
Example 3
Find b(m) = 2m2
+ m −1b(2x −1)− 3b(x ) if
b(2x −1) = 2(2x −1)2
+ (2x −1)−1
b(2x −1) = 2(4x 2
− 4x +1)+ 2x −1−1
Example 3
Find b(m) = 2m2
+ m −1b(2x −1)− 3b(x ) if
b(2x −1) = 2(2x −1)2
+ (2x −1)−1
b(2x −1) = 2(4x 2
− 4x +1)+ 2x −1−1
b(2x −1) = 8x 2
− 8x + 2 + 2x − 2
Example 3
Find b(m) = 2m2
+ m −1b(2x −1)− 3b(x ) if
b(2x −1) = 2(2x −1)2
+ (2x −1)−1
b(2x −1) = 2(4x 2
− 4x +1)+ 2x −1−1
b(2x −1) = 8x 2
− 8x + 2 + 2x − 2
b(2x −1) = 8x 2
− 6x
Example 3
Find b(m) = 2m2
+ m −1b(2x −1)− 3b(x ) if
b(2x −1) = 2(2x −1)2
+ (2x −1)−1
b(2x −1) = 2(4x 2
− 4x +1)+ 2x −1−1
b(2x −1) = 8x 2
− 8x + 2 + 2x − 2
b(2x −1) = 8x 2
− 6x
3b(x ) = 3(2x 2
+ x −1)
Example 3
Find b(m) = 2m2
+ m −1b(2x −1)− 3b(x ) if
b(2x −1) = 2(2x −1)2
+ (2x −1)−1
b(2x −1) = 2(4x 2
− 4x +1)+ 2x −1−1
b(2x −1) = 8x 2
− 8x + 2 + 2x − 2
b(2x −1) = 8x 2
− 6x
3b(x ) = 3(2x 2
+ x −1)
3b(x ) = 6x 2
+ 3x − 3
Example 3
Find b(m) = 2m2
+ m −1b(2x −1)− 3b(x ) if
b(2x −1) = 8x 2
− 6x 3b(x ) = 6x 2
+ 3x − 3
Example 3
Find b(m) = 2m2
+ m −1b(2x −1)− 3b(x ) if
b(2x −1) = 8x 2
− 6x 3b(x ) = 6x 2
+ 3x − 3
b(2x −1)− 3b(x ) = 8x 2
− 6x − (6x 2
+ 3x − 3)
Example 3
Find b(m) = 2m2
+ m −1b(2x −1)− 3b(x ) if
b(2x −1) = 8x 2
− 6x 3b(x ) = 6x 2
+ 3x − 3
b(2x −1)− 3b(x ) = 8x 2
− 6x − (6x 2
+ 3x − 3)
b(2x −1)− 3b(x ) = 8x 2
− 6x − 6x 2
− 3x + 3
Example 3
Find b(m) = 2m2
+ m −1b(2x −1)− 3b(x ) if
b(2x −1) = 8x 2
− 6x 3b(x ) = 6x 2
+ 3x − 3
b(2x −1)− 3b(x ) = 8x 2
− 6x − (6x 2
+ 3x − 3)
b(2x −1)− 3b(x ) = 8x 2
− 6x − 6x 2
− 3x + 3
b(2x −1)− 3b(x ) = 2x 2
− 9x + 3
Example 4
For each graph, describe the end behavior,
determine whether it represents an odd degree
or an even degree polynomial function, and
state the number of real zeros.
a.
Example 4
For each graph, describe the end behavior,
determine whether it represents an odd degree
or an even degree polynomial function, and
state the number of real zeros.
a.
As x → −∞, f(x) → −∞
Example 4
For each graph, describe the end behavior,
determine whether it represents an odd degree
or an even degree polynomial function, and
state the number of real zeros.
a.
As x → −∞, f(x) → −∞
As x → +∞, f(x) → −∞
Example 4
For each graph, describe the end behavior,
determine whether it represents an odd degree
or an even degree polynomial function, and
state the number of real zeros.
a.
As x → −∞, f(x) → −∞
As x → +∞, f(x) → −∞
This is an even
degree function
Example 4
For each graph, describe the end behavior,
determine whether it represents an odd degree
or an even degree polynomial function, and
state the number of real zeros.
a.
As x → −∞, f(x) → −∞
As x → +∞, f(x) → −∞
This is an even
degree function No real zeros
Example 4
For each graph, describe the end behavior,
determine whether it represents an odd degree
or an even degree polynomial function, and
state the number of real zeros.
b.
Example 4
For each graph, describe the end behavior,
determine whether it represents an odd degree
or an even degree polynomial function, and
state the number of real zeros.
b.
As x → −∞, f(x) → −∞
Example 4
For each graph, describe the end behavior,
determine whether it represents an odd degree
or an even degree polynomial function, and
state the number of real zeros.
b.
As x → −∞, f(x) → −∞
As x → +∞, f(x) → +∞
Example 4
For each graph, describe the end behavior,
determine whether it represents an odd degree
or an even degree polynomial function, and
state the number of real zeros.
b.
As x → −∞, f(x) → −∞
As x → +∞, f(x) → +∞
This is an odd
degree function
Example 4
For each graph, describe the end behavior,
determine whether it represents an odd degree
or an even degree polynomial function, and
state the number of real zeros.
b.
As x → −∞, f(x) → −∞
As x → +∞, f(x) → +∞
This is an odd
degree function One real zero
Example 5
Graph by making a table of values.
f (x ) = −x 3
− 4x 2
+ 5
Example 5
Graph by making a table of values.
x y
f (x ) = −x 3
− 4x 2
+ 5
Example 5
Graph by making a table of values.
x y
−4
f (x ) = −x 3
− 4x 2
+ 5
Example 5
Graph by making a table of values.
x y
−4 5
f (x ) = −x 3
− 4x 2
+ 5
Example 5
Graph by making a table of values.
x y
−4 5
−3
f (x ) = −x 3
− 4x 2
+ 5
Example 5
Graph by making a table of values.
x y
−4 5
−3 −4
f (x ) = −x 3
− 4x 2
+ 5
Example 5
Graph by making a table of values.
x y
−4 5
−3 −4
−2
f (x ) = −x 3
− 4x 2
+ 5
Example 5
Graph by making a table of values.
x y
−4 5
−3 −4
−2 −3
f (x ) = −x 3
− 4x 2
+ 5
Example 5
Graph by making a table of values.
x y
−4 5
−3 −4
−2 −3
−1
f (x ) = −x 3
− 4x 2
+ 5
Example 5
Graph by making a table of values.
x y
−4 5
−3 −4
−2 −3
−1 2
f (x ) = −x 3
− 4x 2
+ 5
Example 5
Graph by making a table of values.
x y
−4 5
−3 −4
−2 −3
−1 2
0
f (x ) = −x 3
− 4x 2
+ 5
Example 5
Graph by making a table of values.
x y
−4 5
−3 −4
−2 −3
−1 2
0 5
f (x ) = −x 3
− 4x 2
+ 5
Example 5
Graph by making a table of values.
x y
−4 5
−3 −4
−2 −3
−1 2
0 5
1
f (x ) = −x 3
− 4x 2
+ 5
Example 5
Graph by making a table of values.
x y
−4 5
−3 −4
−2 −3
−1 2
0 5
1 0
f (x ) = −x 3
− 4x 2
+ 5
Example 5
Graph by making a table of values.
x y
−4 5
−3 −4
−2 −3
−1 2
0 5
1 0
2
f (x ) = −x 3
− 4x 2
+ 5
Example 5
Graph by making a table of values.
x y
−4 5
−3 −4
−2 −3
−1 2
0 5
1 0
2 −19
f (x ) = −x 3
− 4x 2
+ 5

Algebra 2 Section 4-4

  • 1.
  • 2.
    Essential Questions • Howdo you evaluate polynomial functions? • How do you identify general shapes of graphs of polynomial functions?
  • 3.
    Vocabulary 1. Polynomial inOne Variable: 2. Leading Coefficient: 3. Polynomial Function:
  • 4.
    Vocabulary 1. Polynomial inOne Variable: An expression with only one variable with varying exponents and real number coefficients 2. Leading Coefficient: 3. Polynomial Function:
  • 5.
    Vocabulary 1. Polynomial inOne Variable: An expression with only one variable with varying exponents and real number coefficients 2. Leading Coefficient: The coefficient of the first term of a polynomial written in standard form 3. Polynomial Function:
  • 6.
    Vocabulary 1. Polynomial inOne Variable: An expression with only one variable with varying exponents and real number coefficients 2. Leading Coefficient: The coefficient of the first term of a polynomial written in standard form 3. Polynomial Function: A continuous function that can described by a polynomial in one variable
  • 7.
    Vocabulary 4. Power Function: 5.Quartic Function: 6. Quintic Function:
  • 8.
    Vocabulary 4. Power Function:The simplest versions of polynomial functions of the form 5. Quartic Function: 6. Quintic Function:
  • 9.
    Vocabulary 4. Power Function:The simplest versions of polynomial functions of the form 5. Quartic Function: 6. Quintic Function: f (x ) = axb , where a and b are nonzero real numbers
  • 10.
    Vocabulary 4. Power Function:The simplest versions of polynomial functions of the form 5. Quartic Function: A power function with a degree of 4 6. Quintic Function: f (x ) = axb , where a and b are nonzero real numbers
  • 11.
    Vocabulary 4. Power Function:The simplest versions of polynomial functions of the form 5. Quartic Function: A power function with a degree of 4 6. Quintic Function: A power function with a degree of 5 f (x ) = axb , where a and b are nonzero real numbers
  • 12.
  • 13.
  • 14.
  • 15.
  • 16.
  • 17.
  • 18.
  • 19.
  • 20.
  • 21.
  • 22.
  • 23.
  • 24.
  • 25.
  • 26.
  • 27.
  • 28.
  • 29.
  • 30.
    Example 1 State thedegree and leading coefficient of each polynomial in one variable. If it is not a polynomial in one variable, explain why. a. 7z3 − 4z2 + z
  • 31.
    Example 1 State thedegree and leading coefficient of each polynomial in one variable. If it is not a polynomial in one variable, explain why. a. 7z3 − 4z2 + z Degree: 3
  • 32.
    Example 1 State thedegree and leading coefficient of each polynomial in one variable. If it is not a polynomial in one variable, explain why. a. 7z3 − 4z2 + z Degree: 3 Leading Coefficient: 7
  • 33.
    Example 1 State thedegree and leading coefficient of each polynomial in one variable. If it is not a polynomial in one variable, explain why. b. 6a3 − 4a2 + ab2
  • 34.
    Example 1 State thedegree and leading coefficient of each polynomial in one variable. If it is not a polynomial in one variable, explain why. b. 6a3 − 4a2 + ab2 Not a polynomial in one variable; Has a and b
  • 35.
    Example 1 State thedegree and leading coefficient of each polynomial in one variable. If it is not a polynomial in one variable, explain why. c. 3x5 + 2x 2 − 4 − 8x 6
  • 36.
    Example 1 State thedegree and leading coefficient of each polynomial in one variable. If it is not a polynomial in one variable, explain why. c. 3x5 + 2x 2 − 4 − 8x 6 Degree: 6
  • 37.
    Example 1 State thedegree and leading coefficient of each polynomial in one variable. If it is not a polynomial in one variable, explain why. c. 3x5 + 2x 2 − 4 − 8x 6 Degree: 6 Leading Coefficient: −8
  • 38.
    Example 2 The volumeof the air in the lungs during a 5 second respiratory cycle can be modeled by the function below, where v is the volume in liters and t is the time in seconds. Find the volume of air in the lungs 1.5 seconds into the respiratory cycle. v (t) = −0.037t 3 + 0.152t2 + 0.173t
  • 39.
    Example 2 The volumeof the air in the lungs during a 5 second respiratory cycle can be modeled by the function below, where v is the volume in liters and t is the time in seconds. Find the volume of air in the lungs 1.5 seconds into the respiratory cycle. v (t) = −0.037t 3 + 0.152t2 + 0.173t v (1.5) = −0.037(1.5)3 + 0.152(1.5)2 + 0.173(1.5)
  • 40.
    Example 2 The volumeof the air in the lungs during a 5 second respiratory cycle can be modeled by the function below, where v is the volume in liters and t is the time in seconds. Find the volume of air in the lungs 1.5 seconds into the respiratory cycle. v (t) = −0.037t 3 + 0.152t2 + 0.173t v (1.5) = −0.037(1.5)3 + 0.152(1.5)2 + 0.173(1.5) v (1.5) = .476625
  • 41.
    Example 2 The volumeof the air in the lungs during a 5 second respiratory cycle can be modeled by the function below, where v is the volume in liters and t is the time in seconds. Find the volume of air in the lungs 1.5 seconds into the respiratory cycle. v (t) = −0.037t 3 + 0.152t2 + 0.173t v (1.5) = −0.037(1.5)3 + 0.152(1.5)2 + 0.173(1.5) v (1.5) = .476625 liters
  • 42.
    Example 3 Find b(m)= 2m2 + m −1b(2x −1)− 3b(x ) if
  • 43.
    Example 3 Find b(m)= 2m2 + m −1b(2x −1)− 3b(x ) if b(2x −1) = 2(2x −1)2 + (2x −1)−1
  • 44.
    Example 3 Find b(m)= 2m2 + m −1b(2x −1)− 3b(x ) if b(2x −1) = 2(2x −1)2 + (2x −1)−1 b(2x −1) = 2(4x 2 − 4x +1)+ 2x −1−1
  • 45.
    Example 3 Find b(m)= 2m2 + m −1b(2x −1)− 3b(x ) if b(2x −1) = 2(2x −1)2 + (2x −1)−1 b(2x −1) = 2(4x 2 − 4x +1)+ 2x −1−1 b(2x −1) = 8x 2 − 8x + 2 + 2x − 2
  • 46.
    Example 3 Find b(m)= 2m2 + m −1b(2x −1)− 3b(x ) if b(2x −1) = 2(2x −1)2 + (2x −1)−1 b(2x −1) = 2(4x 2 − 4x +1)+ 2x −1−1 b(2x −1) = 8x 2 − 8x + 2 + 2x − 2 b(2x −1) = 8x 2 − 6x
  • 47.
    Example 3 Find b(m)= 2m2 + m −1b(2x −1)− 3b(x ) if b(2x −1) = 2(2x −1)2 + (2x −1)−1 b(2x −1) = 2(4x 2 − 4x +1)+ 2x −1−1 b(2x −1) = 8x 2 − 8x + 2 + 2x − 2 b(2x −1) = 8x 2 − 6x 3b(x ) = 3(2x 2 + x −1)
  • 48.
    Example 3 Find b(m)= 2m2 + m −1b(2x −1)− 3b(x ) if b(2x −1) = 2(2x −1)2 + (2x −1)−1 b(2x −1) = 2(4x 2 − 4x +1)+ 2x −1−1 b(2x −1) = 8x 2 − 8x + 2 + 2x − 2 b(2x −1) = 8x 2 − 6x 3b(x ) = 3(2x 2 + x −1) 3b(x ) = 6x 2 + 3x − 3
  • 49.
    Example 3 Find b(m)= 2m2 + m −1b(2x −1)− 3b(x ) if b(2x −1) = 8x 2 − 6x 3b(x ) = 6x 2 + 3x − 3
  • 50.
    Example 3 Find b(m)= 2m2 + m −1b(2x −1)− 3b(x ) if b(2x −1) = 8x 2 − 6x 3b(x ) = 6x 2 + 3x − 3 b(2x −1)− 3b(x ) = 8x 2 − 6x − (6x 2 + 3x − 3)
  • 51.
    Example 3 Find b(m)= 2m2 + m −1b(2x −1)− 3b(x ) if b(2x −1) = 8x 2 − 6x 3b(x ) = 6x 2 + 3x − 3 b(2x −1)− 3b(x ) = 8x 2 − 6x − (6x 2 + 3x − 3) b(2x −1)− 3b(x ) = 8x 2 − 6x − 6x 2 − 3x + 3
  • 52.
    Example 3 Find b(m)= 2m2 + m −1b(2x −1)− 3b(x ) if b(2x −1) = 8x 2 − 6x 3b(x ) = 6x 2 + 3x − 3 b(2x −1)− 3b(x ) = 8x 2 − 6x − (6x 2 + 3x − 3) b(2x −1)− 3b(x ) = 8x 2 − 6x − 6x 2 − 3x + 3 b(2x −1)− 3b(x ) = 2x 2 − 9x + 3
  • 53.
    Example 4 For eachgraph, describe the end behavior, determine whether it represents an odd degree or an even degree polynomial function, and state the number of real zeros. a.
  • 54.
    Example 4 For eachgraph, describe the end behavior, determine whether it represents an odd degree or an even degree polynomial function, and state the number of real zeros. a. As x → −∞, f(x) → −∞
  • 55.
    Example 4 For eachgraph, describe the end behavior, determine whether it represents an odd degree or an even degree polynomial function, and state the number of real zeros. a. As x → −∞, f(x) → −∞ As x → +∞, f(x) → −∞
  • 56.
    Example 4 For eachgraph, describe the end behavior, determine whether it represents an odd degree or an even degree polynomial function, and state the number of real zeros. a. As x → −∞, f(x) → −∞ As x → +∞, f(x) → −∞ This is an even degree function
  • 57.
    Example 4 For eachgraph, describe the end behavior, determine whether it represents an odd degree or an even degree polynomial function, and state the number of real zeros. a. As x → −∞, f(x) → −∞ As x → +∞, f(x) → −∞ This is an even degree function No real zeros
  • 58.
    Example 4 For eachgraph, describe the end behavior, determine whether it represents an odd degree or an even degree polynomial function, and state the number of real zeros. b.
  • 59.
    Example 4 For eachgraph, describe the end behavior, determine whether it represents an odd degree or an even degree polynomial function, and state the number of real zeros. b. As x → −∞, f(x) → −∞
  • 60.
    Example 4 For eachgraph, describe the end behavior, determine whether it represents an odd degree or an even degree polynomial function, and state the number of real zeros. b. As x → −∞, f(x) → −∞ As x → +∞, f(x) → +∞
  • 61.
    Example 4 For eachgraph, describe the end behavior, determine whether it represents an odd degree or an even degree polynomial function, and state the number of real zeros. b. As x → −∞, f(x) → −∞ As x → +∞, f(x) → +∞ This is an odd degree function
  • 62.
    Example 4 For eachgraph, describe the end behavior, determine whether it represents an odd degree or an even degree polynomial function, and state the number of real zeros. b. As x → −∞, f(x) → −∞ As x → +∞, f(x) → +∞ This is an odd degree function One real zero
  • 63.
    Example 5 Graph bymaking a table of values. f (x ) = −x 3 − 4x 2 + 5
  • 64.
    Example 5 Graph bymaking a table of values. x y f (x ) = −x 3 − 4x 2 + 5
  • 65.
    Example 5 Graph bymaking a table of values. x y −4 f (x ) = −x 3 − 4x 2 + 5
  • 66.
    Example 5 Graph bymaking a table of values. x y −4 5 f (x ) = −x 3 − 4x 2 + 5
  • 67.
    Example 5 Graph bymaking a table of values. x y −4 5 −3 f (x ) = −x 3 − 4x 2 + 5
  • 68.
    Example 5 Graph bymaking a table of values. x y −4 5 −3 −4 f (x ) = −x 3 − 4x 2 + 5
  • 69.
    Example 5 Graph bymaking a table of values. x y −4 5 −3 −4 −2 f (x ) = −x 3 − 4x 2 + 5
  • 70.
    Example 5 Graph bymaking a table of values. x y −4 5 −3 −4 −2 −3 f (x ) = −x 3 − 4x 2 + 5
  • 71.
    Example 5 Graph bymaking a table of values. x y −4 5 −3 −4 −2 −3 −1 f (x ) = −x 3 − 4x 2 + 5
  • 72.
    Example 5 Graph bymaking a table of values. x y −4 5 −3 −4 −2 −3 −1 2 f (x ) = −x 3 − 4x 2 + 5
  • 73.
    Example 5 Graph bymaking a table of values. x y −4 5 −3 −4 −2 −3 −1 2 0 f (x ) = −x 3 − 4x 2 + 5
  • 74.
    Example 5 Graph bymaking a table of values. x y −4 5 −3 −4 −2 −3 −1 2 0 5 f (x ) = −x 3 − 4x 2 + 5
  • 75.
    Example 5 Graph bymaking a table of values. x y −4 5 −3 −4 −2 −3 −1 2 0 5 1 f (x ) = −x 3 − 4x 2 + 5
  • 76.
    Example 5 Graph bymaking a table of values. x y −4 5 −3 −4 −2 −3 −1 2 0 5 1 0 f (x ) = −x 3 − 4x 2 + 5
  • 77.
    Example 5 Graph bymaking a table of values. x y −4 5 −3 −4 −2 −3 −1 2 0 5 1 0 2 f (x ) = −x 3 − 4x 2 + 5
  • 78.
    Example 5 Graph bymaking a table of values. x y −4 5 −3 −4 −2 −3 −1 2 0 5 1 0 2 −19 f (x ) = −x 3 − 4x 2 + 5