Objectives
• Identify polynomialfunctions
• Recognize characteristics of graphs of polynomial
functions
• Determine end behavior
• Use factoring to find zeros of polynomial functions
• Identify zeros and their multiplicities
• Use the Intermediate Value Theorem
• Understand the relationship between degree and
turning points
• Graph polynomial functions
3.
A polynomial functionhas all of its variables with
exponents which are positive integers. It is not a
polynomial function if a variable has a negative
exponent or if the exponent is a fraction.
Polynomial Functions
4.
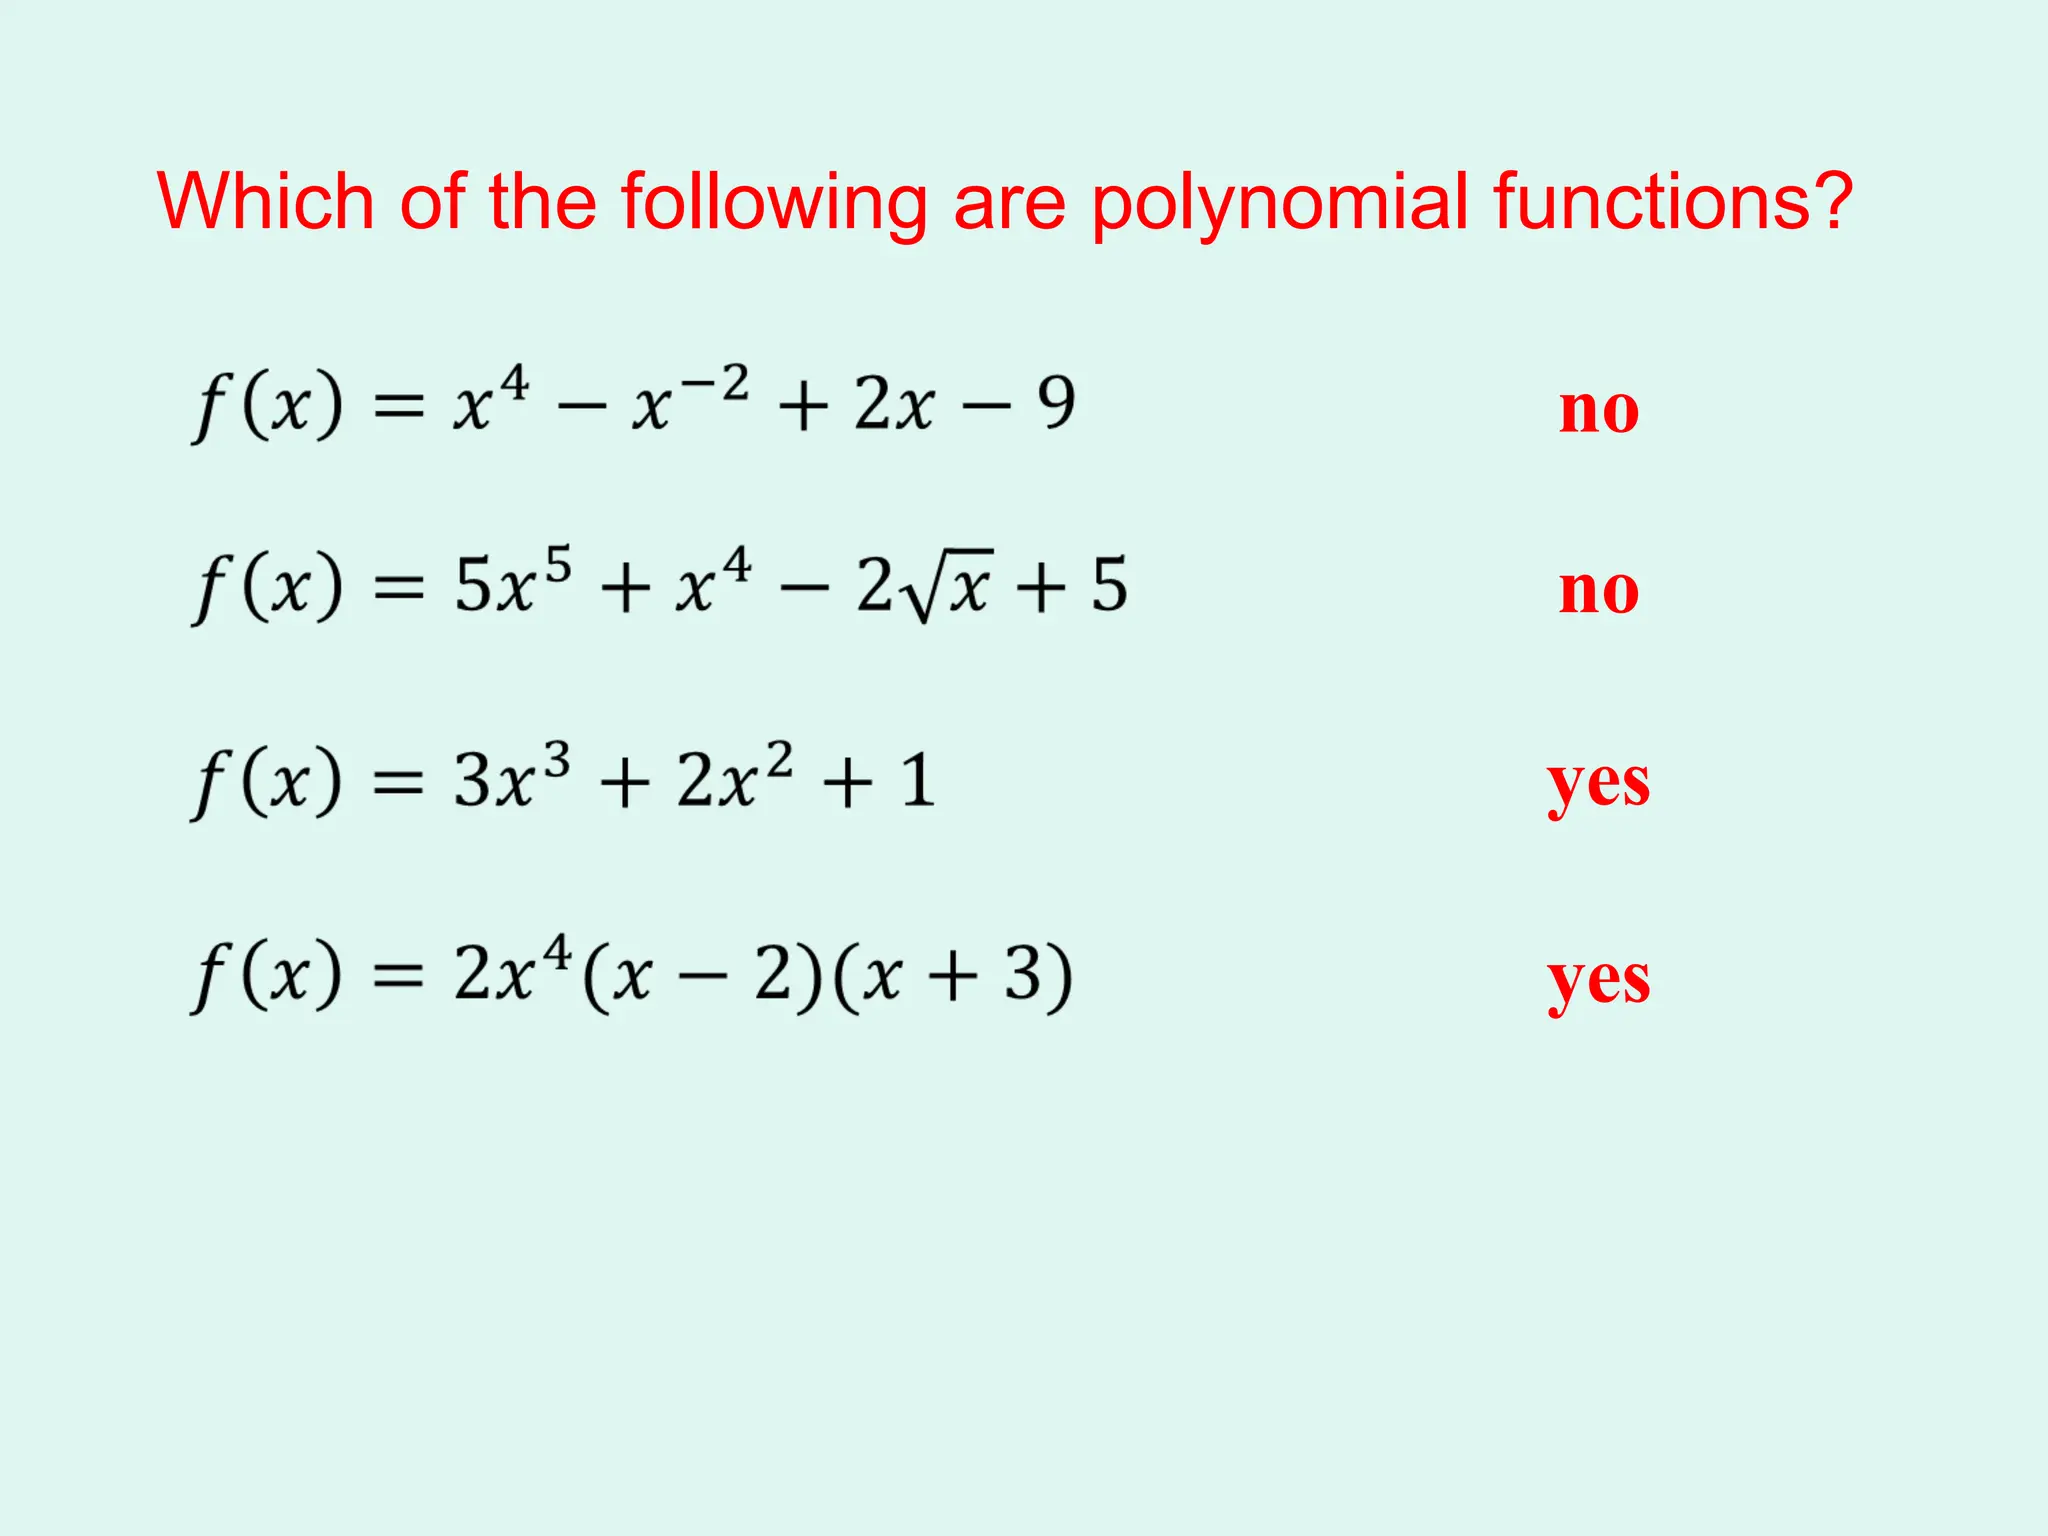
Which of thefollowing are polynomial functions?
no
no
yes
yes
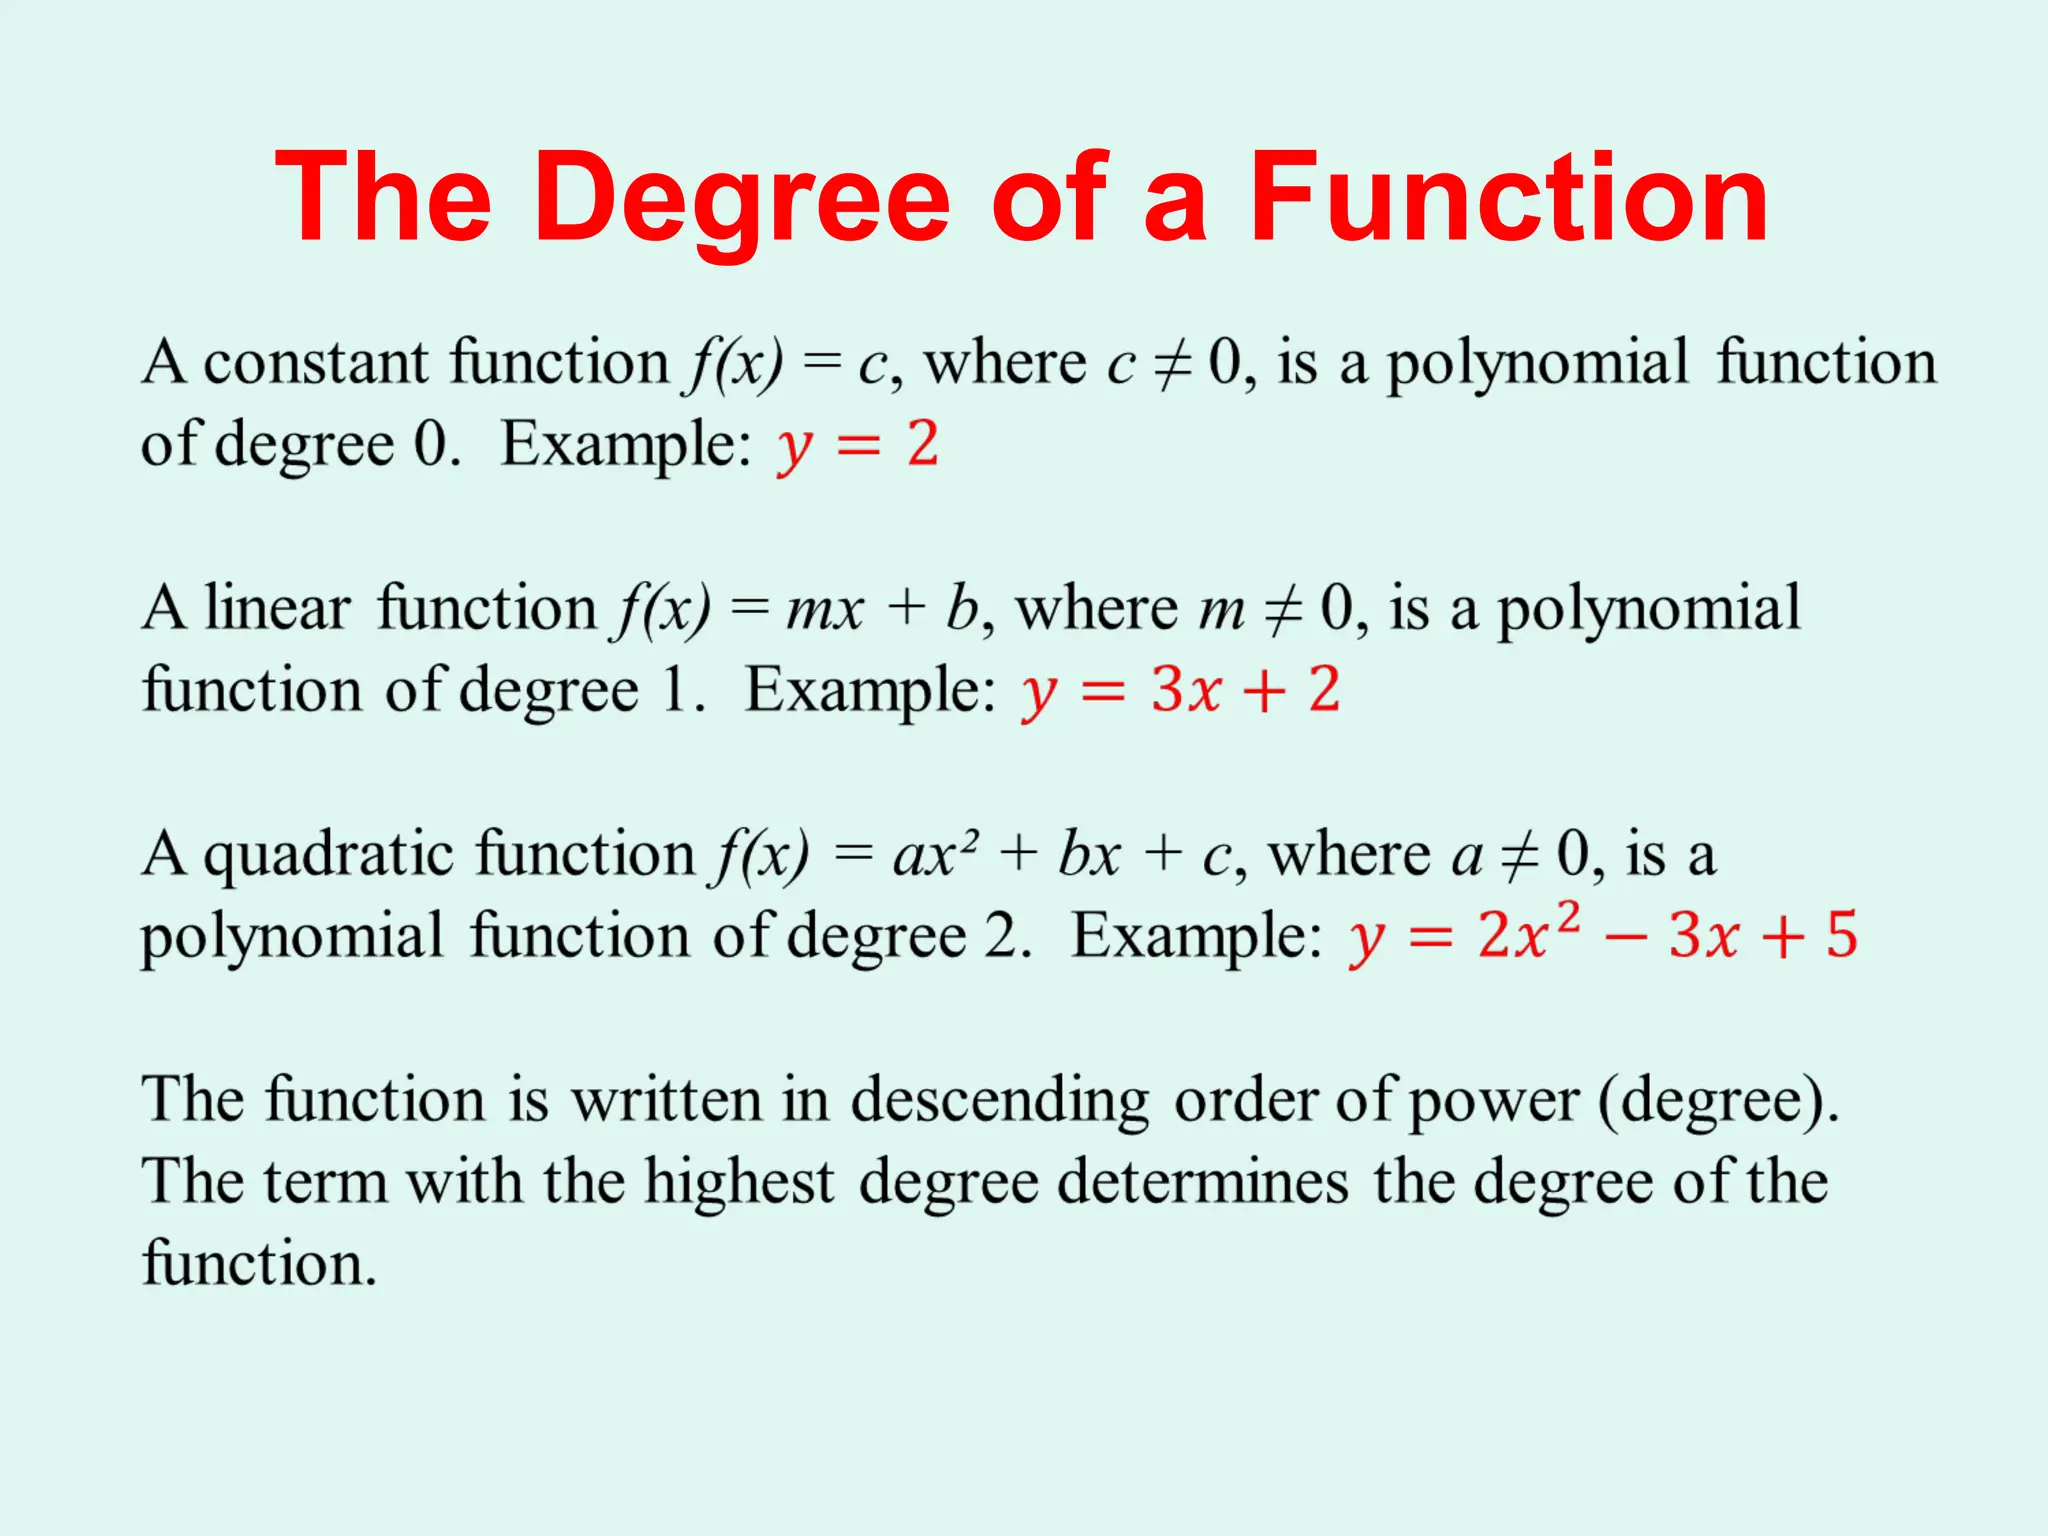
The Leading Coefficient
Thepolynomial function has a leading coefficient.
Once the function is written in descending order of
degree, the leading coefficient is the coefficient of the
term with the highest degree.
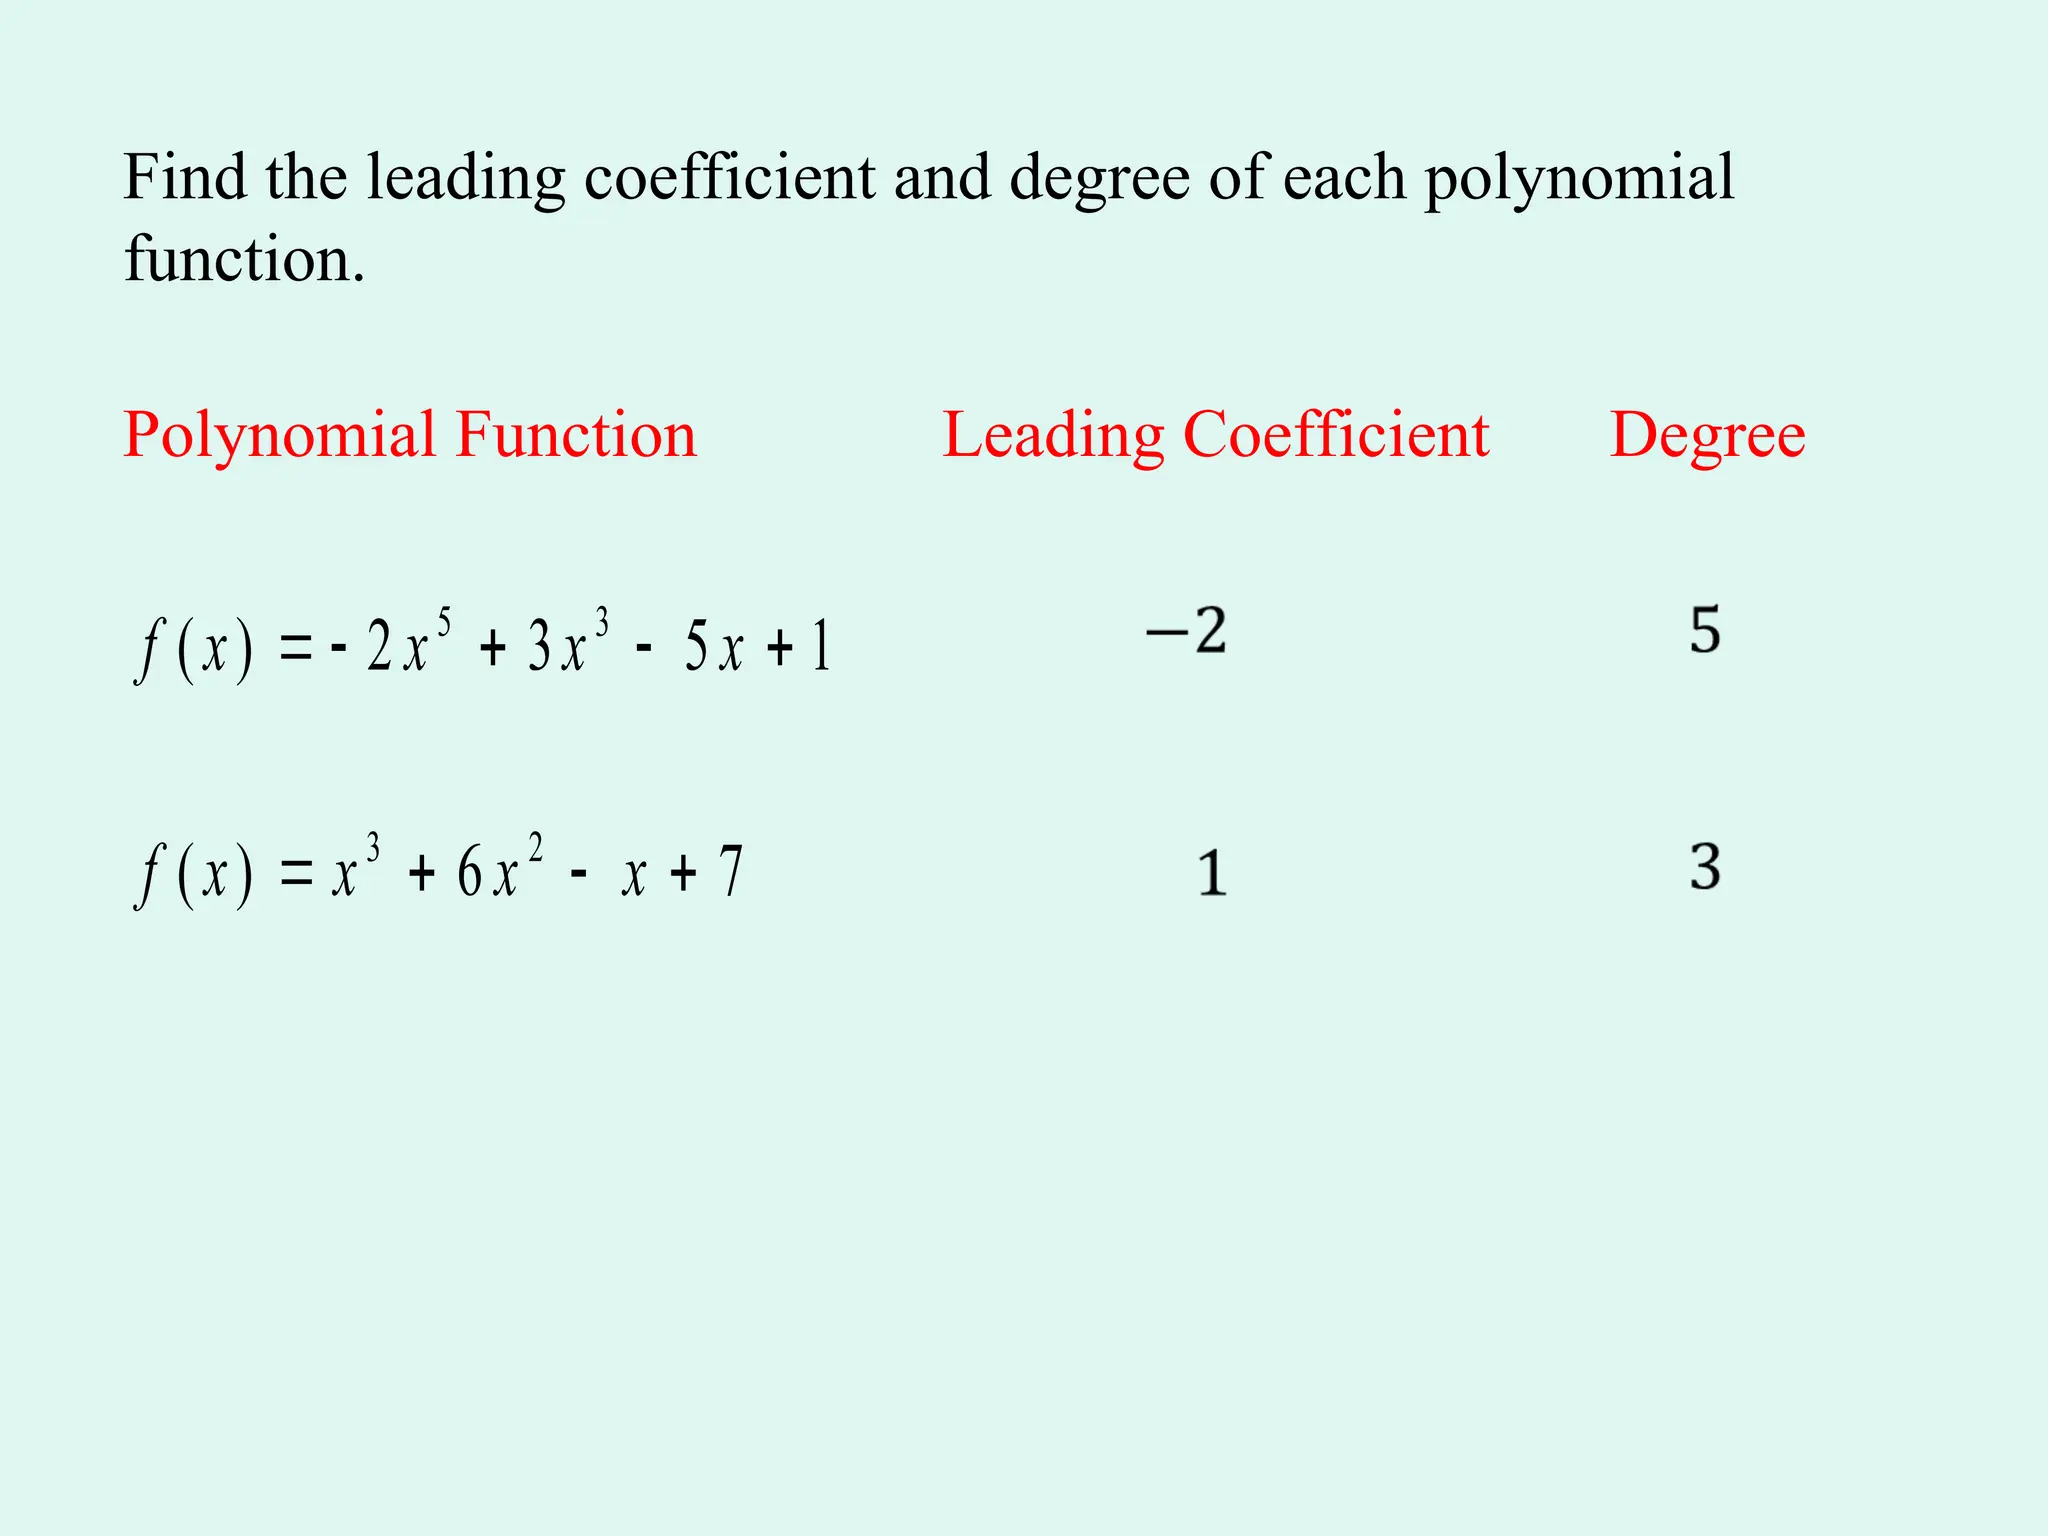
8.
Find the leadingcoefficient and degree of each polynomial
function.
Polynomial Function Leading Coefficient Degree
5 3
( ) 2 3 5 1
f x x x x
3 2
( ) 6 7
f x x x x
9.
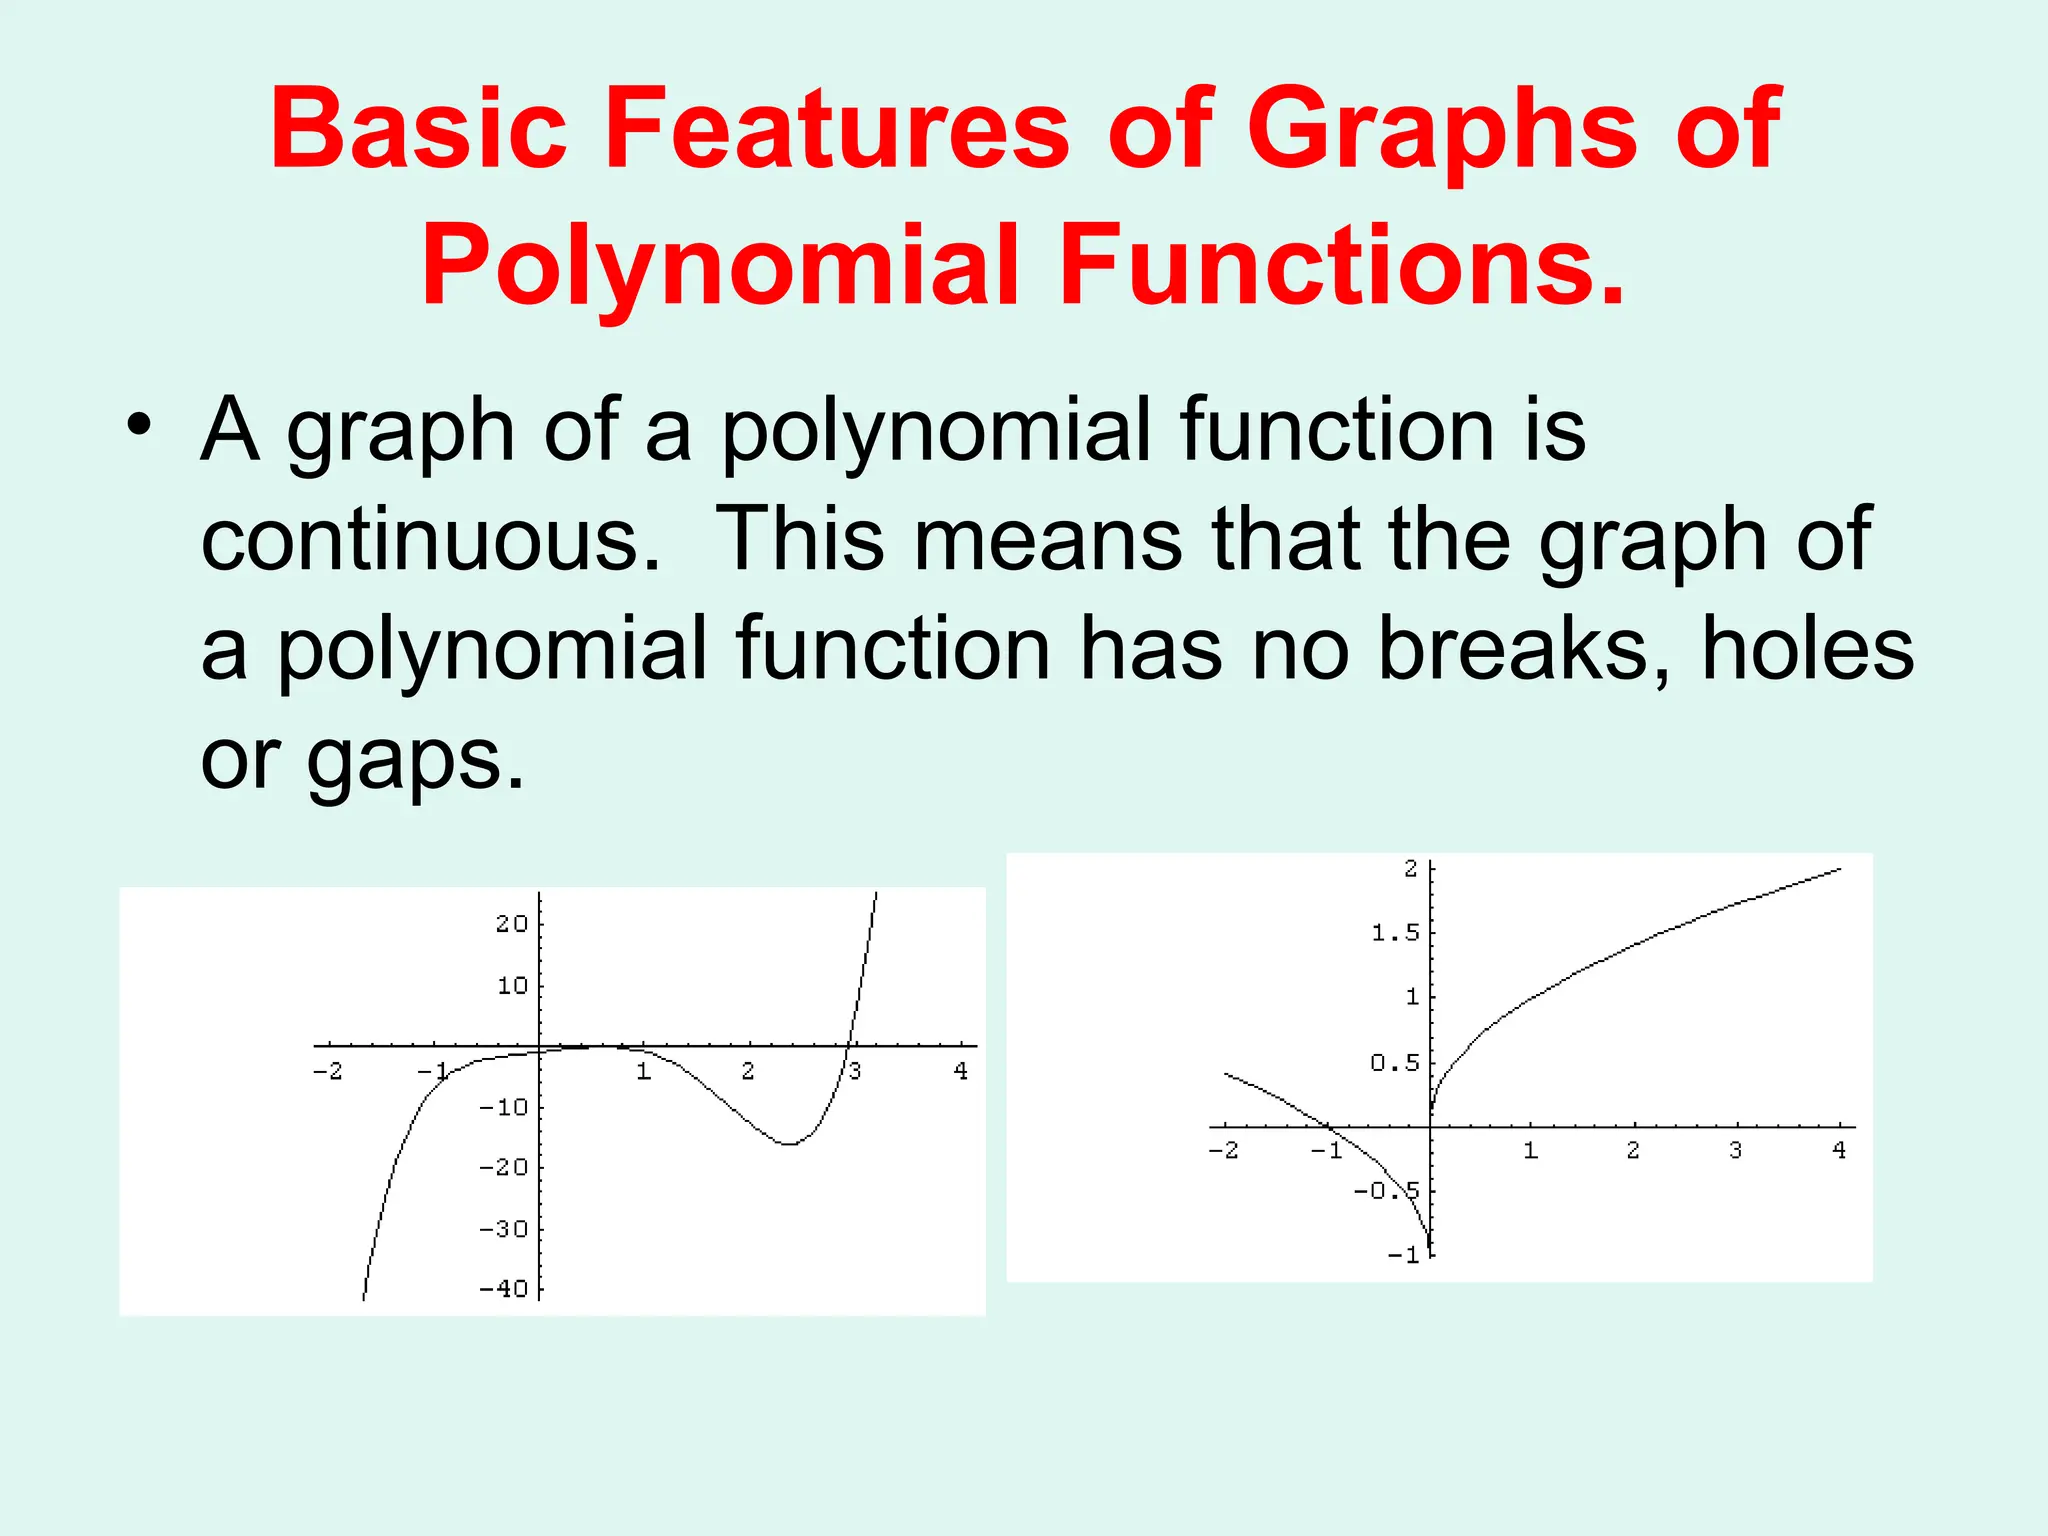
Basic Features ofGraphs of
Polynomial Functions.
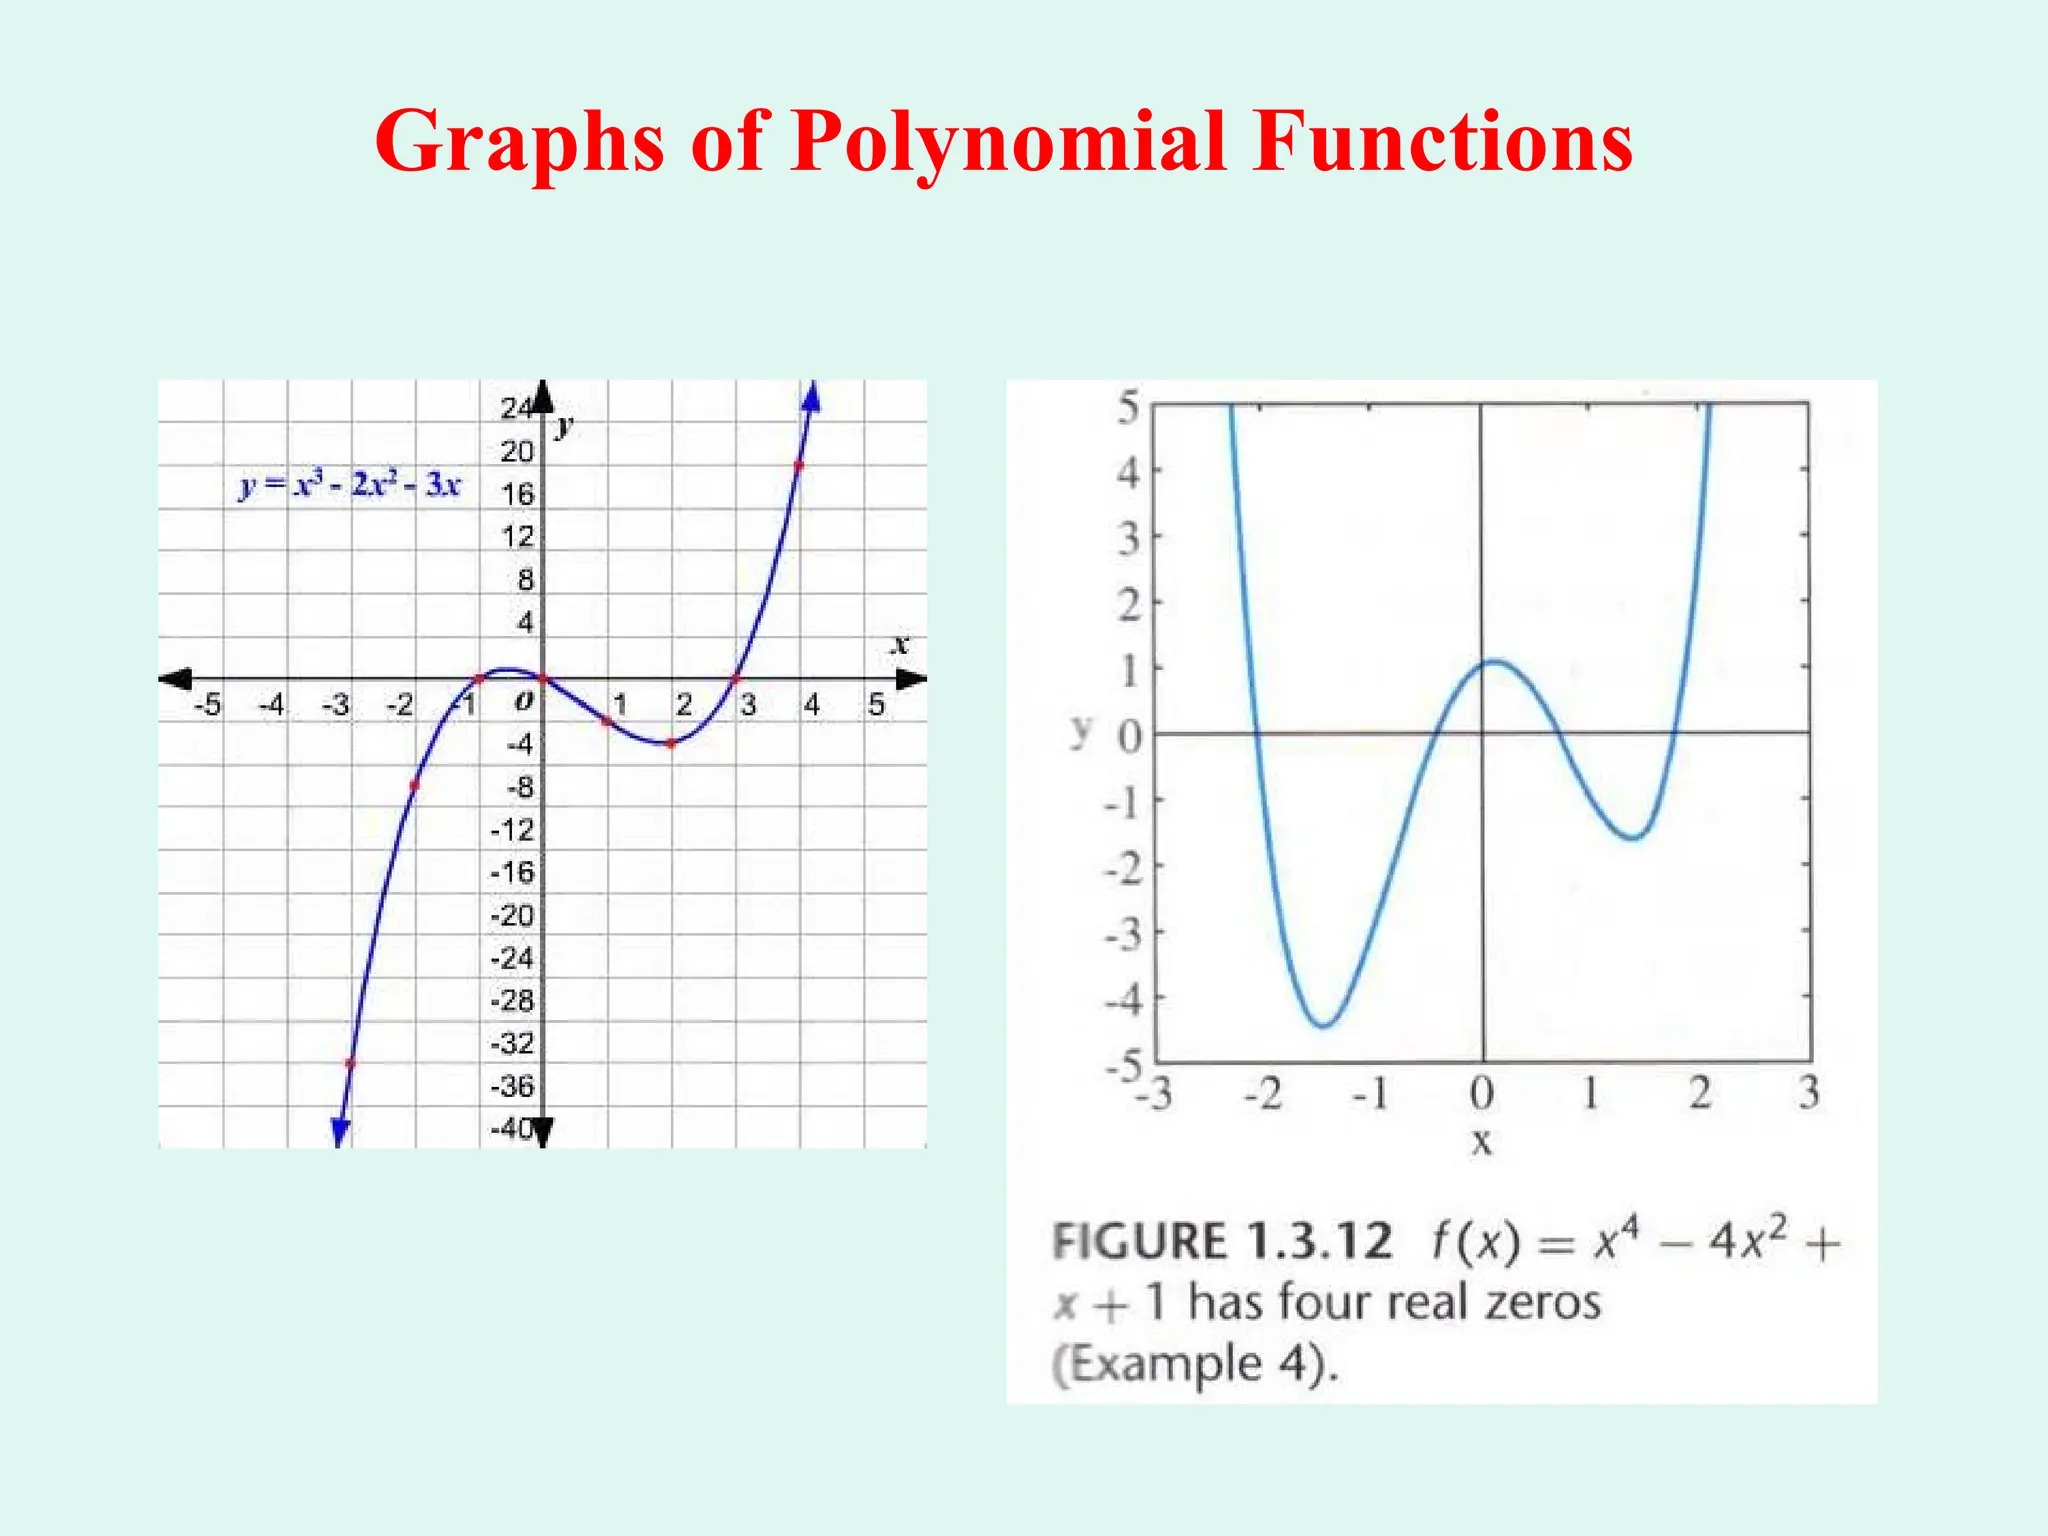
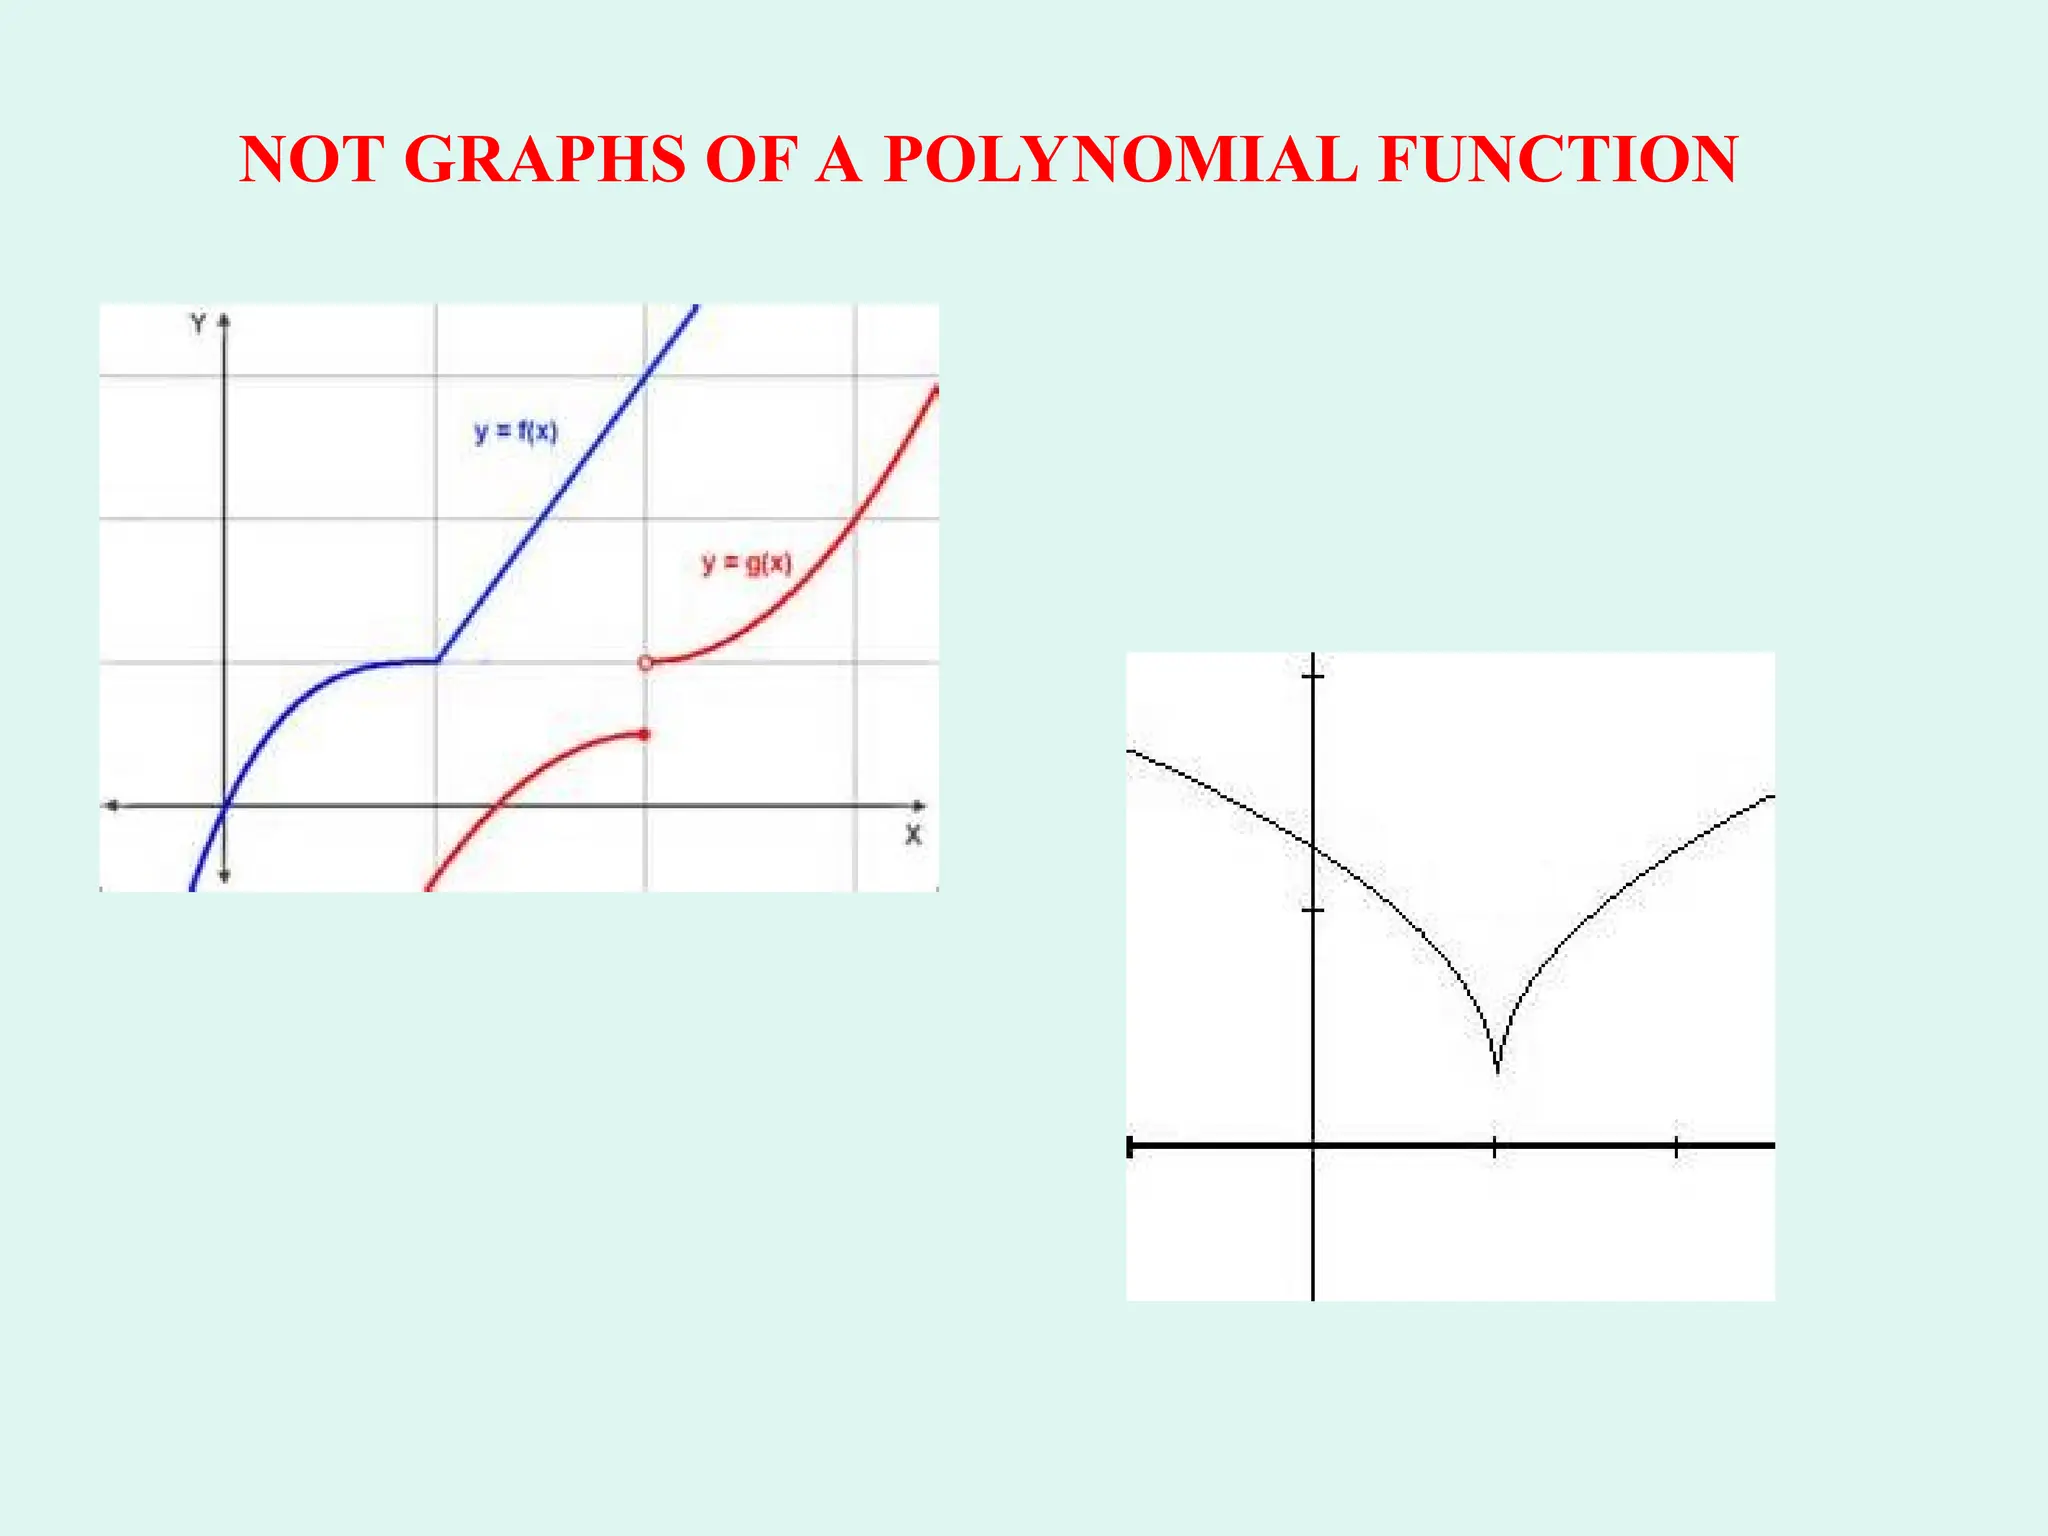
• A graph of a polynomial function is
continuous. This means that the graph of
a polynomial function has no breaks, holes
or gaps.
10.
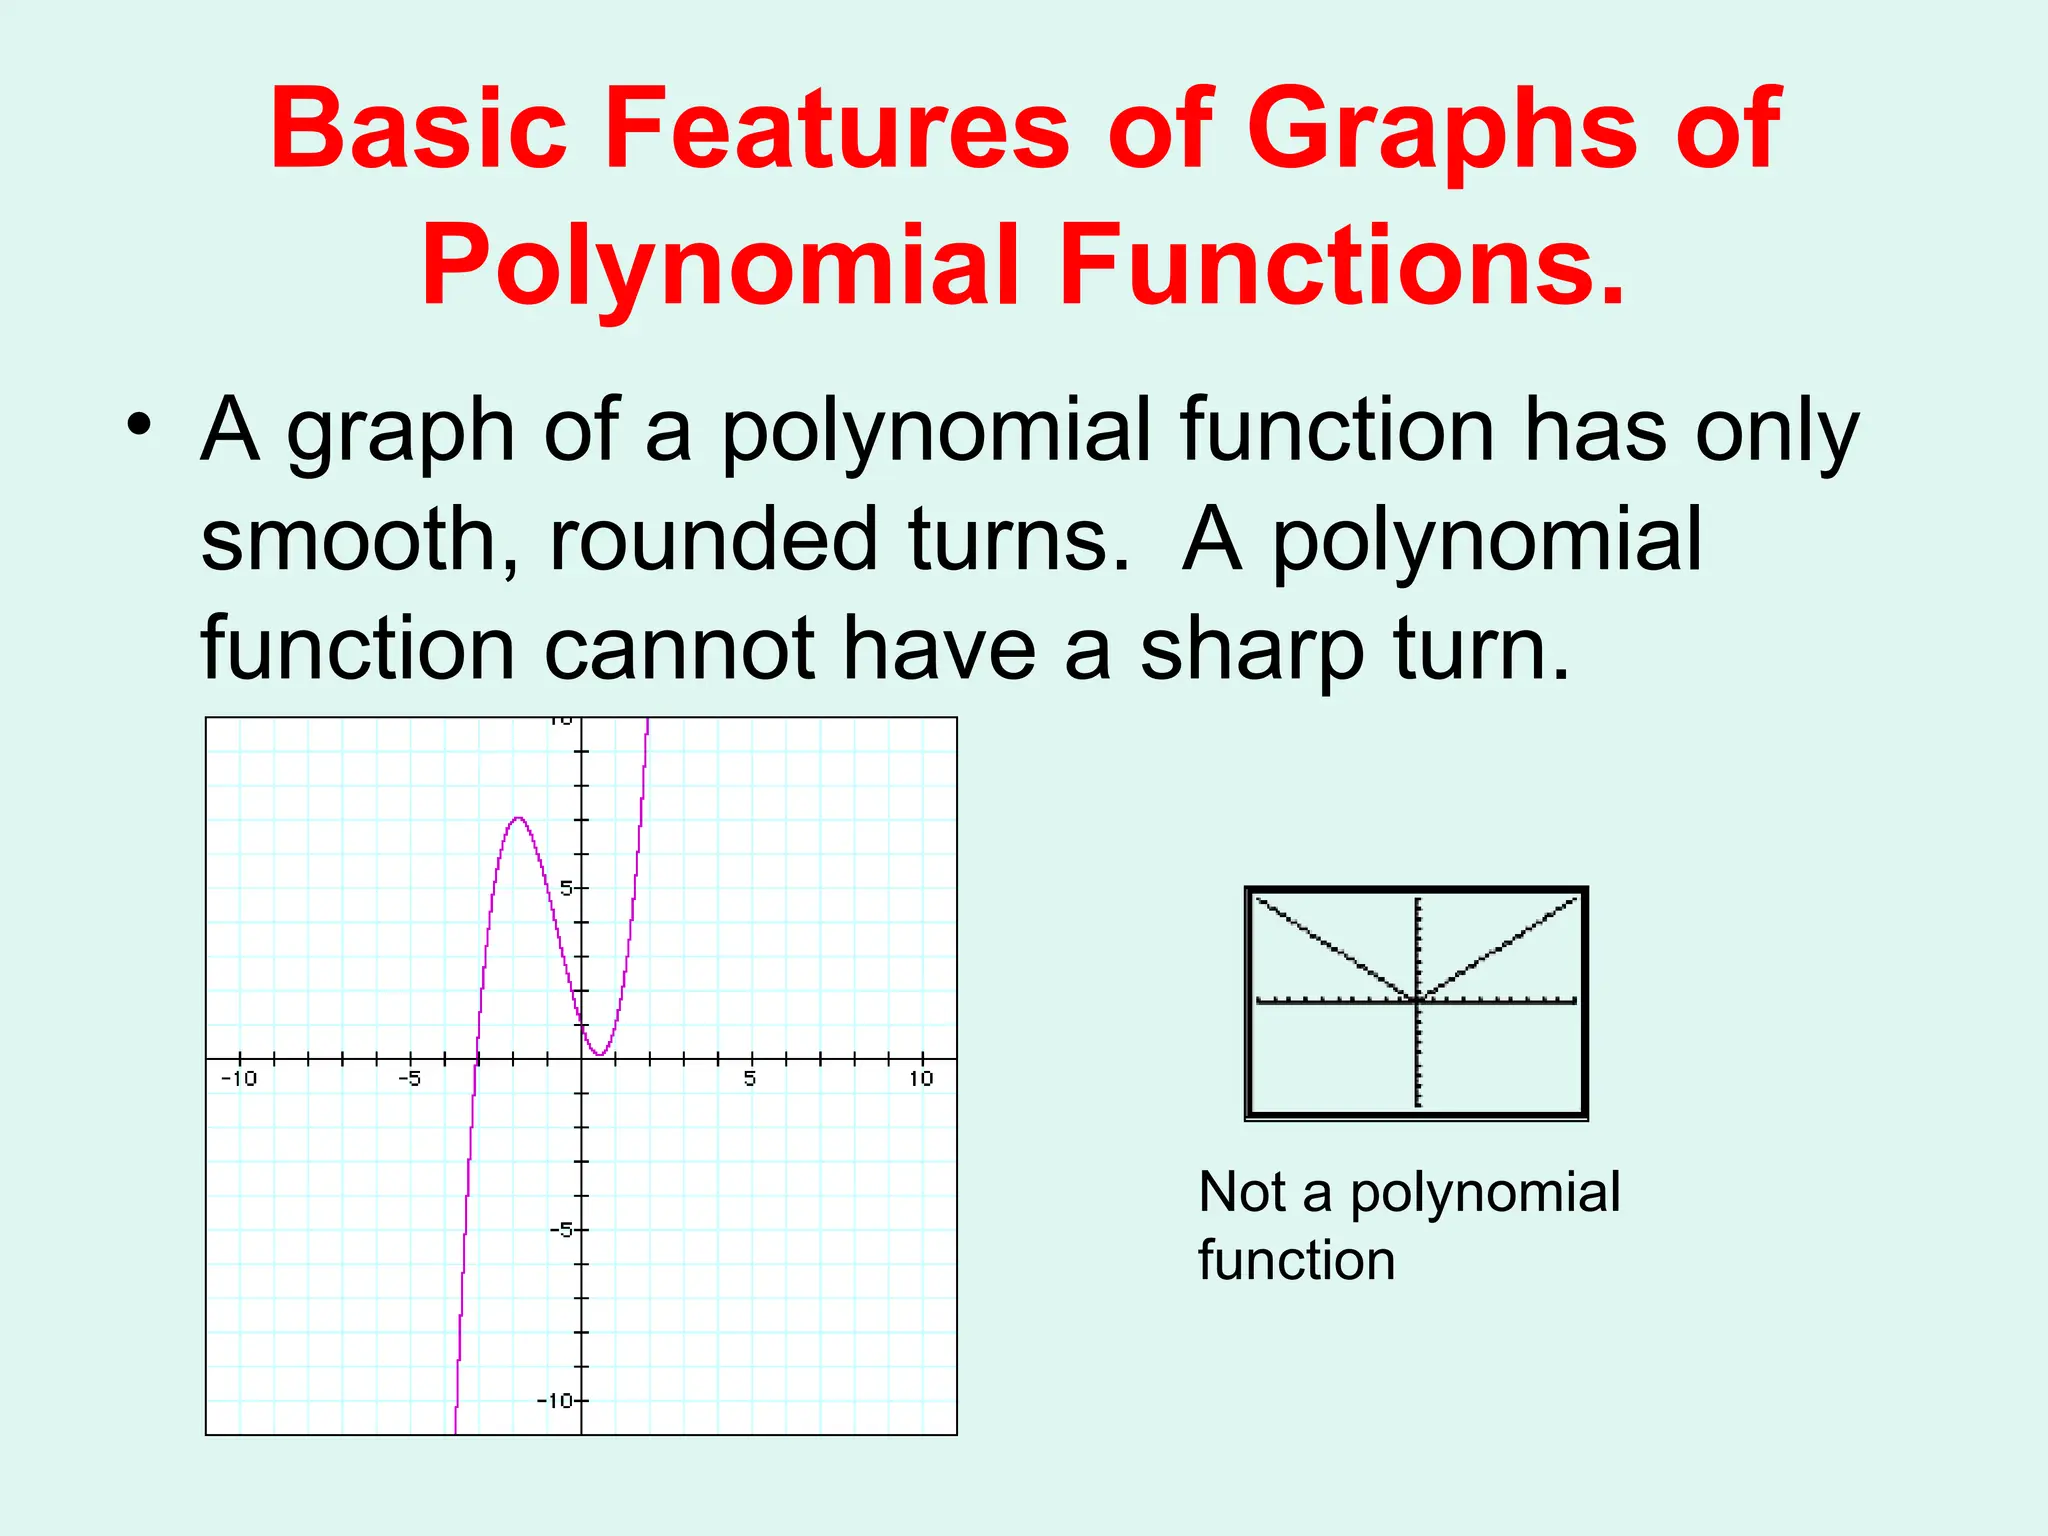
Basic Features ofGraphs of
Polynomial Functions.
• A graph of a polynomial function has only
smooth, rounded turns. A polynomial
function cannot have a sharp turn.
Not a polynomial
function
END BEHAVIOR OFPOLYNOMIAL FUNCTIONS
The behavior of the graph of a function to the far left and far
right is called its end behavior.
Although the graph of a polynomial function may have intervals
where it increases or decreases, the graph will eventually rise or
fall without bound as it moves far to the left or far to the right.
How can we determine the end behavior of a polynomial
function? We look only at the term with the highest degree.
14.
The Leading CoefficientTest
Look for the term with the highest degree.
Is the coefficient greater than or less than 0?
Is the exponent even or odd?
The answers to these questions will help us to
determine the end behavior of the polynomial
function.
15.
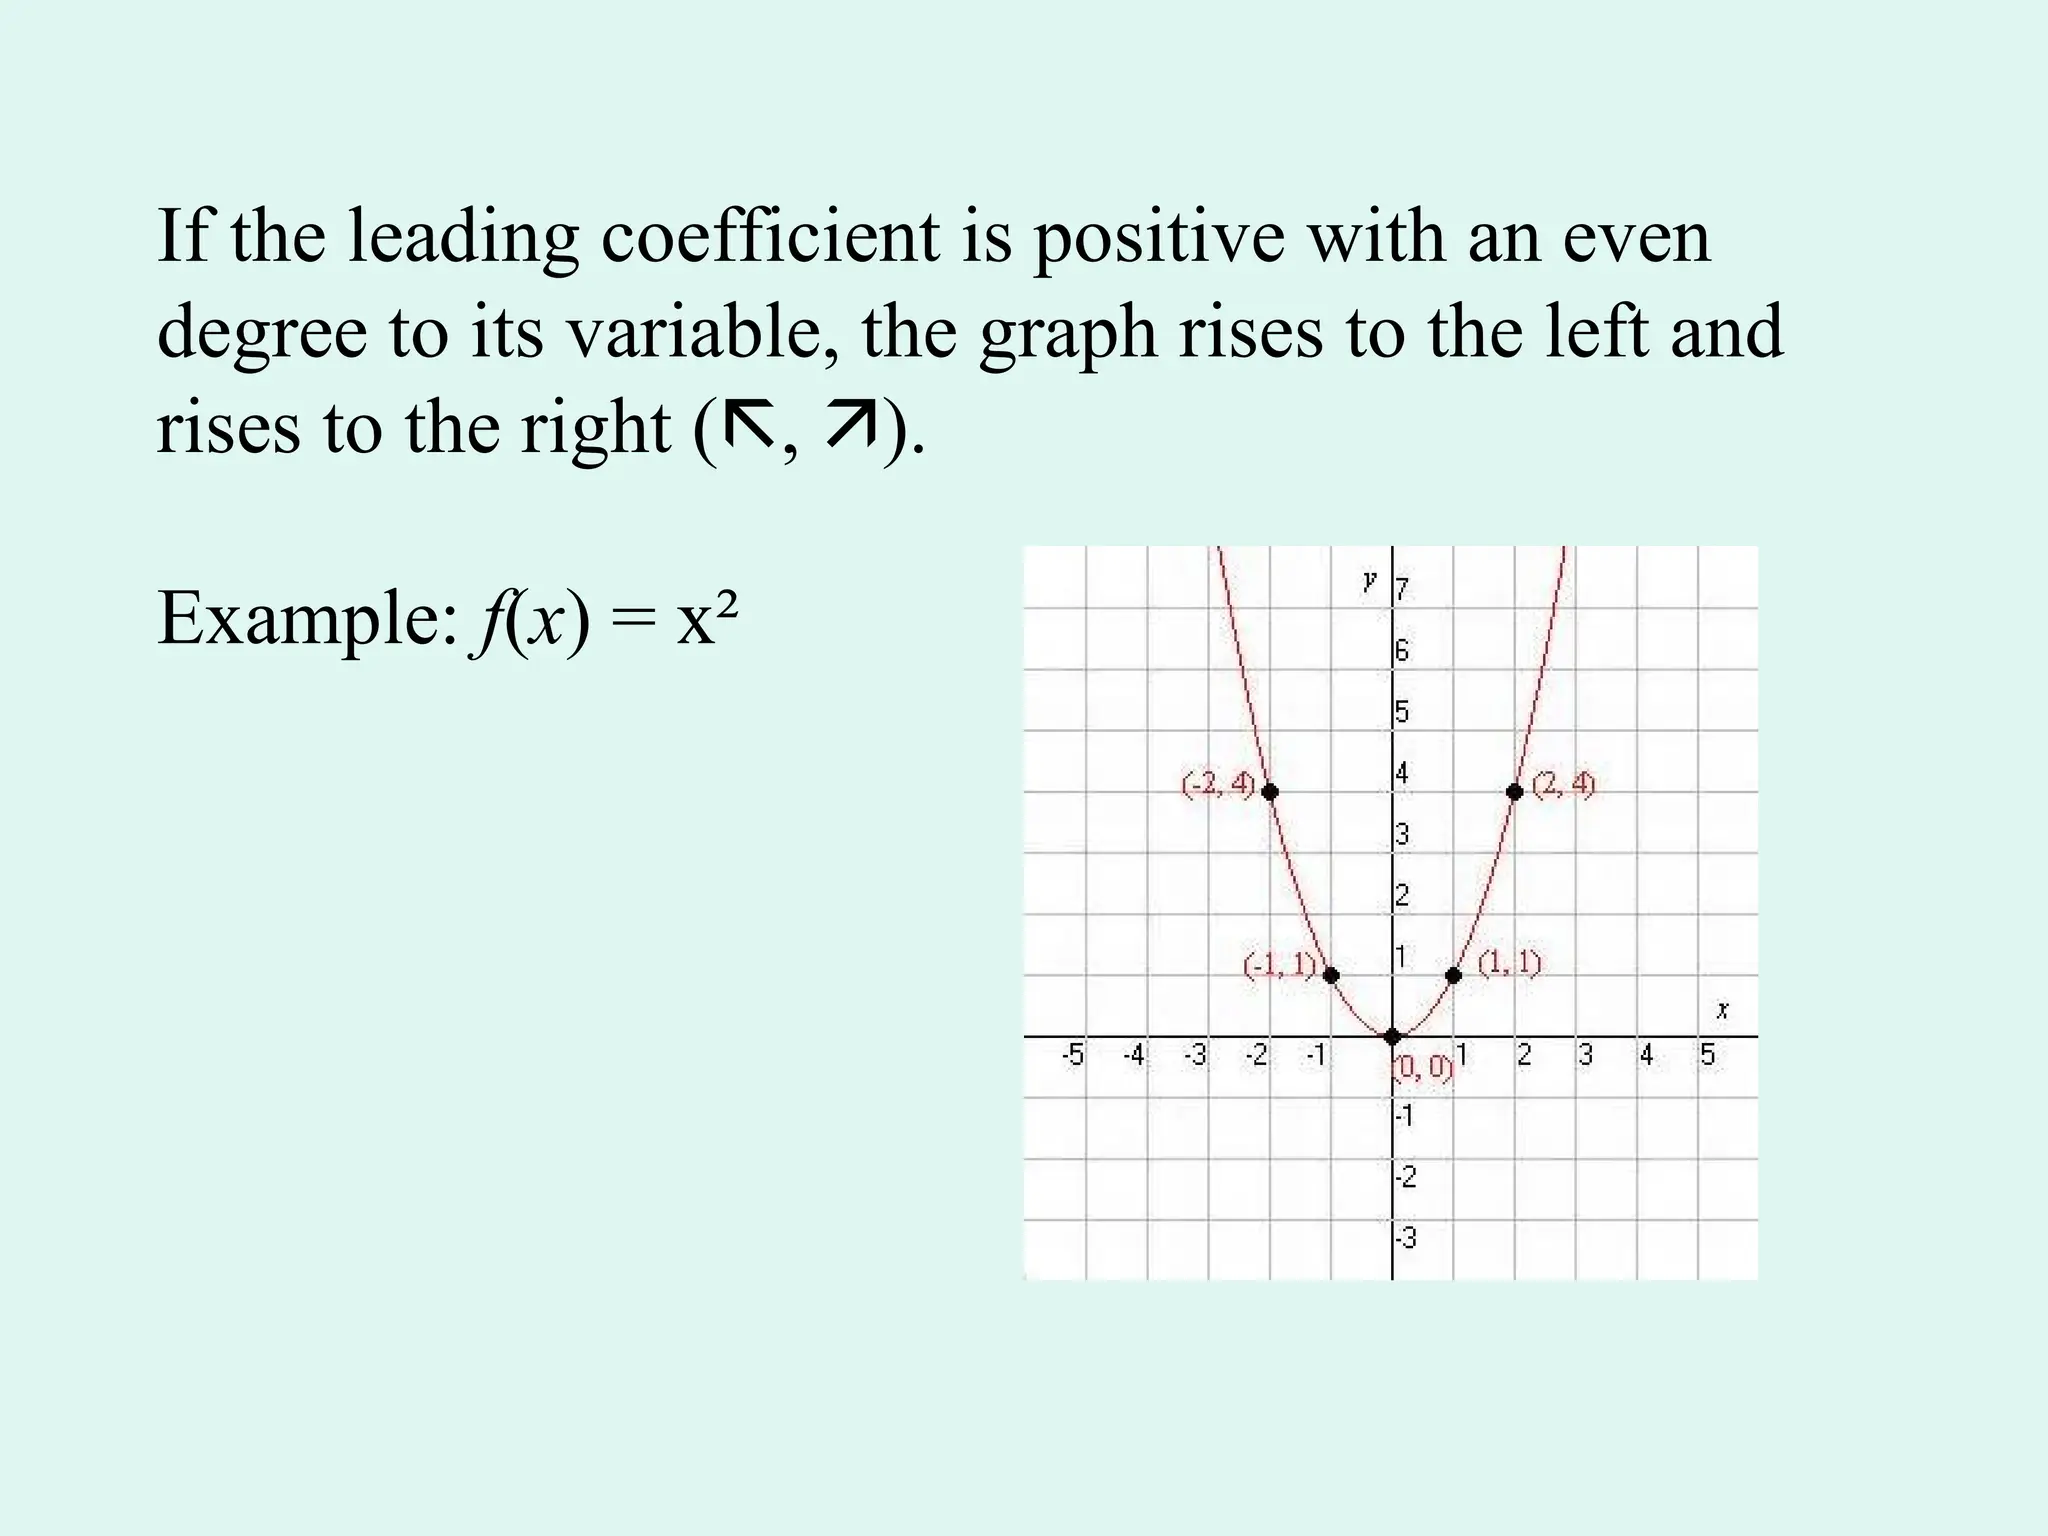
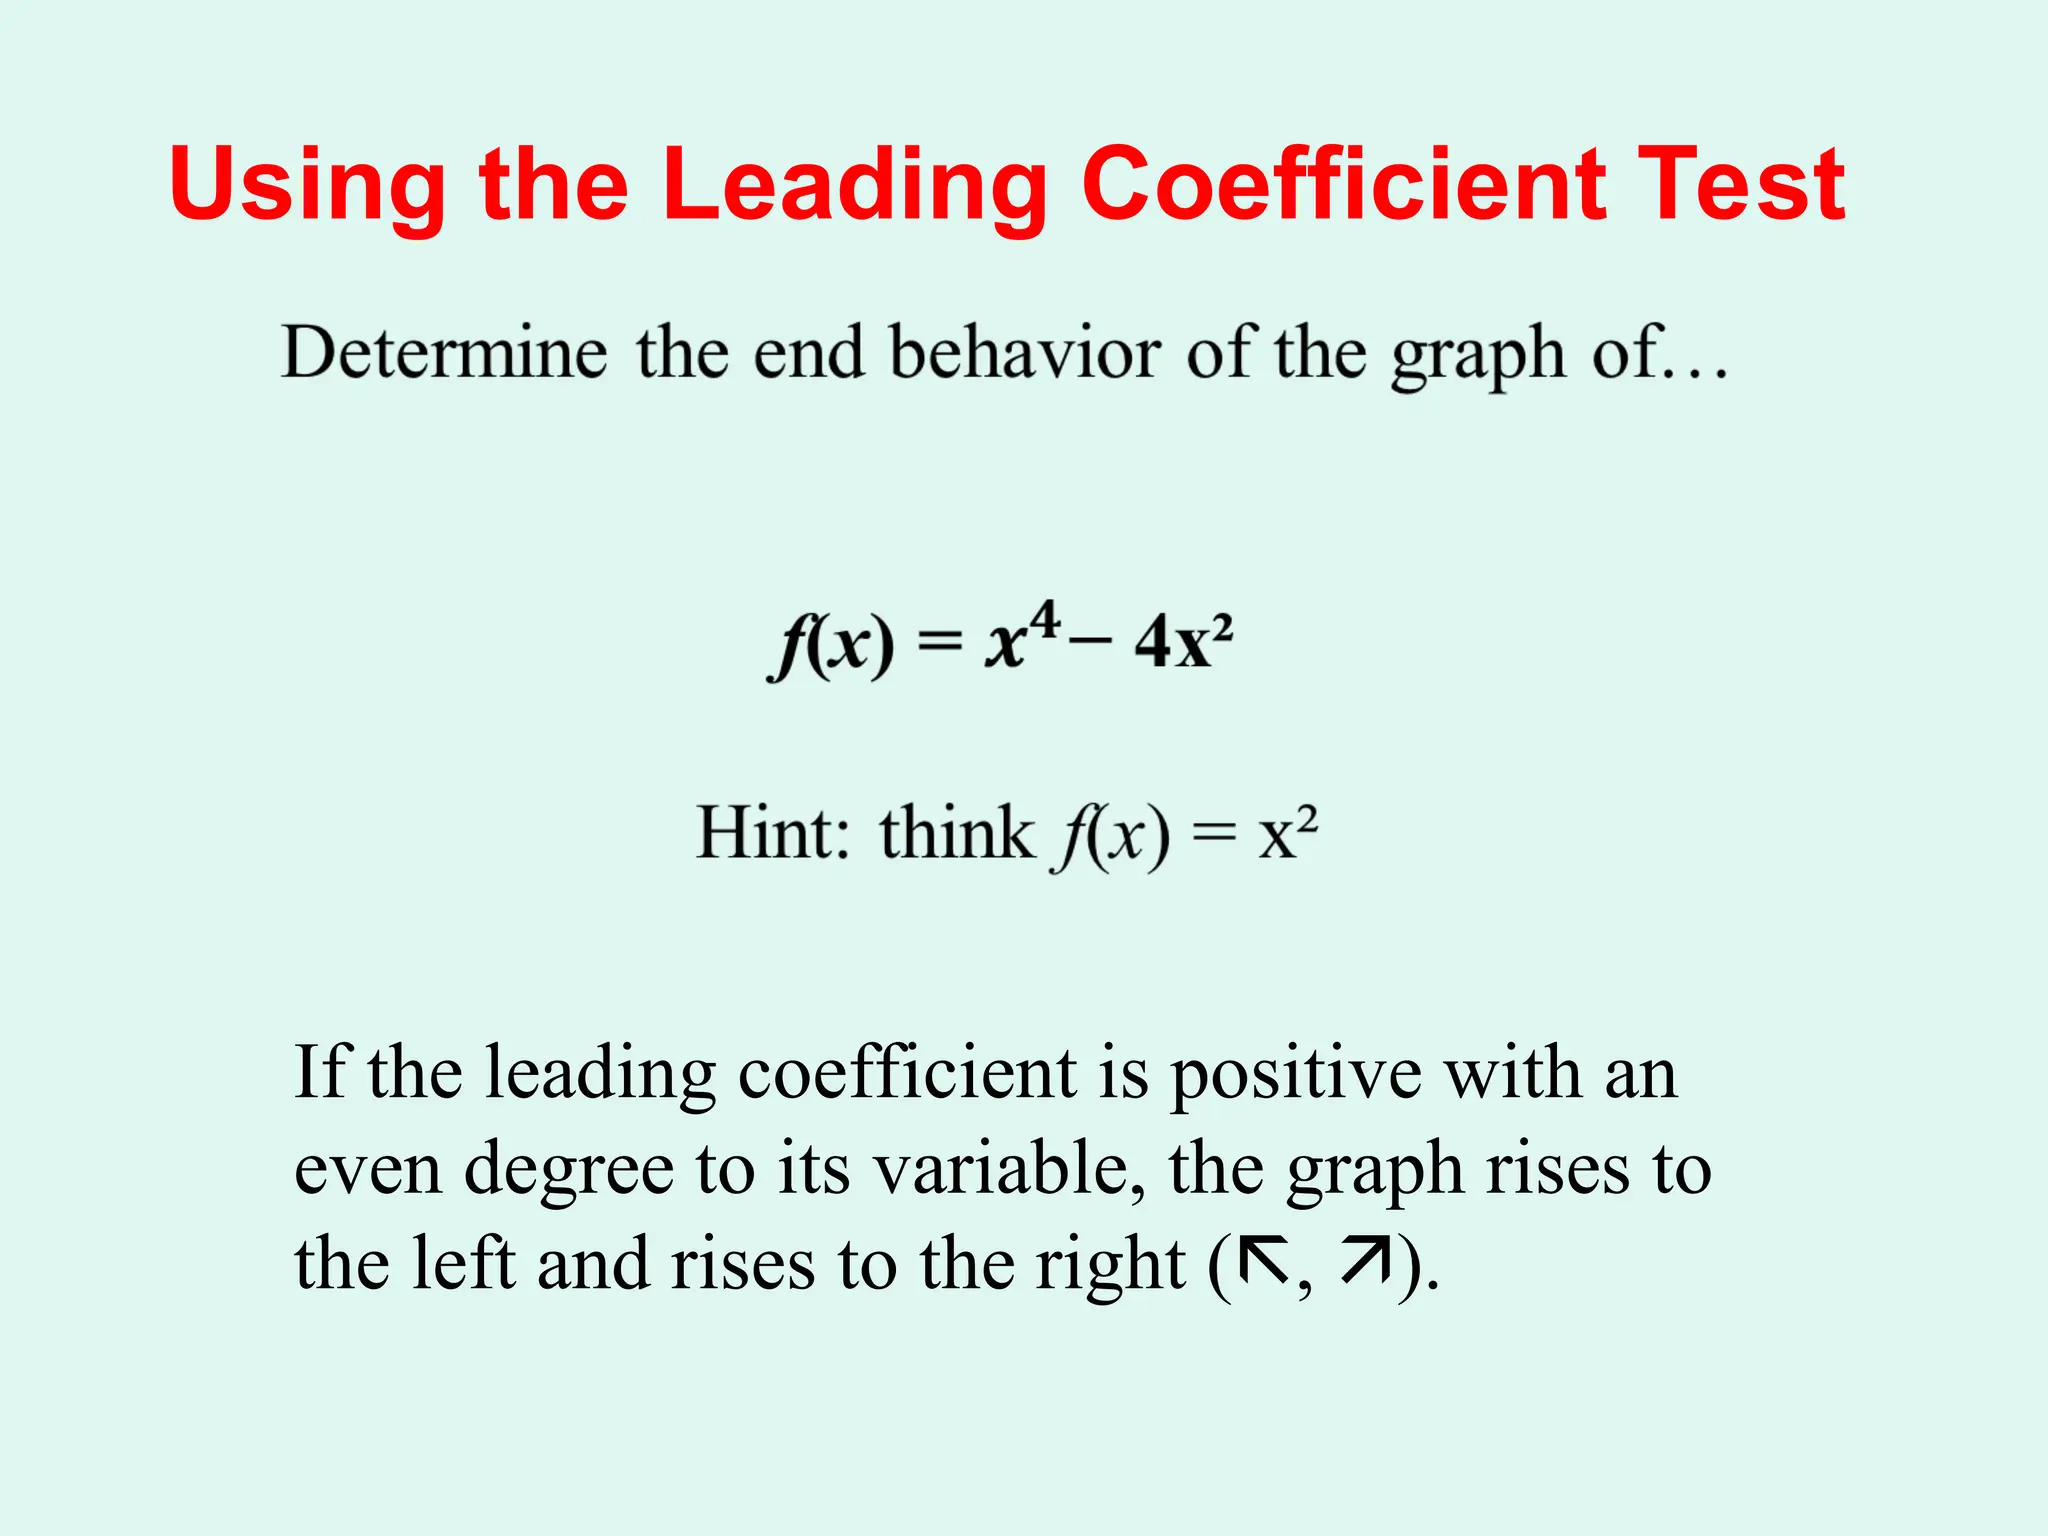
If the leadingcoefficient is positive with an even
degree to its variable, the graph rises to the left and
rises to the right (, ).
Example: f(x) = x²
16.
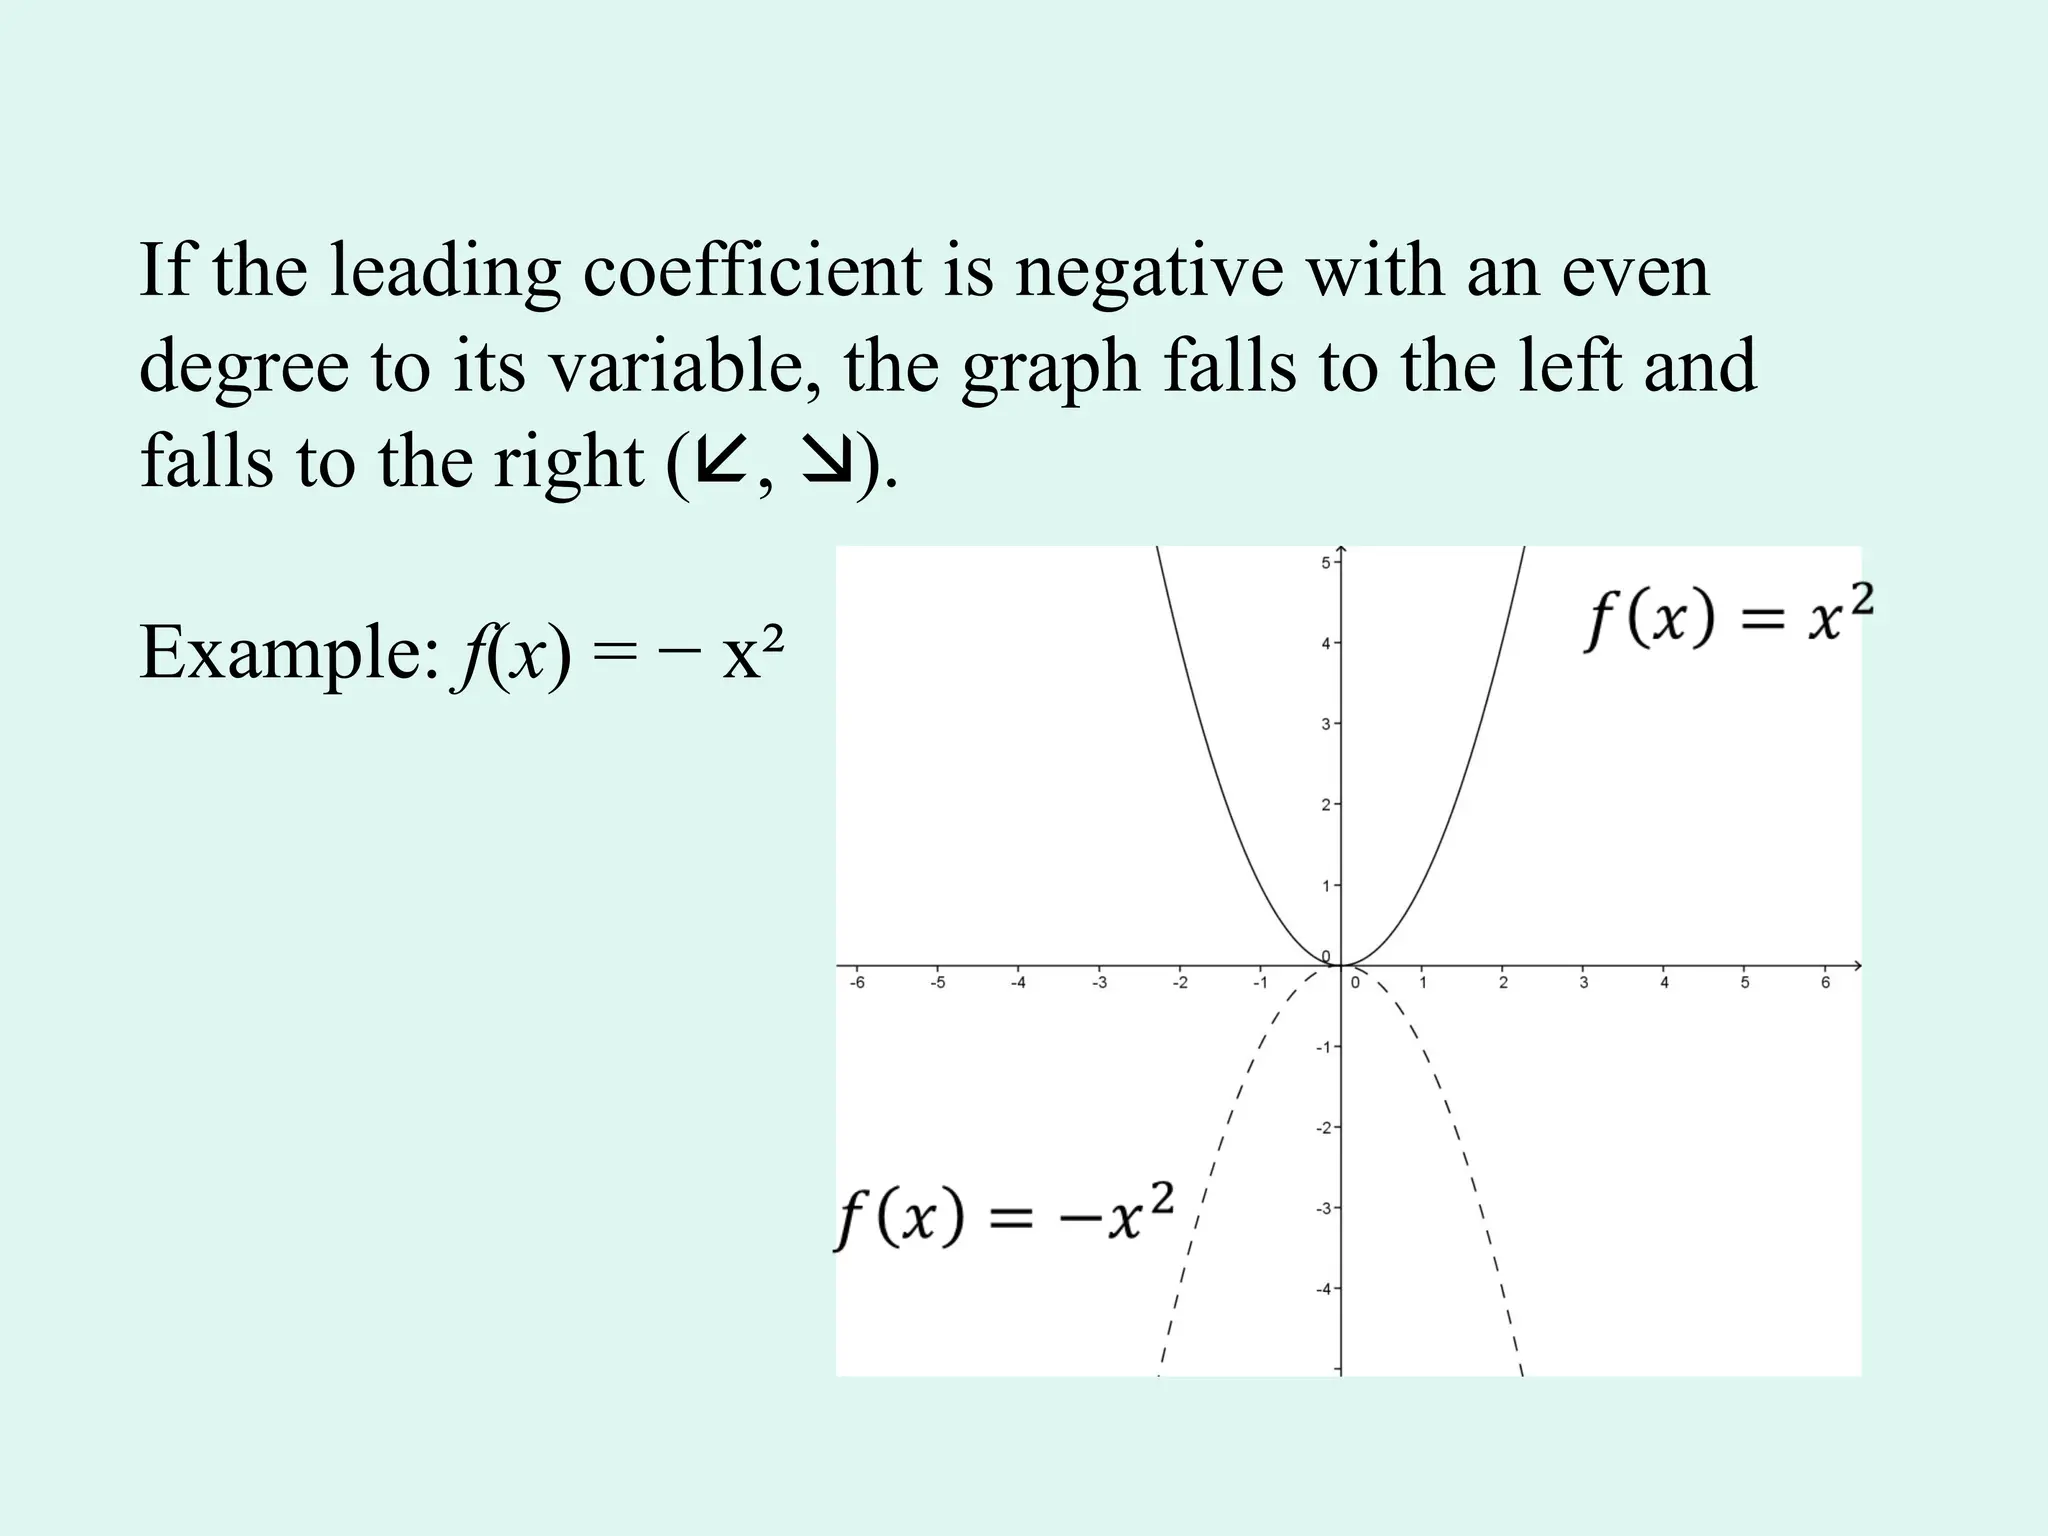
If the leadingcoefficient is negative with an even
degree to its variable, the graph falls to the left and
falls to the right (, ).
Example: f(x) = − x²
17.
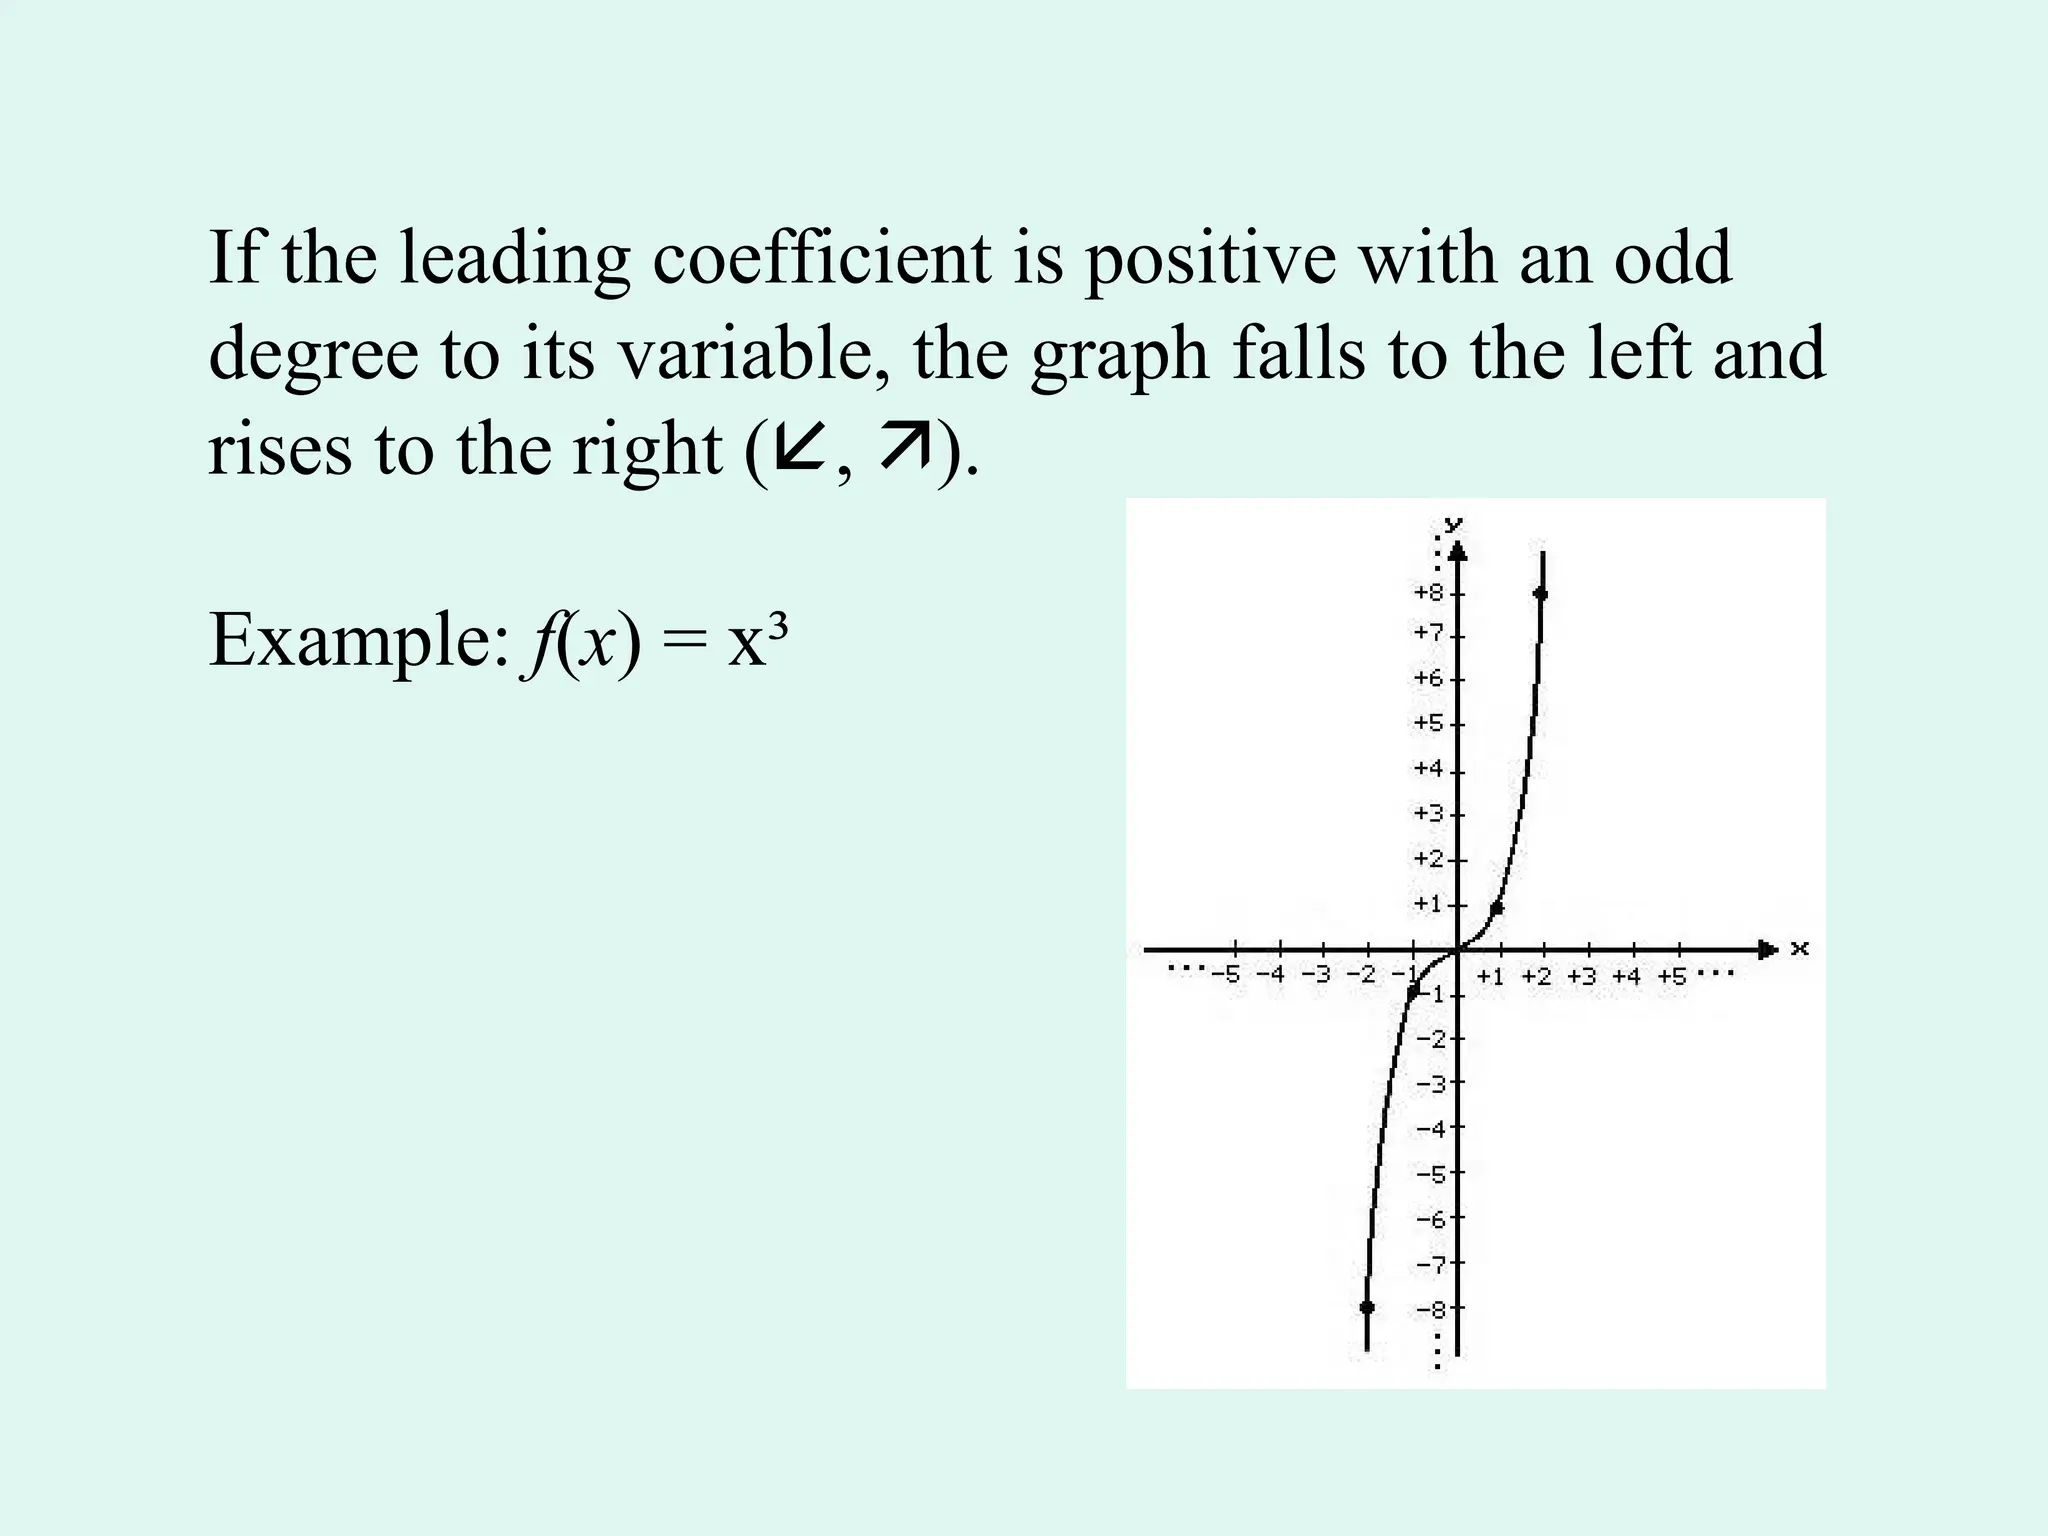
If the leadingcoefficient is positive with an odd
degree to its variable, the graph falls to the left and
rises to the right (, ).
Example: f(x) = x³
18.
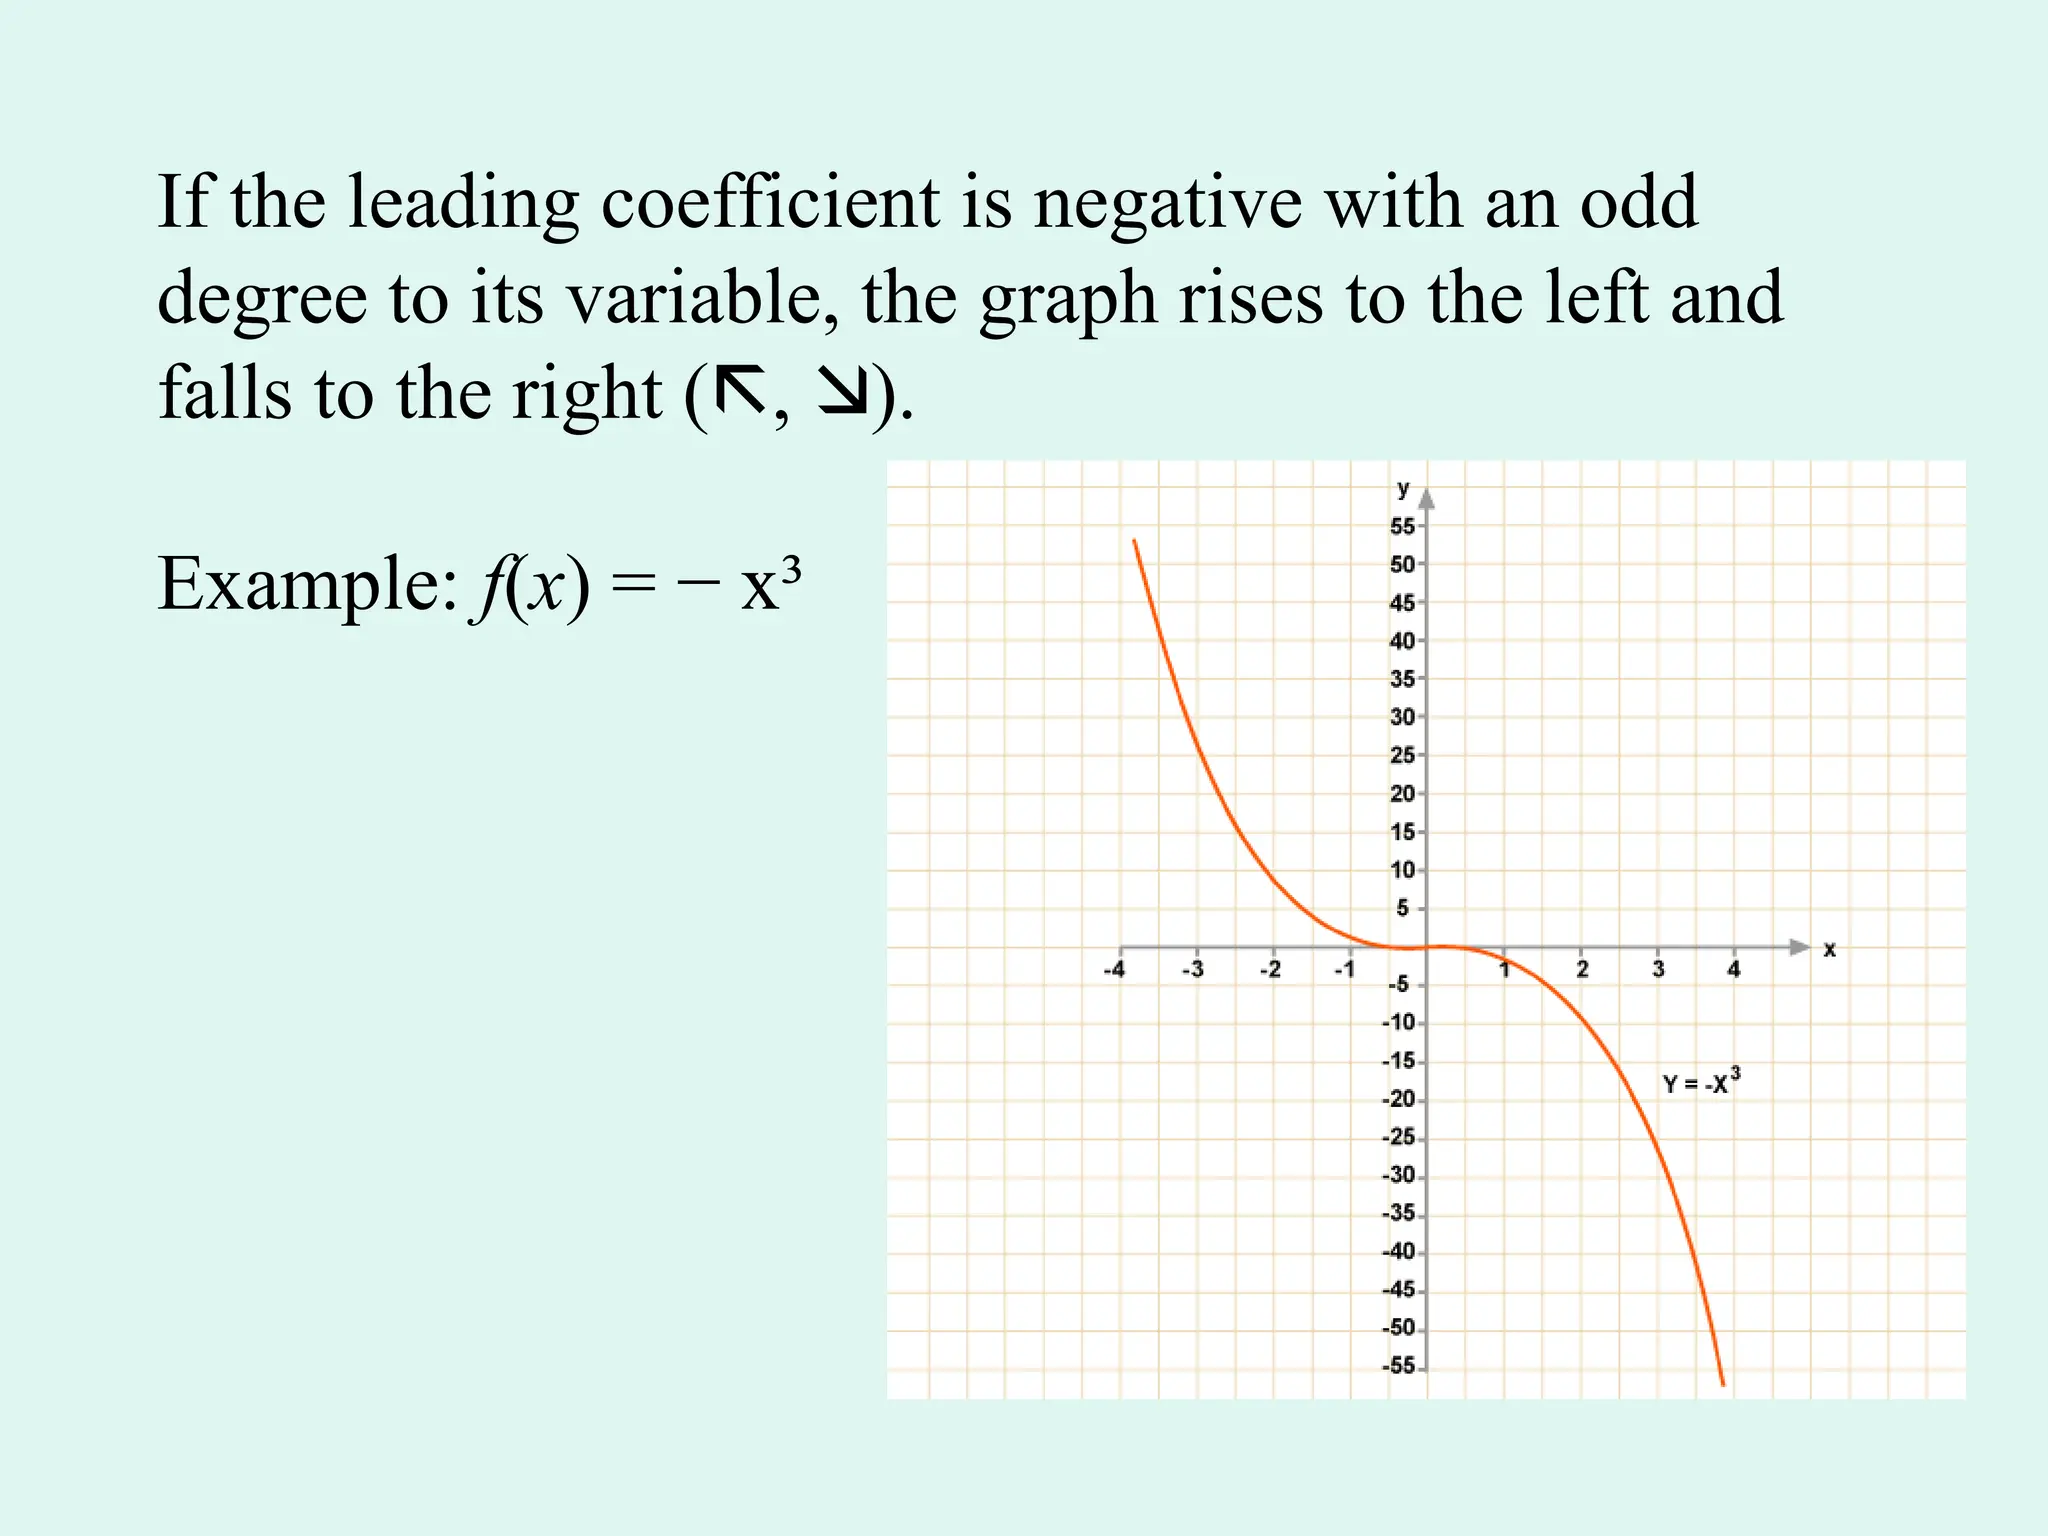
If the leadingcoefficient is negative with an odd
degree to its variable, the graph rises to the left and
falls to the right (, ).
Example: f(x) = − x³
19.
Using the LeadingCoefficient Test
If the leading coefficient is positive with an
even degree to its variable, the graph rises to
the left and rises to the right (, ).
20.
Using the LeadingCoefficient Test
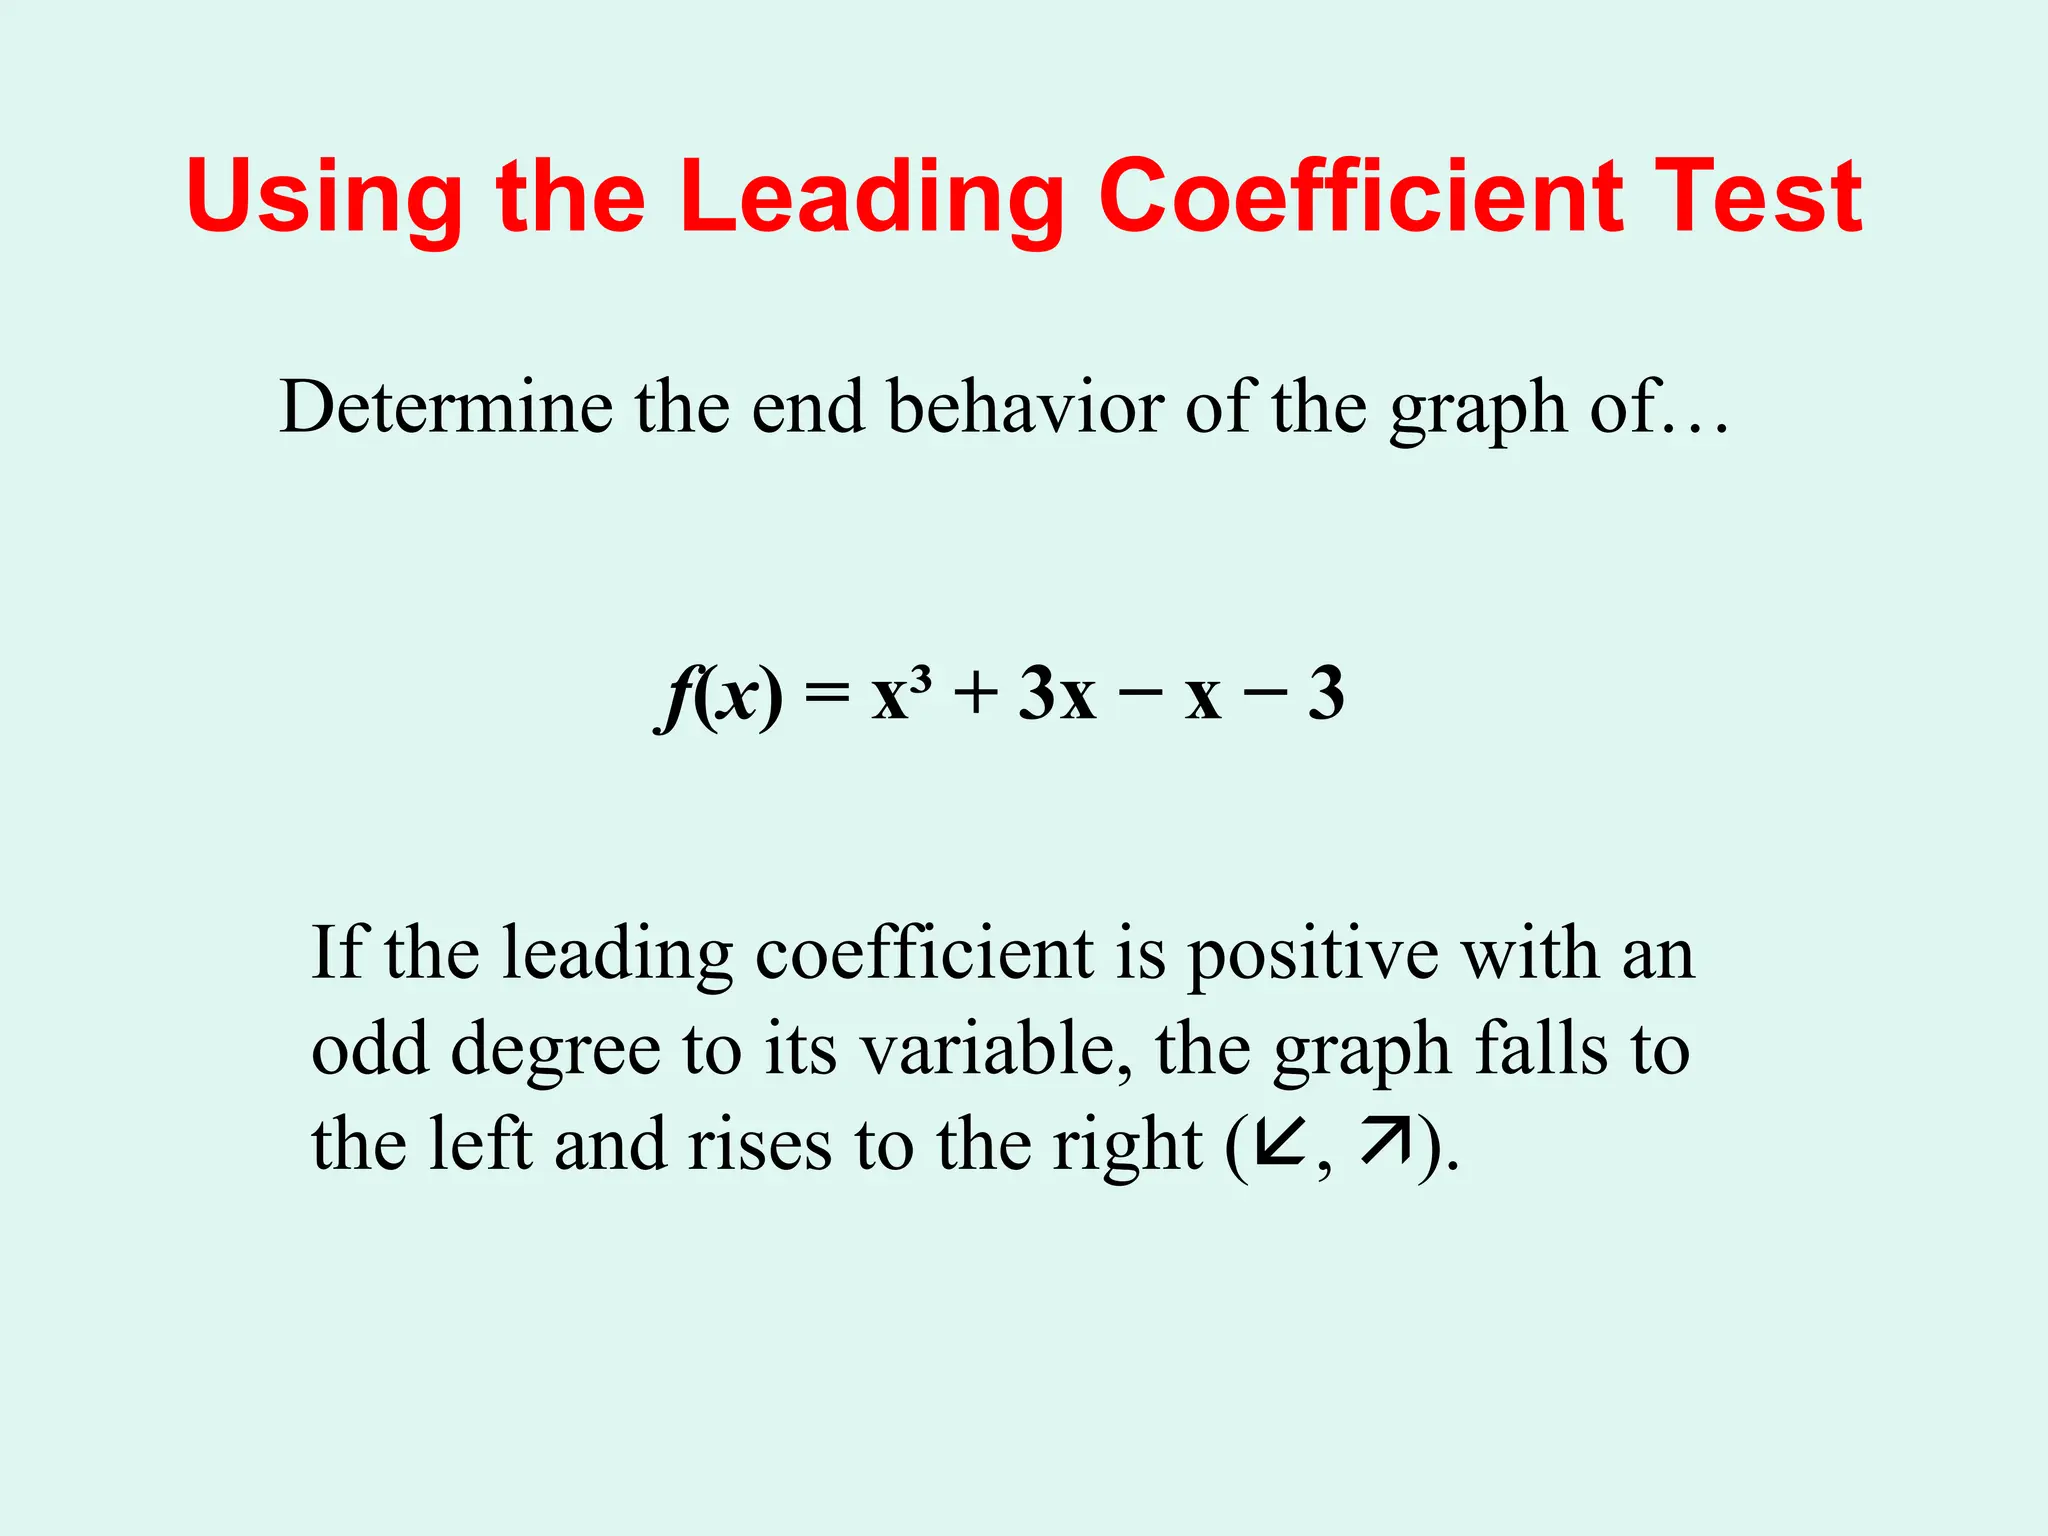
Determine the end behavior of the graph of…
f(x) = x³ + 3x − x − 3
If the leading coefficient is positive with an
odd degree to its variable, the graph falls to
the left and rises to the right (, ).
21.
Using the LeadingCoefficient Test
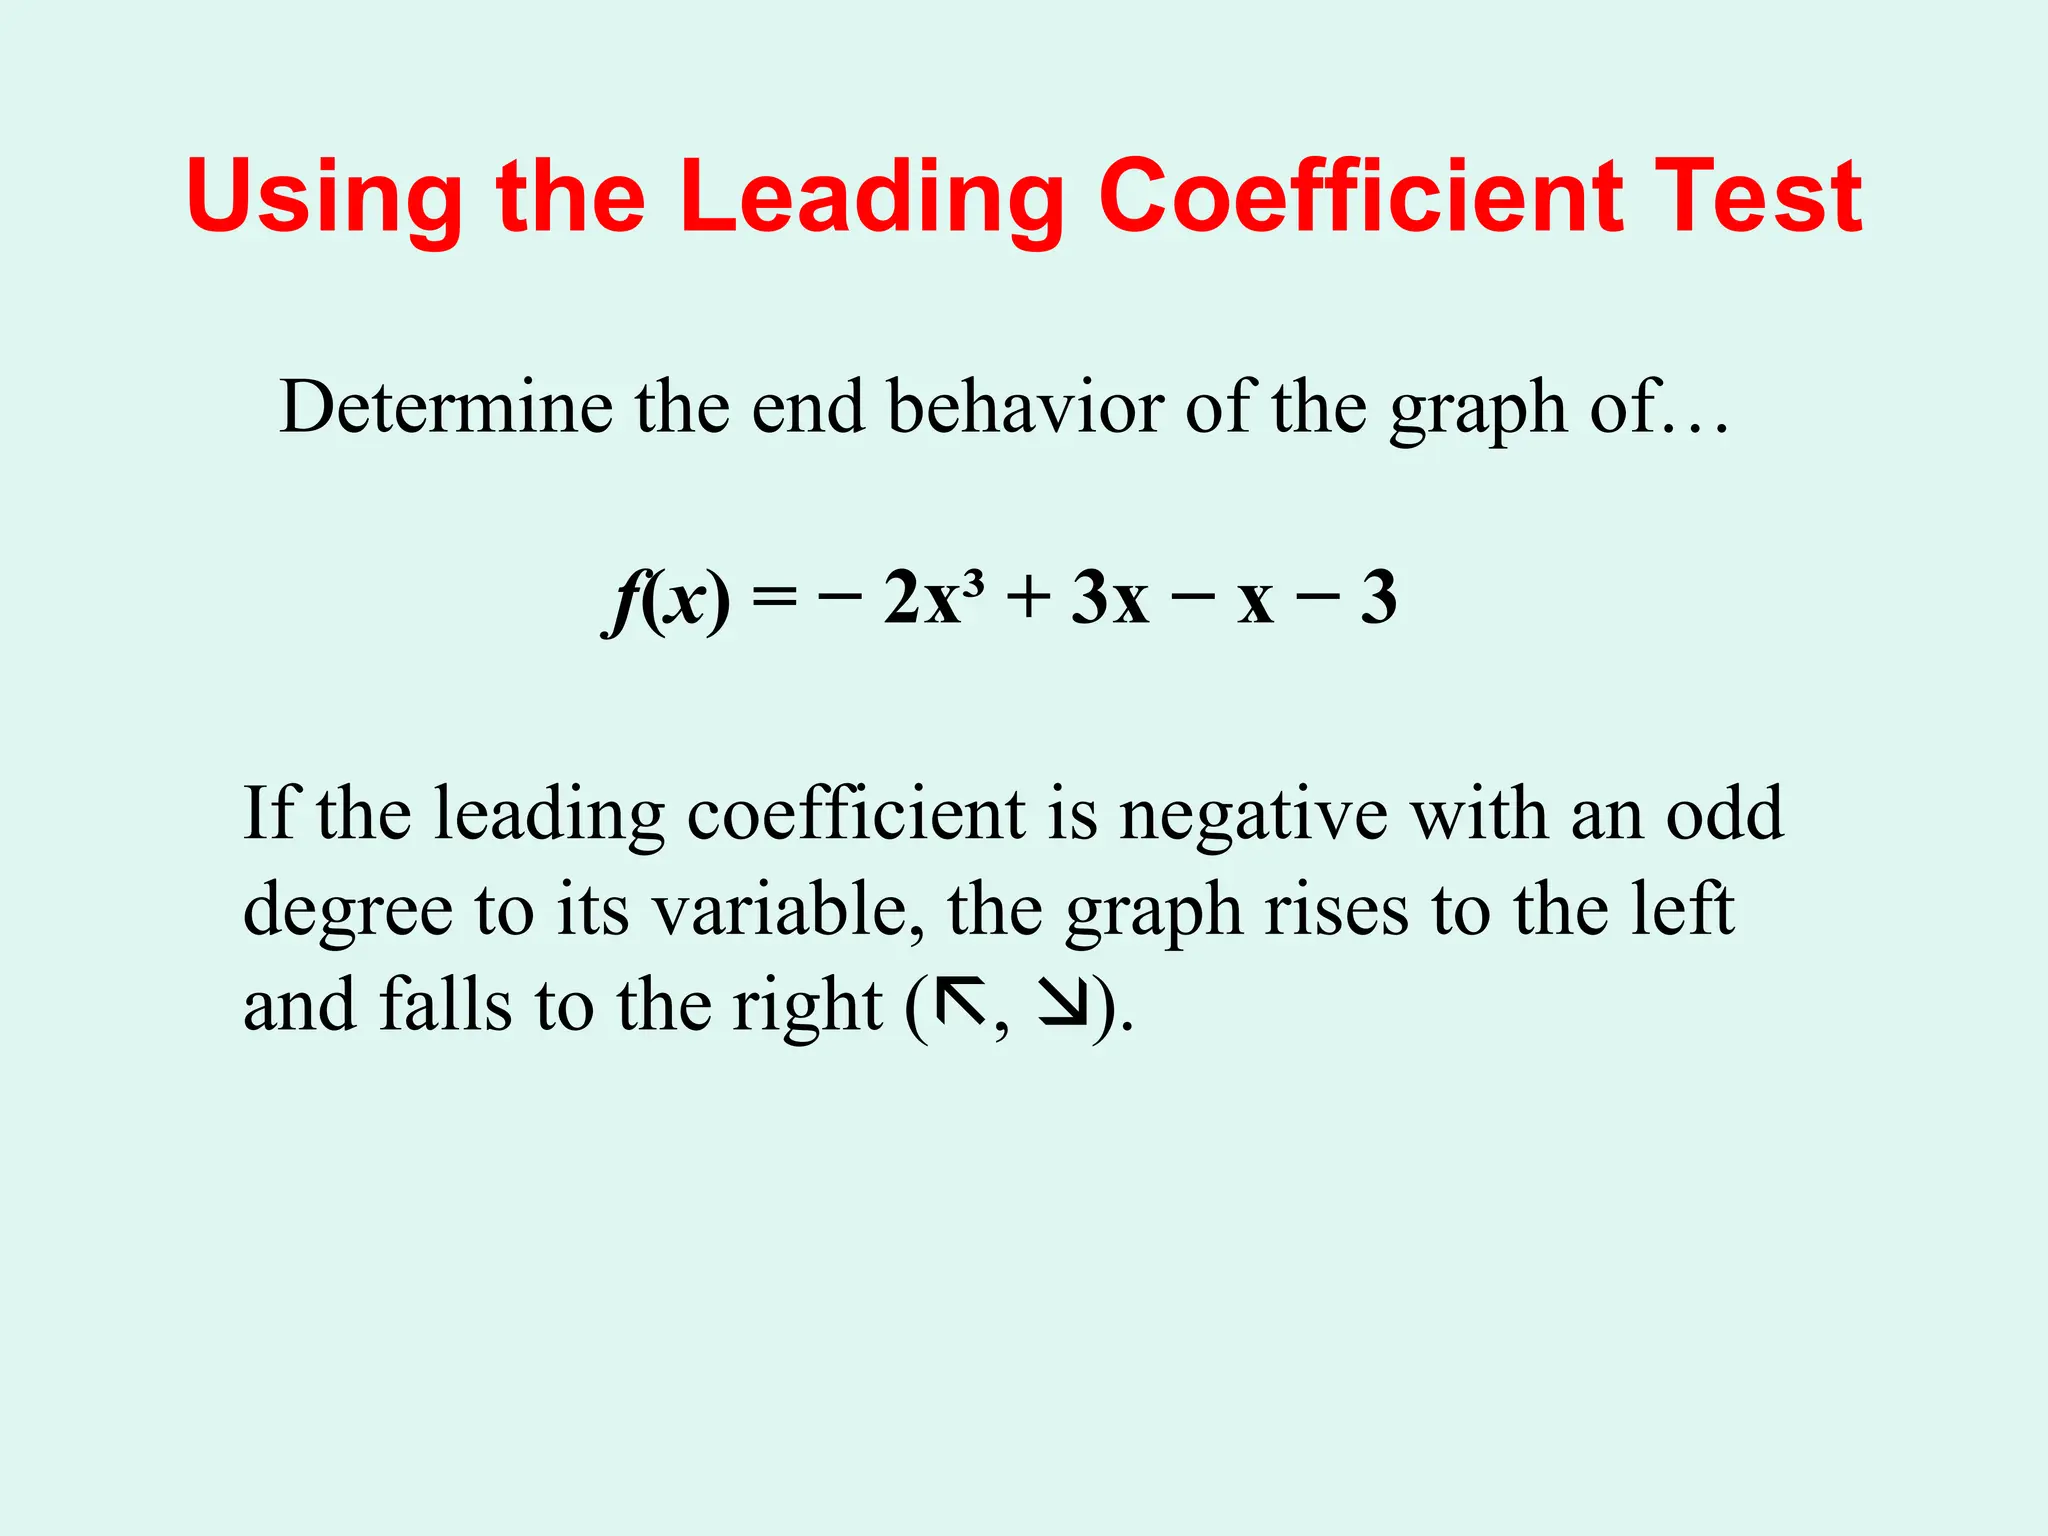
Determine the end behavior of the graph of…
f(x) = − 2x³ + 3x − x − 3
If the leading coefficient is negative with an odd
degree to its variable, the graph rises to the left
and falls to the right (, ).
22.
Using the LeadingCoefficient Test
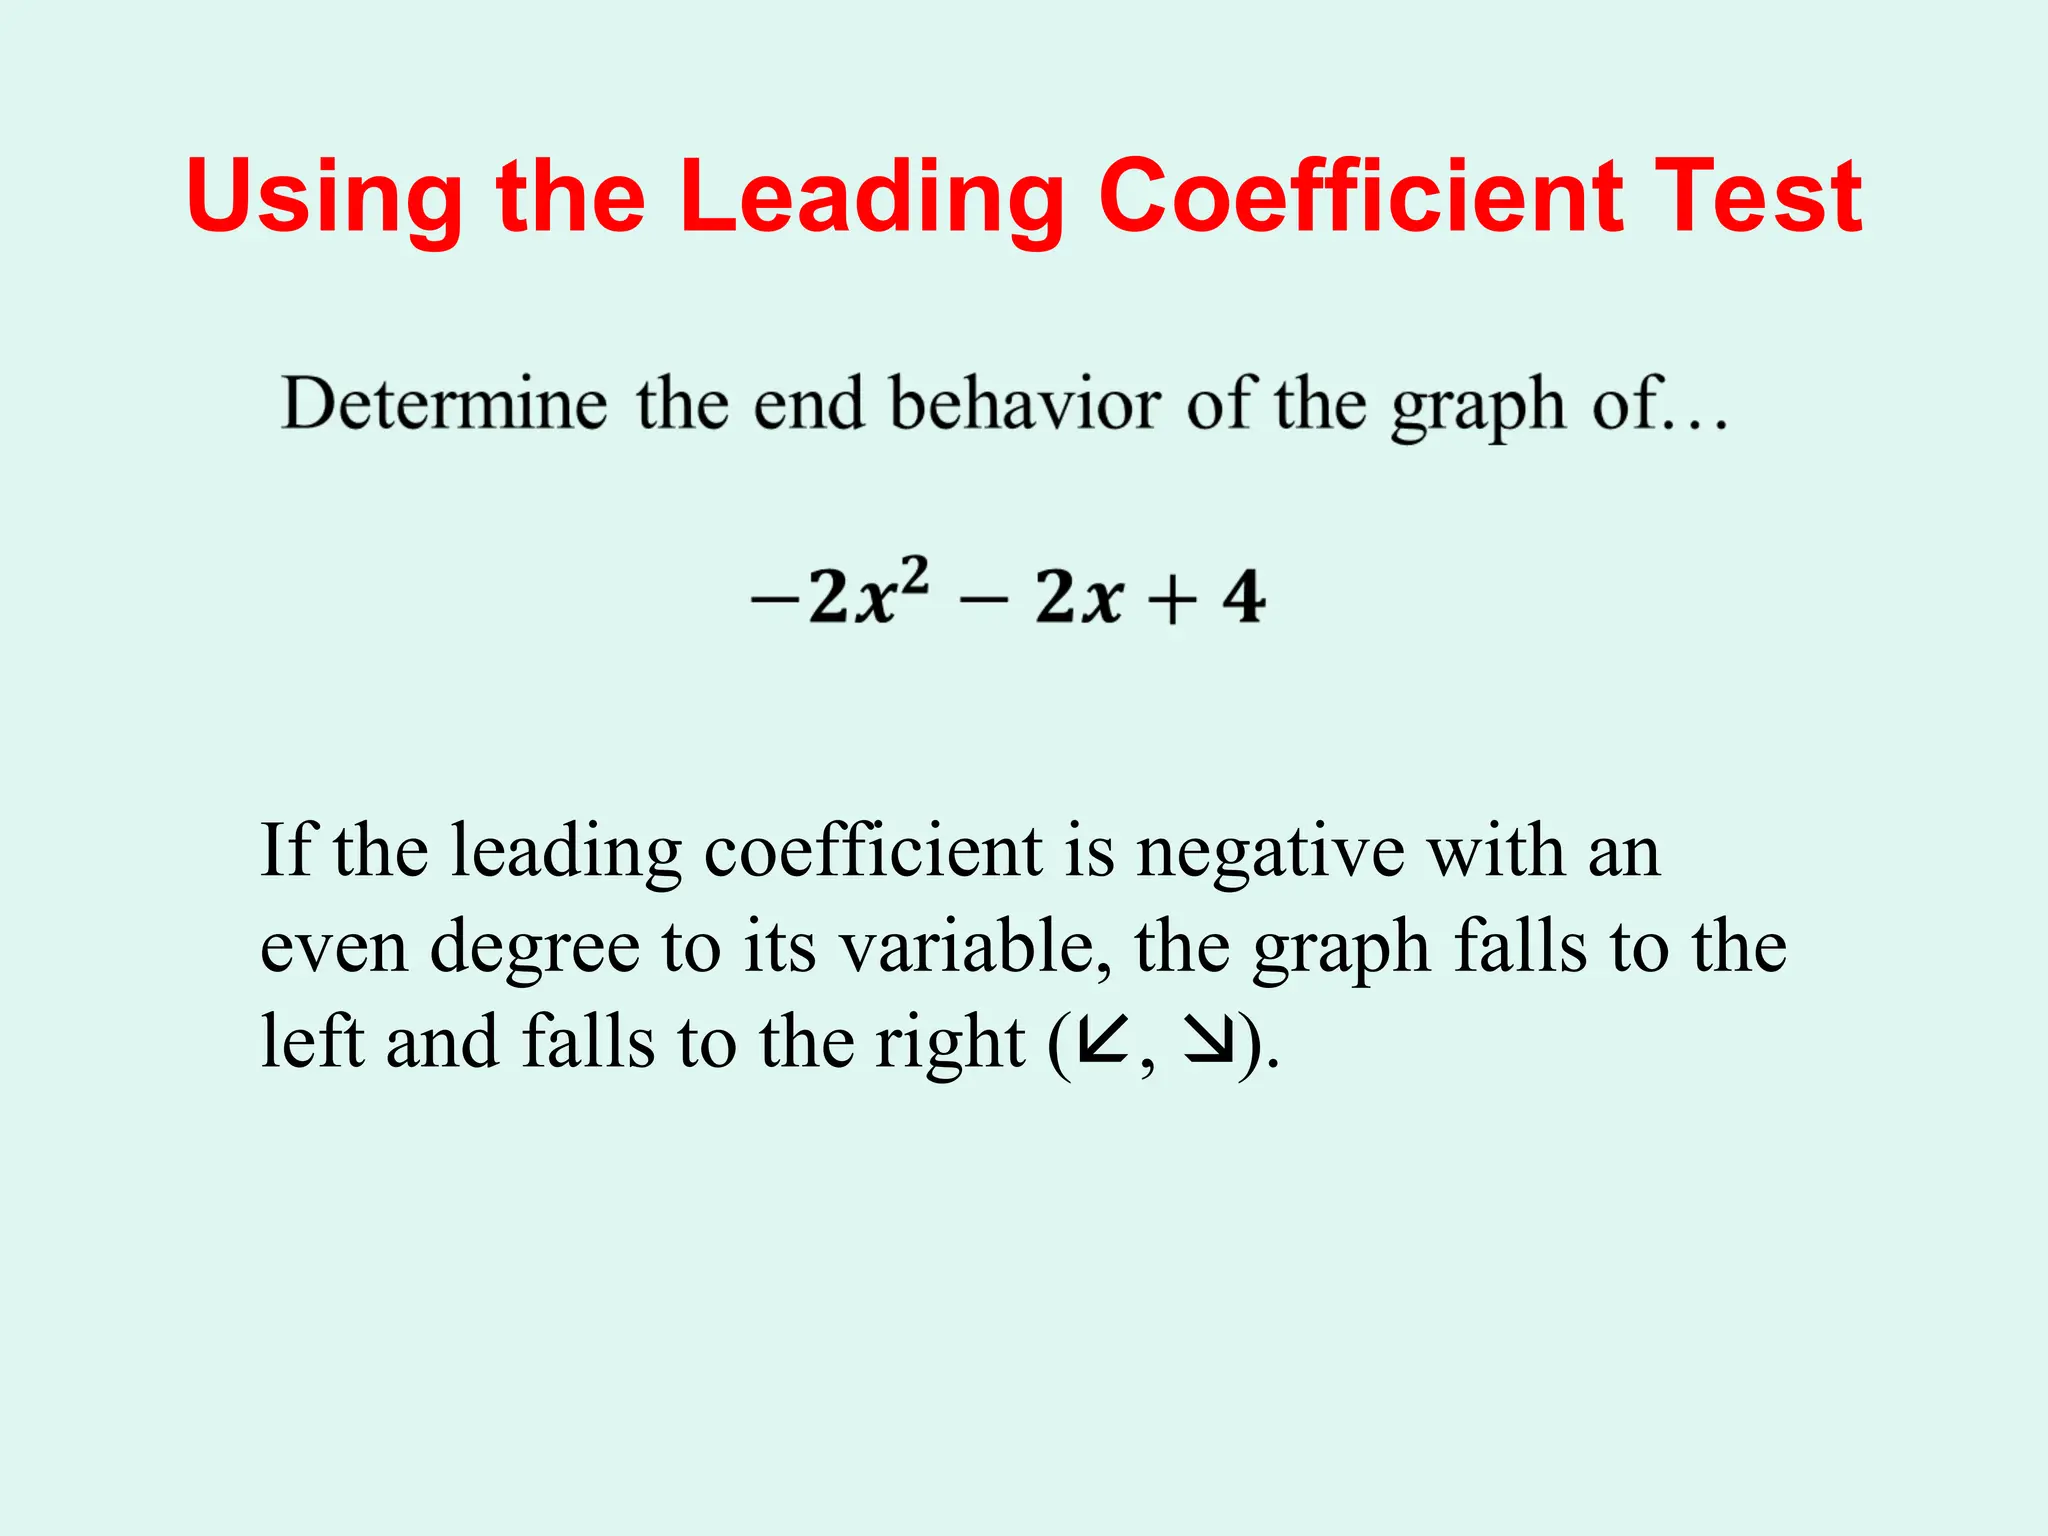
If the leading coefficient is negative with an
even degree to its variable, the graph falls to the
left and falls to the right (, ).
23.
Using the LeadingCoefficient Test
Determine the end behavior of the graph of…
f(x) = 3x³(x − 1)(x + 5)
Because these terms and expressions are each
multiplied by each other, we add their degrees.
3 + 1 + 1 = 5
If the leading coefficient is positive with an odd
degree to its variable, the graph falls to the left and
rises to the right (, ).
24.
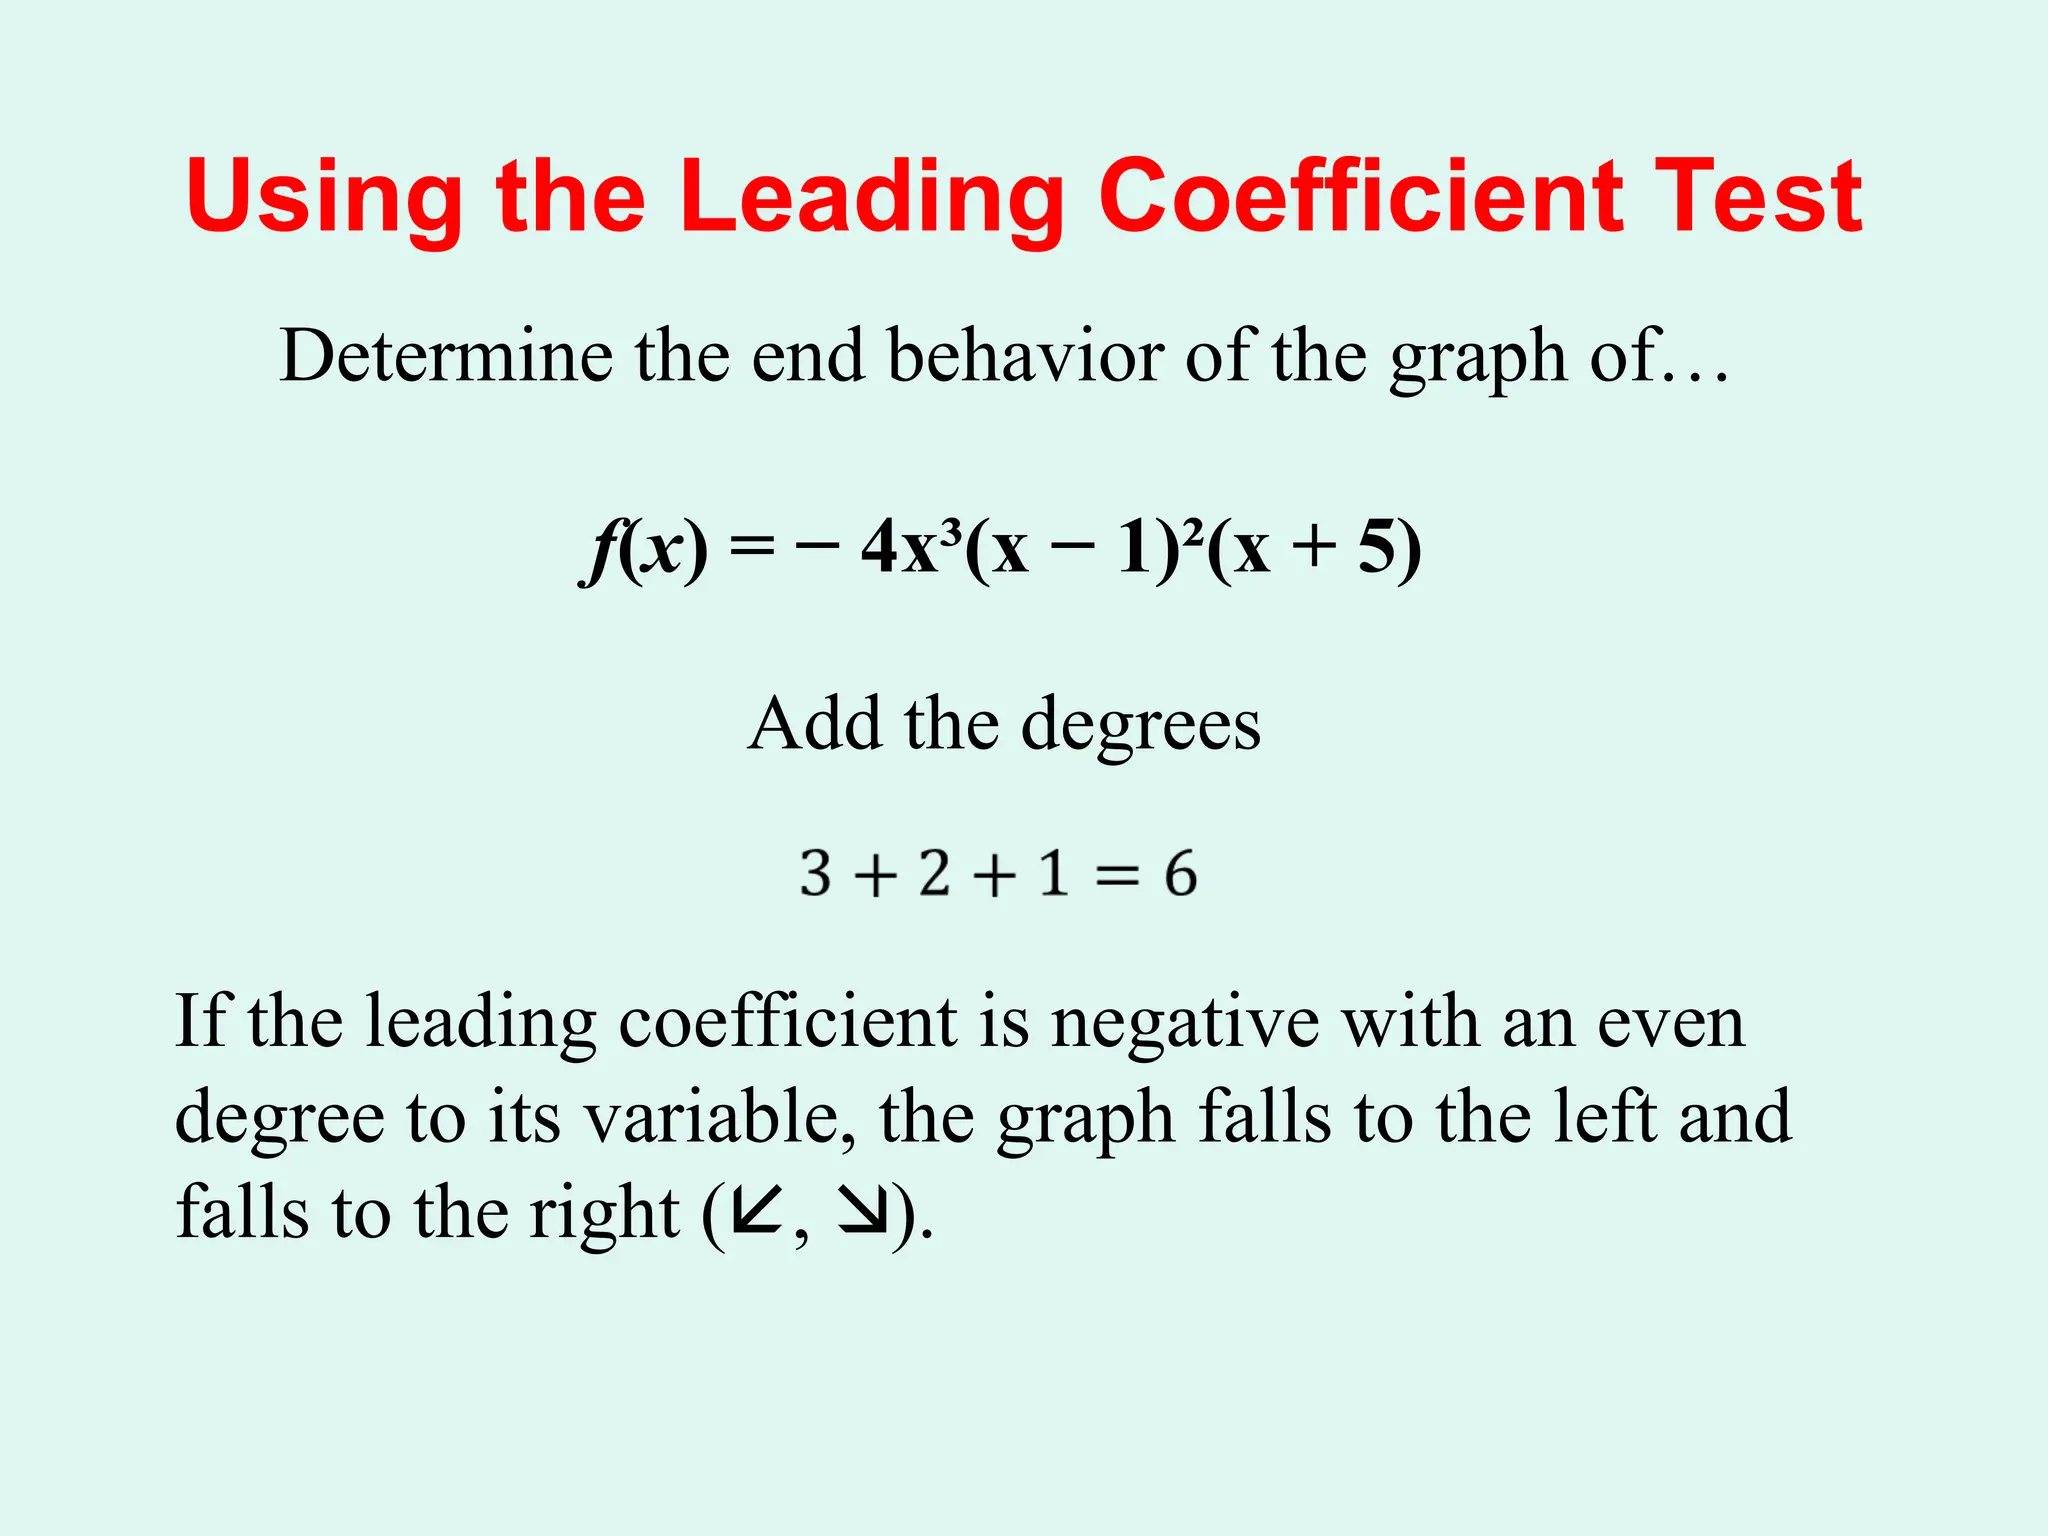
Using the LeadingCoefficient Test
Determine the end behavior of the graph of…
f(x) = − 4x³(x − 1)²(x + 5)
Add the degrees
If the leading coefficient is negative with an even
degree to its variable, the graph falls to the left and
falls to the right (, ).
25.
Zeros of PolynomialFunctions
• It can be shown that for a polynomial function of
degree n, the following statements are true:
• 1. The function has, at most, n real zeros.
• 2. The graph has, at most, n – 1 turning points.
• Turning points (relative maximum or relative
minimum) are points at which the graph changes
from increasing to decreasing or vice versa.
26.
Zeros of PolynomialFunctions
The zeros of a polynomial function are the values of x which
make f(x) = 0. These values are the roots, or solutions of the
polynomial equation when y = 0. All real roots are the x-
intercepts of the graph.
How many turning points does f(x) = x³ + 3x² − x − 3 have?
Find all the zeros of… f(x) = x³ + 3x² − x − 3
Set up the equation: x³ + 3x² − x − 3 = 0 and solve.
27.
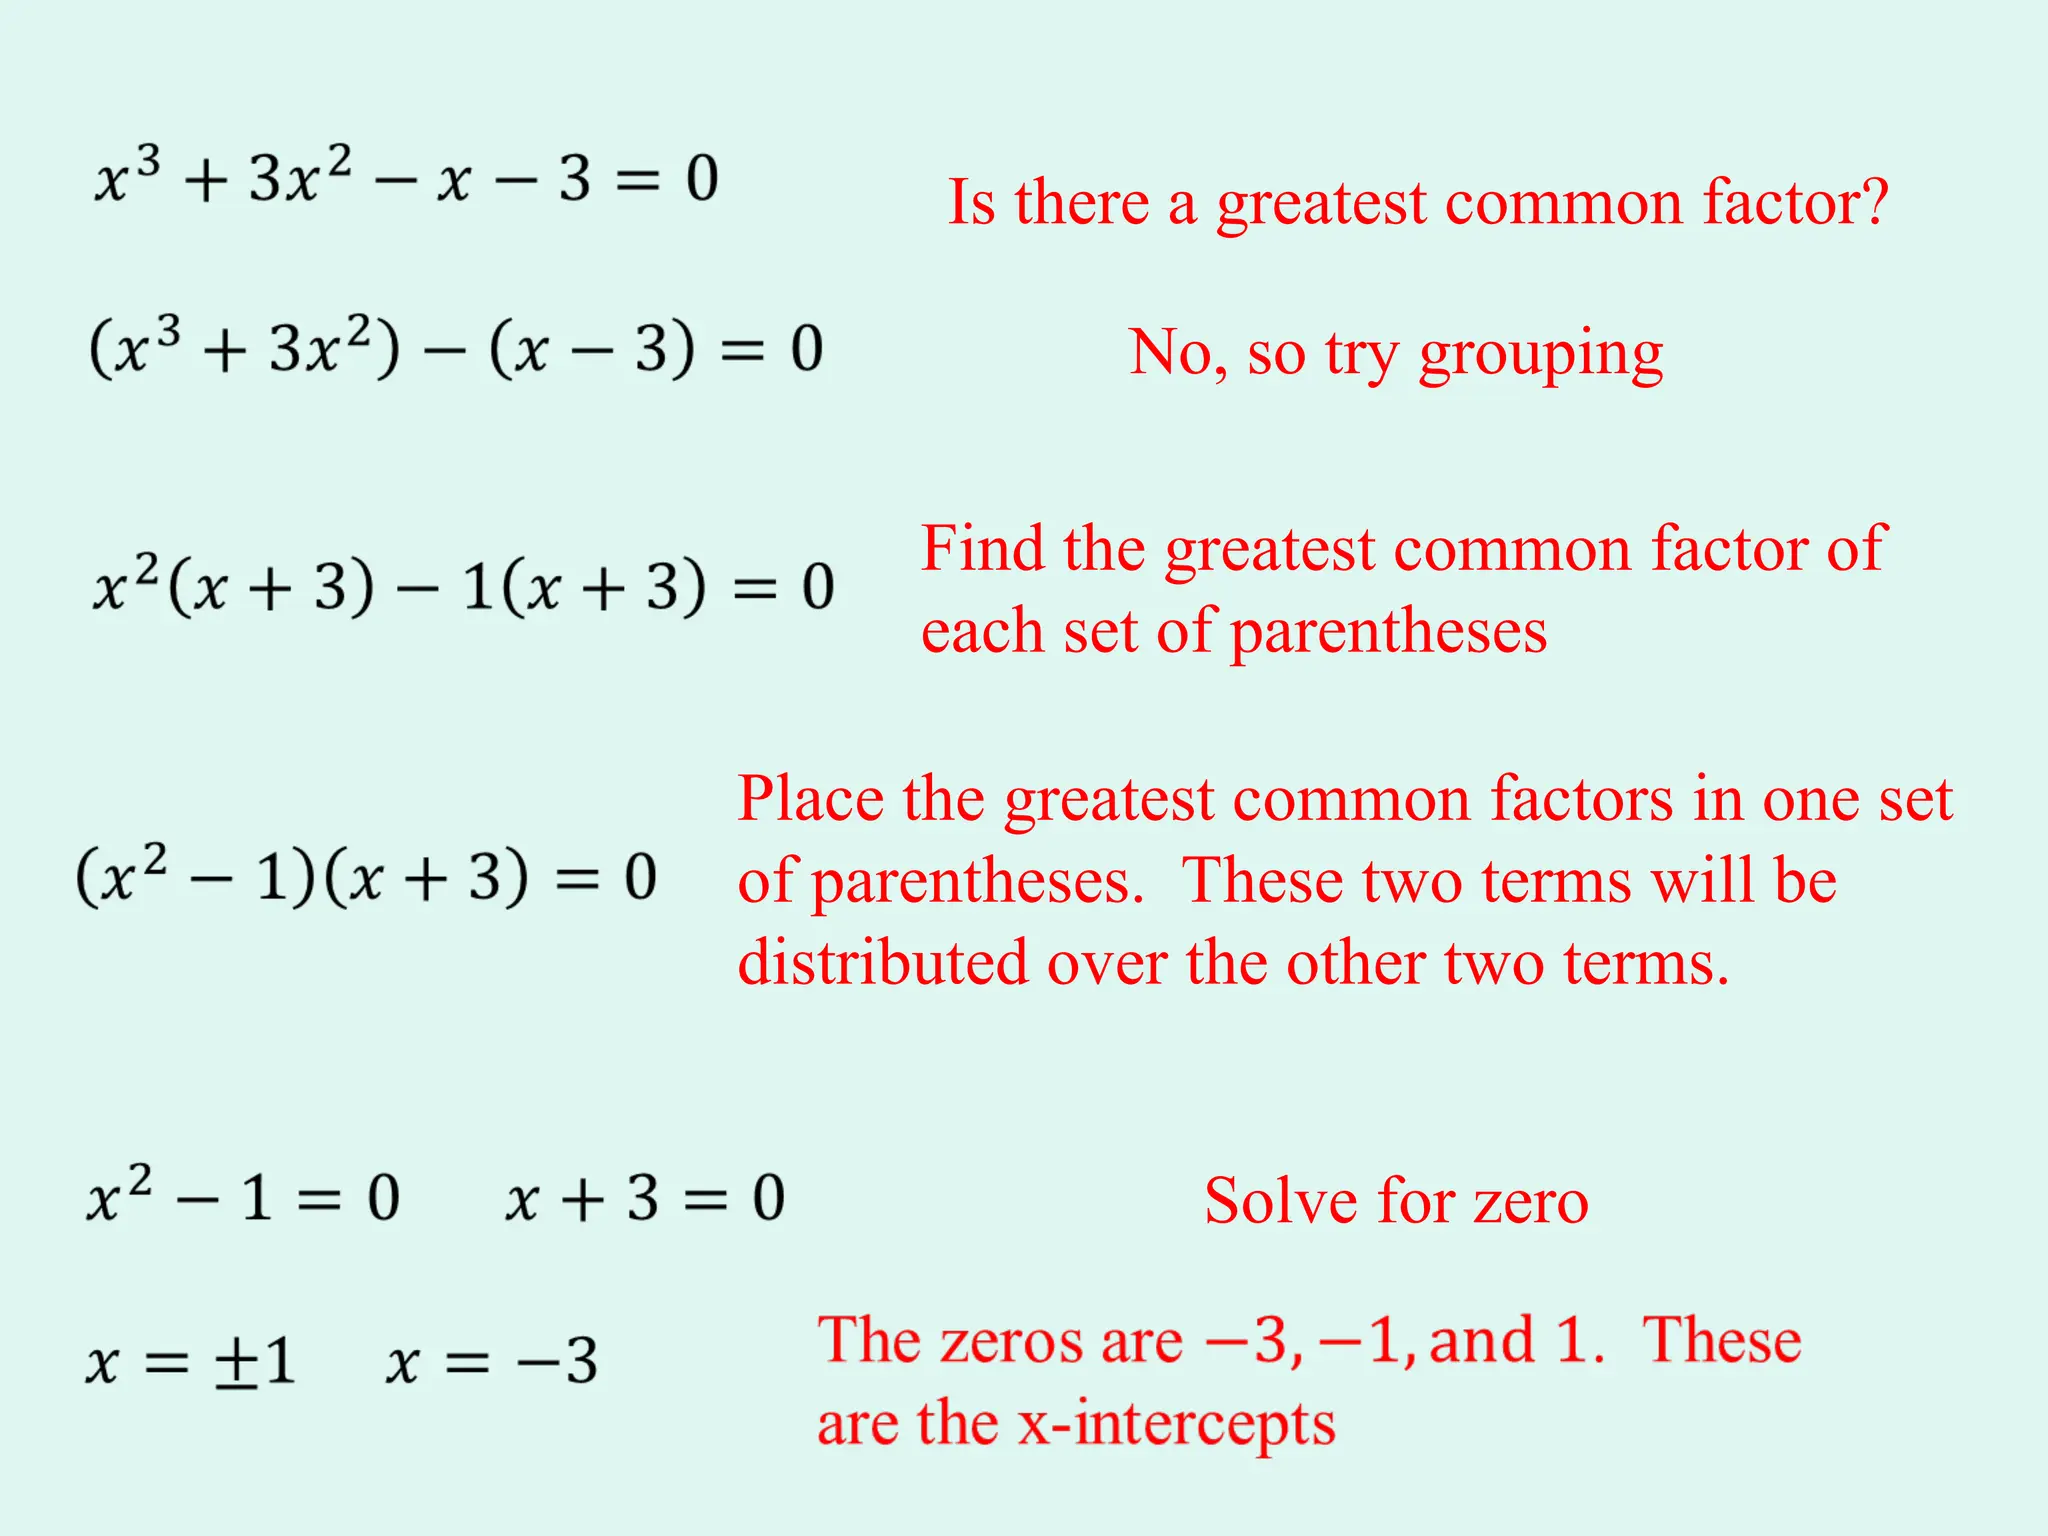
No, so trygrouping
Find the greatest common factor of
each set of parentheses
Place the greatest common factors in one set
of parentheses. These two terms will be
distributed over the other two terms.
Is there a greatest common factor?
Solve for zero
28.
y
x
–2
2
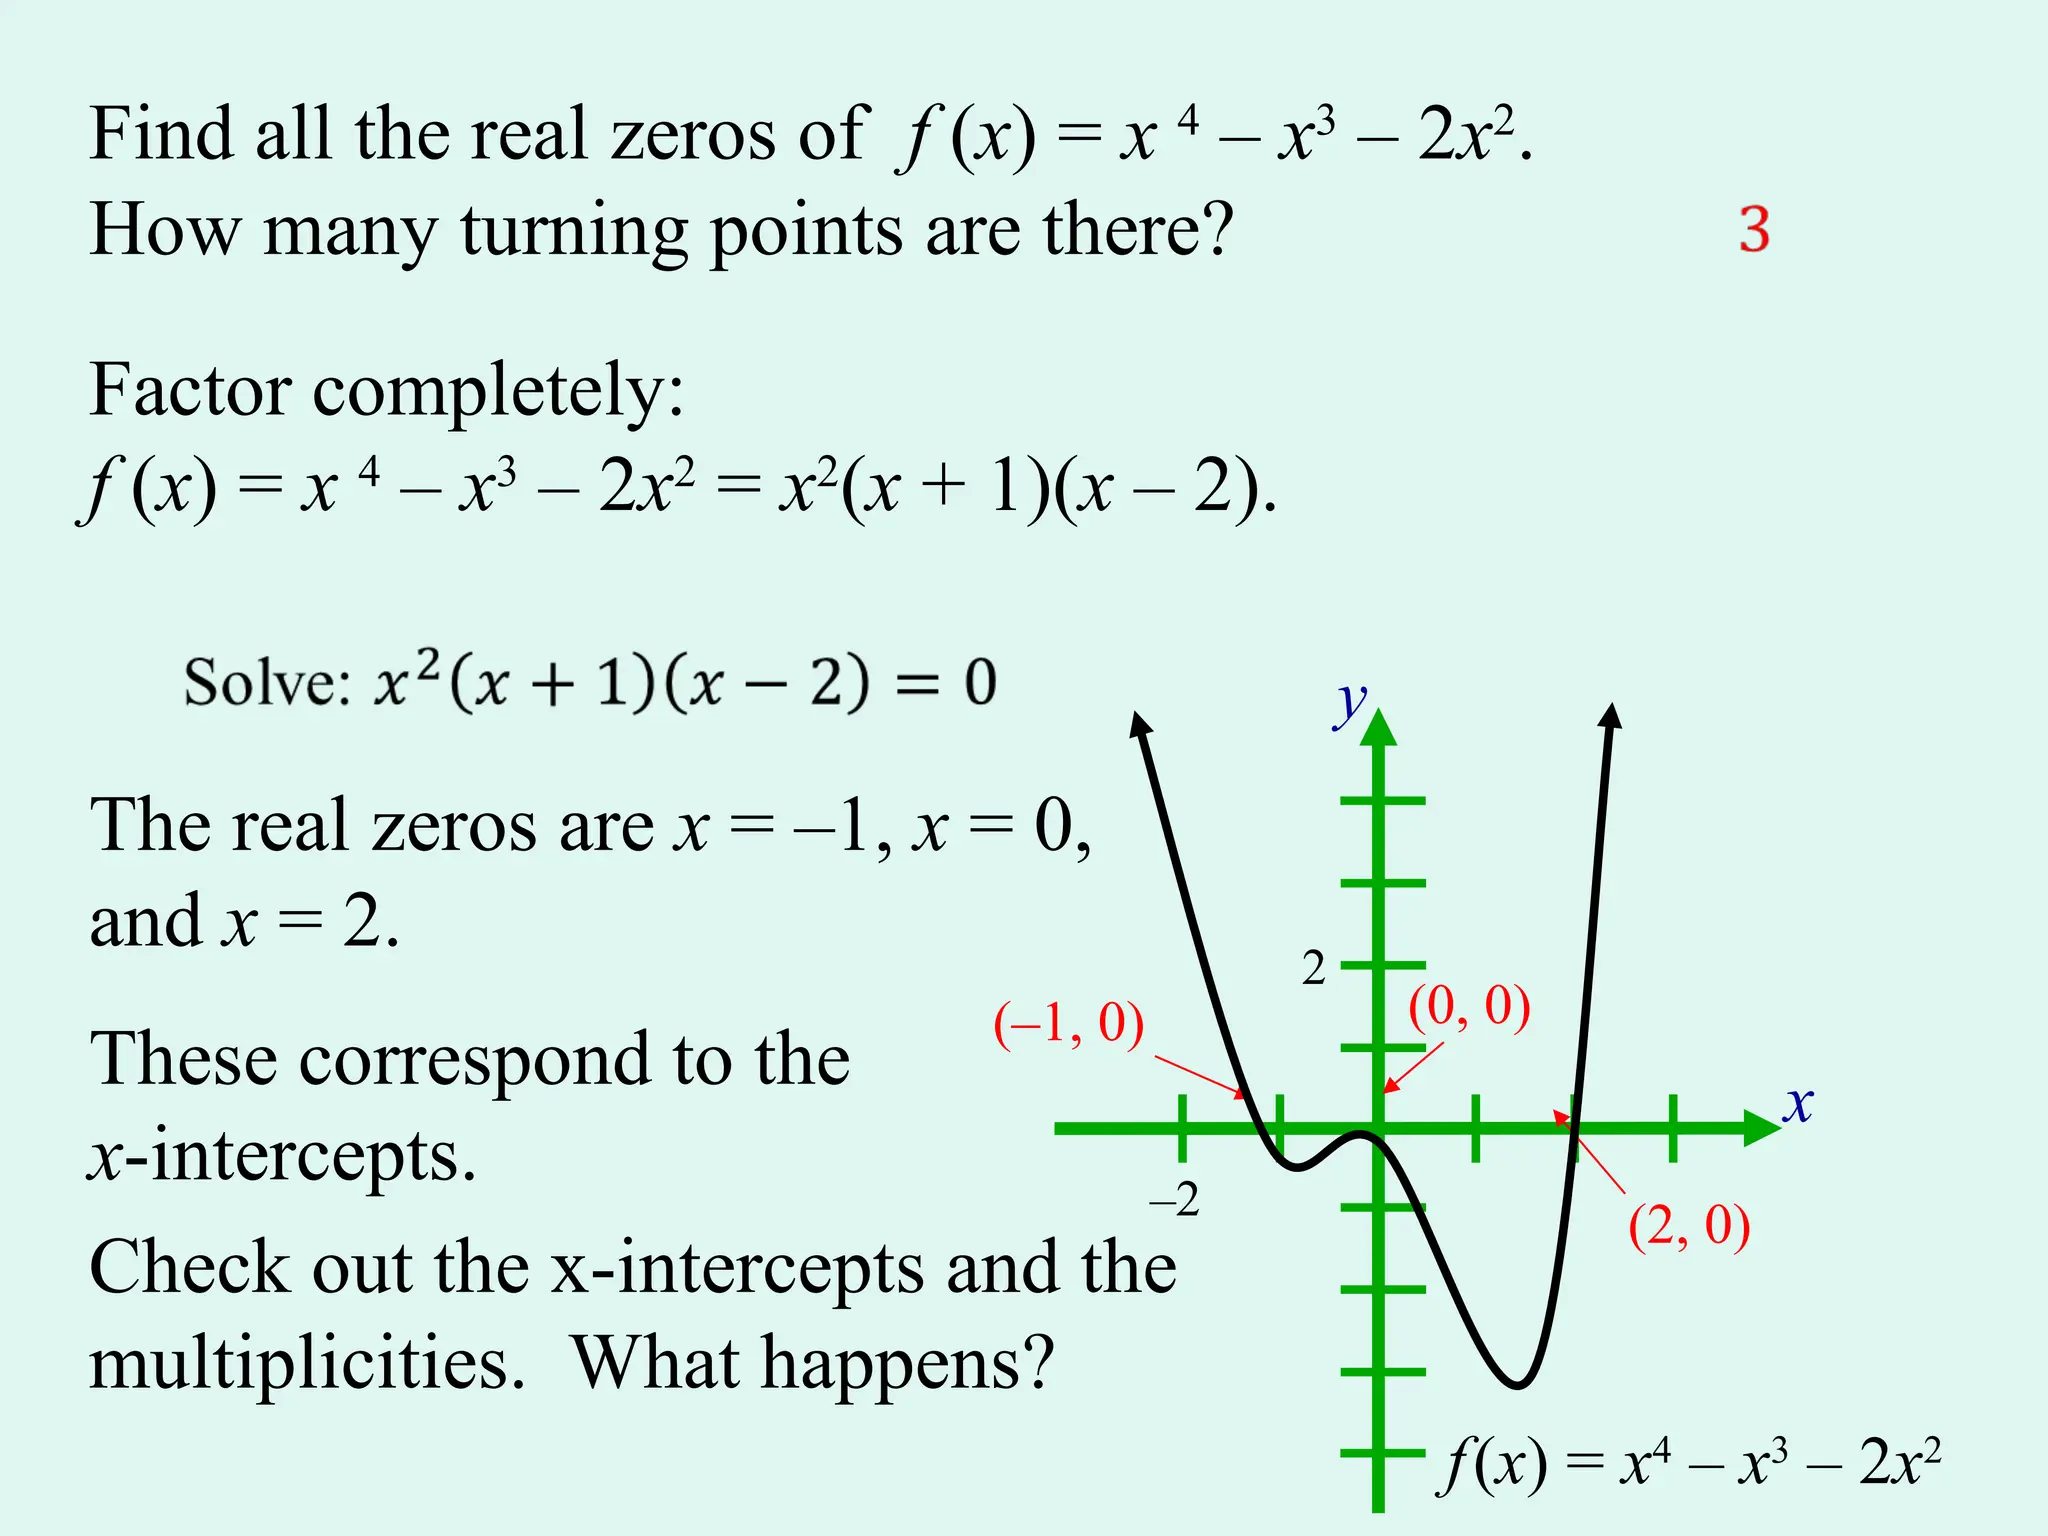
Find all thereal zeros of f (x) = x 4
– x3
– 2x2
.
How many turning points are there?
Factor completely:
f (x) = x 4
– x3
– 2x2
= x2
(x + 1)(x – 2).
The real zeros are x = –1, x = 0,
and x = 2.
These correspond to the
x-intercepts.
(–1, 0) (0, 0)
(2, 0)
f(x) = x4
– x3
– 2x2
Check out the x-intercepts and the
multiplicities. What happens?
29.
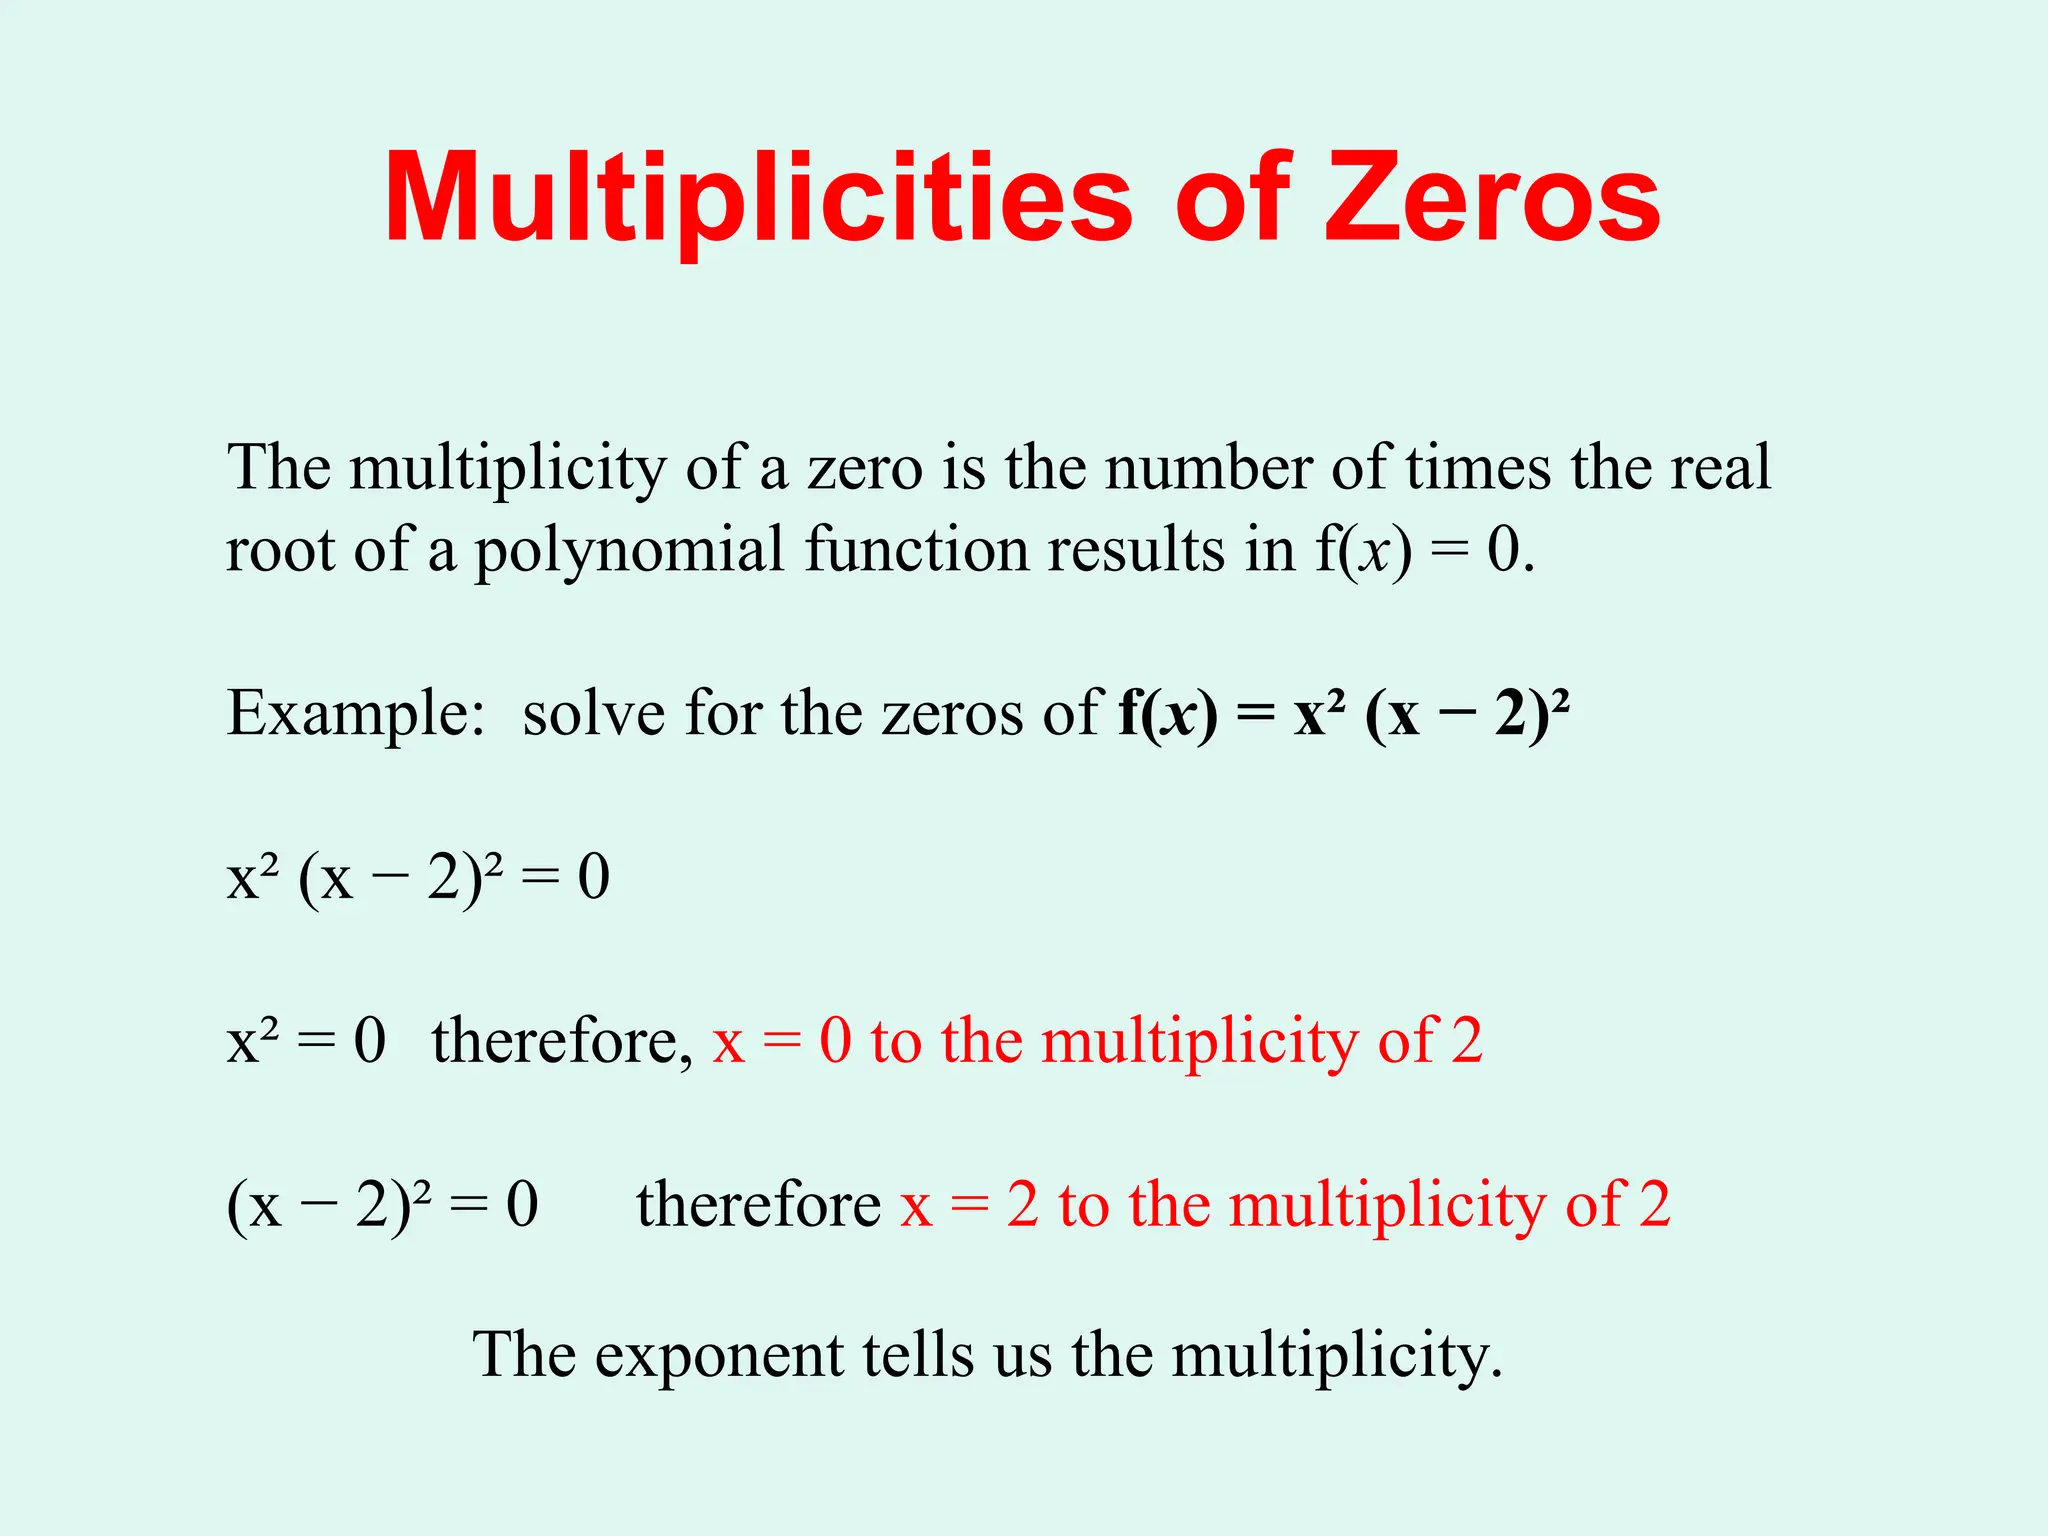
Multiplicities of Zeros
Themultiplicity of a zero is the number of times the real
root of a polynomial function results in f(x) = 0.
Example: solve for the zeros of f(x) = x² (x − 2)²
x² (x − 2)² = 0
x² = 0 therefore, x = 0 to the multiplicity of 2
(x − 2)² = 0 therefore x = 2 to the multiplicity of 2
The exponent tells us the multiplicity.
30.
Multiplicity and x-intercepts
Supposer is a zero of even multiplicity. Then the graph touches
the x-axis at r and turns around at r.
Suppose r is a zero of odd multiplicity. Then the graph
crosses the x-axis at r.
Regardless of whether a multiplicity is even or odd, the graph
tends to flatten out near zeros with a multiplicity greater than
one.
31.
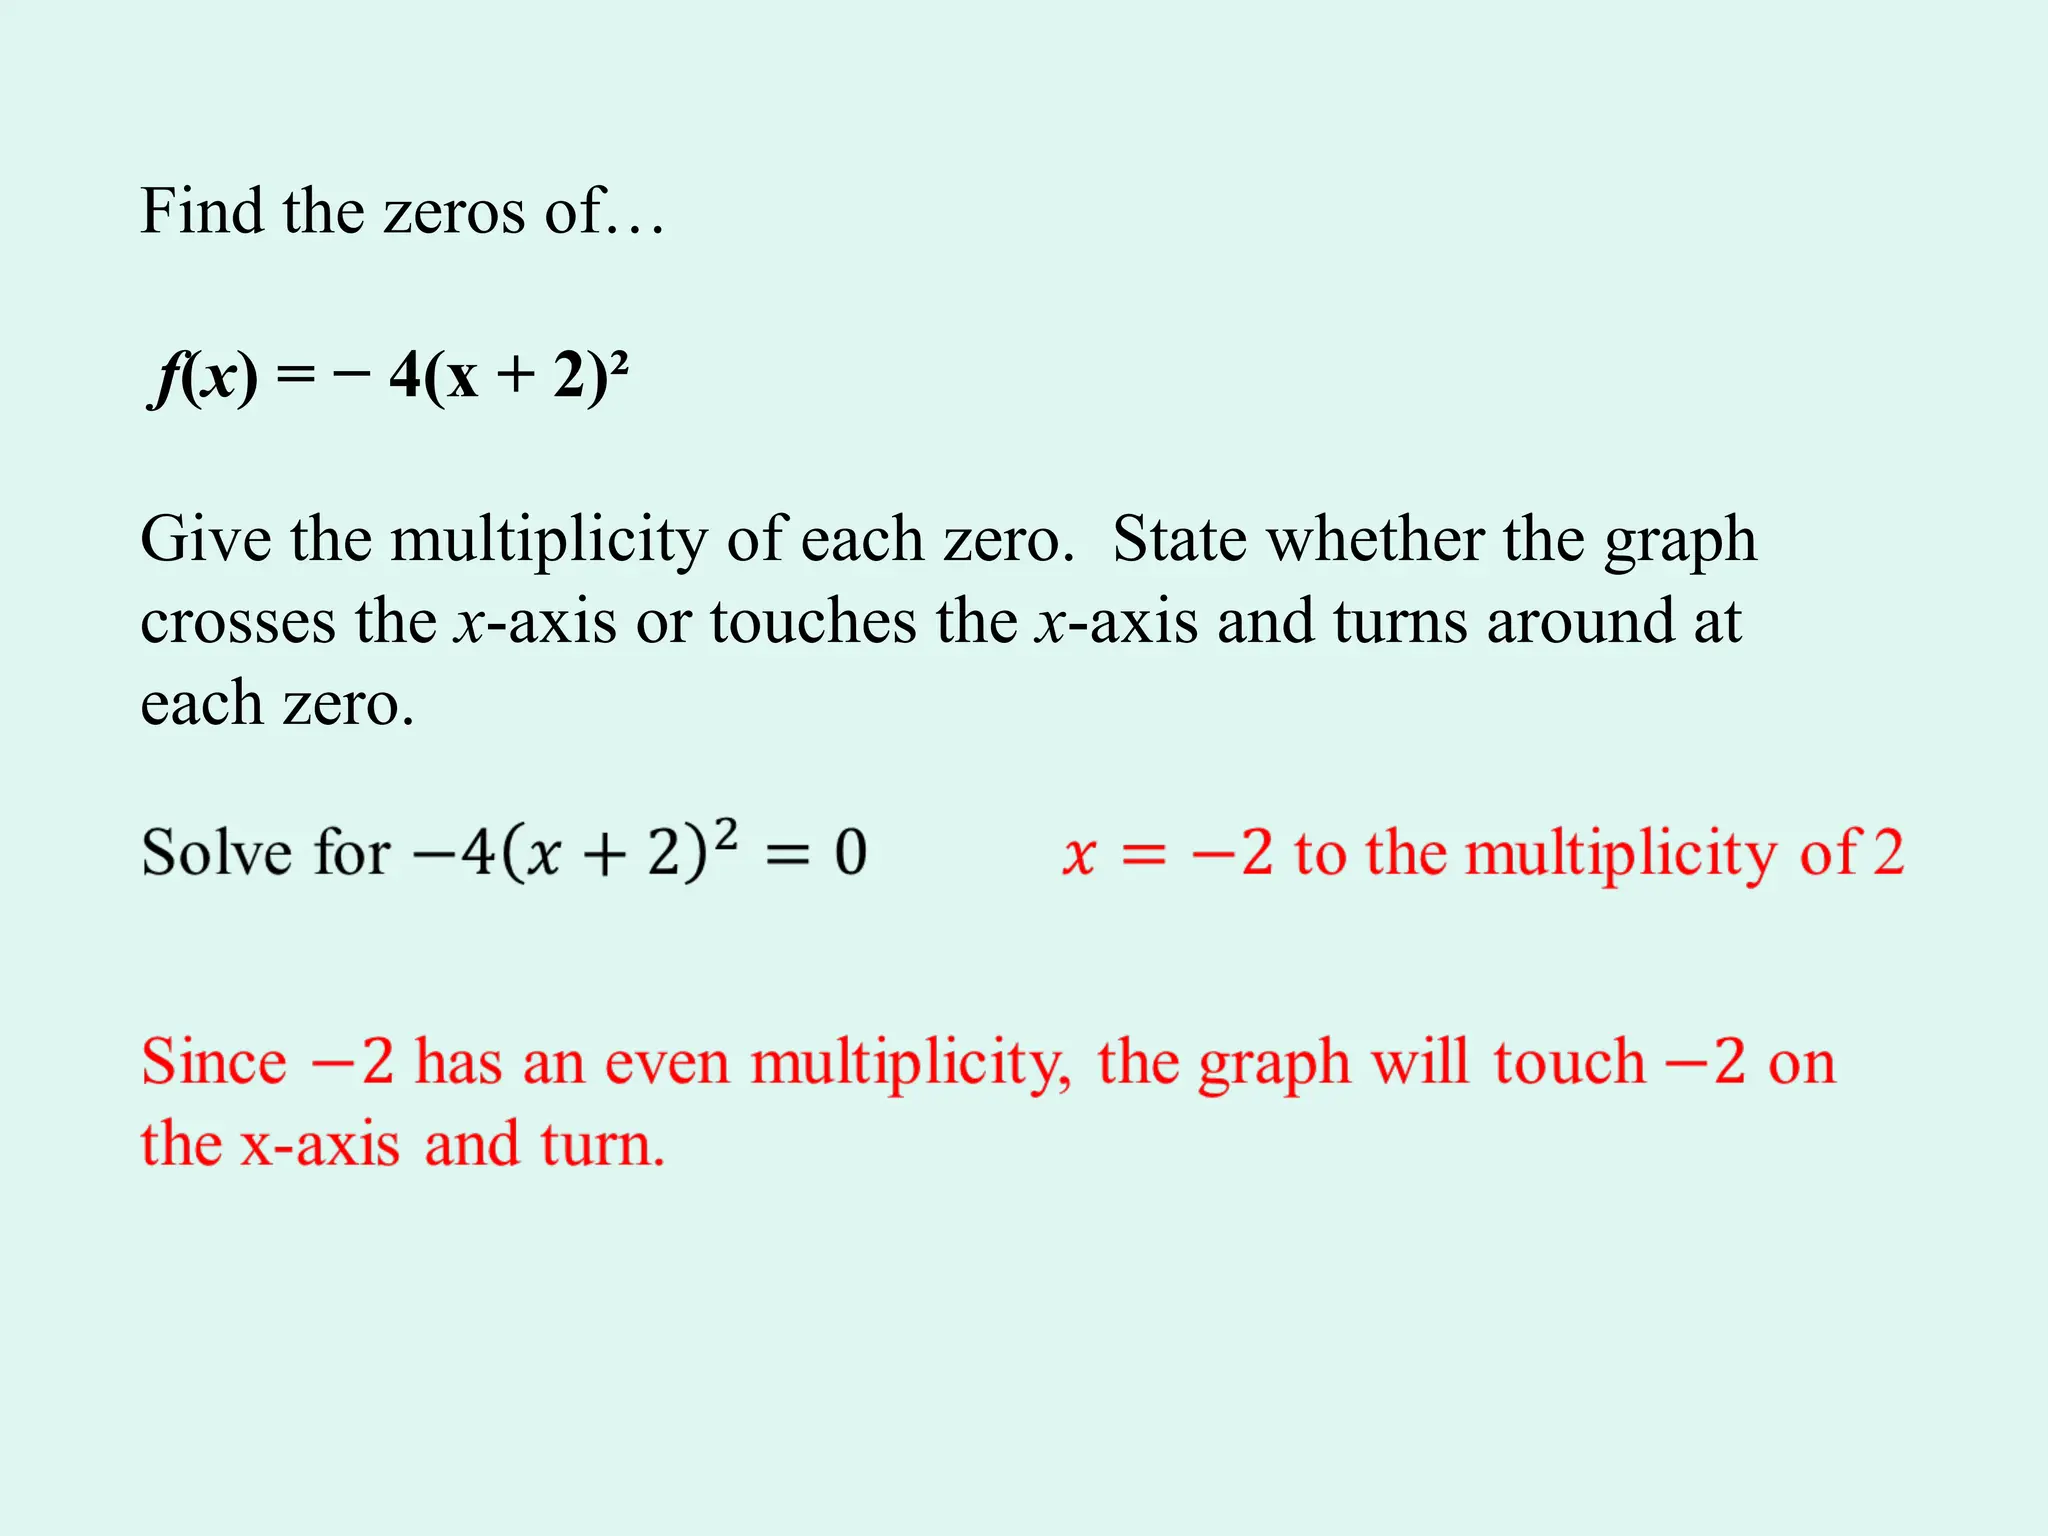
Find the zerosof…
f(x) = − 4(x + 2)²
Give the multiplicity of each zero. State whether the graph
crosses the x-axis or touches the x-axis and turns around at
each zero.
32.
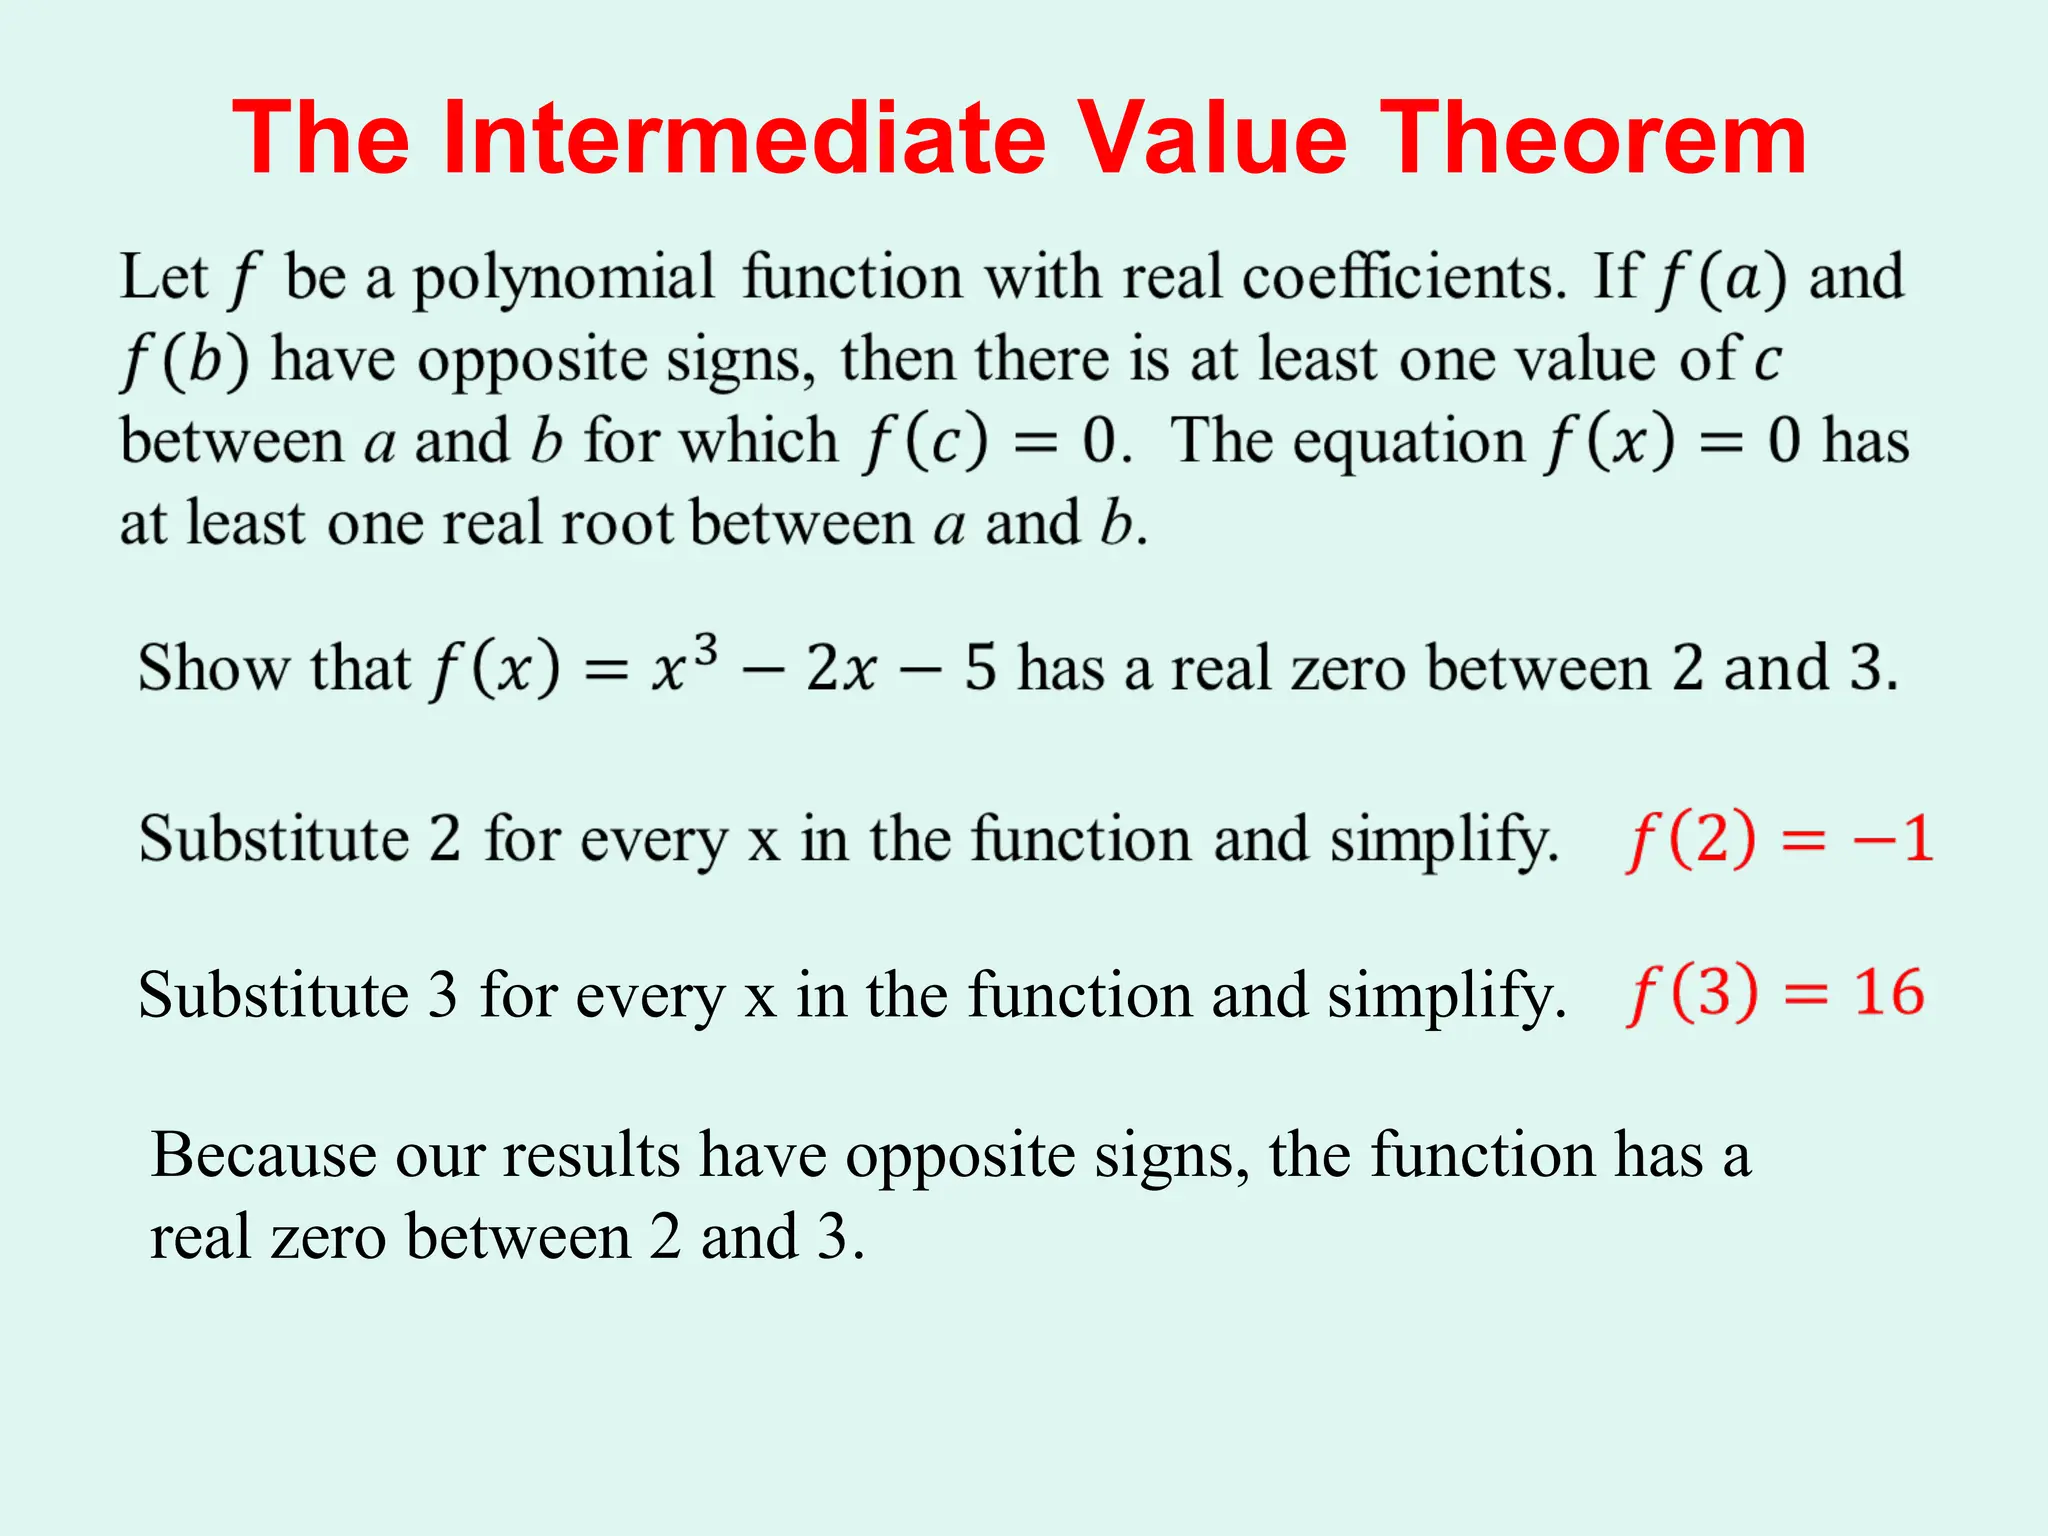
The Intermediate ValueTheorem
Substitute 3 for every x in the function and simplify.
Because our results have opposite signs, the function has a
real zero between 2 and 3.
33.
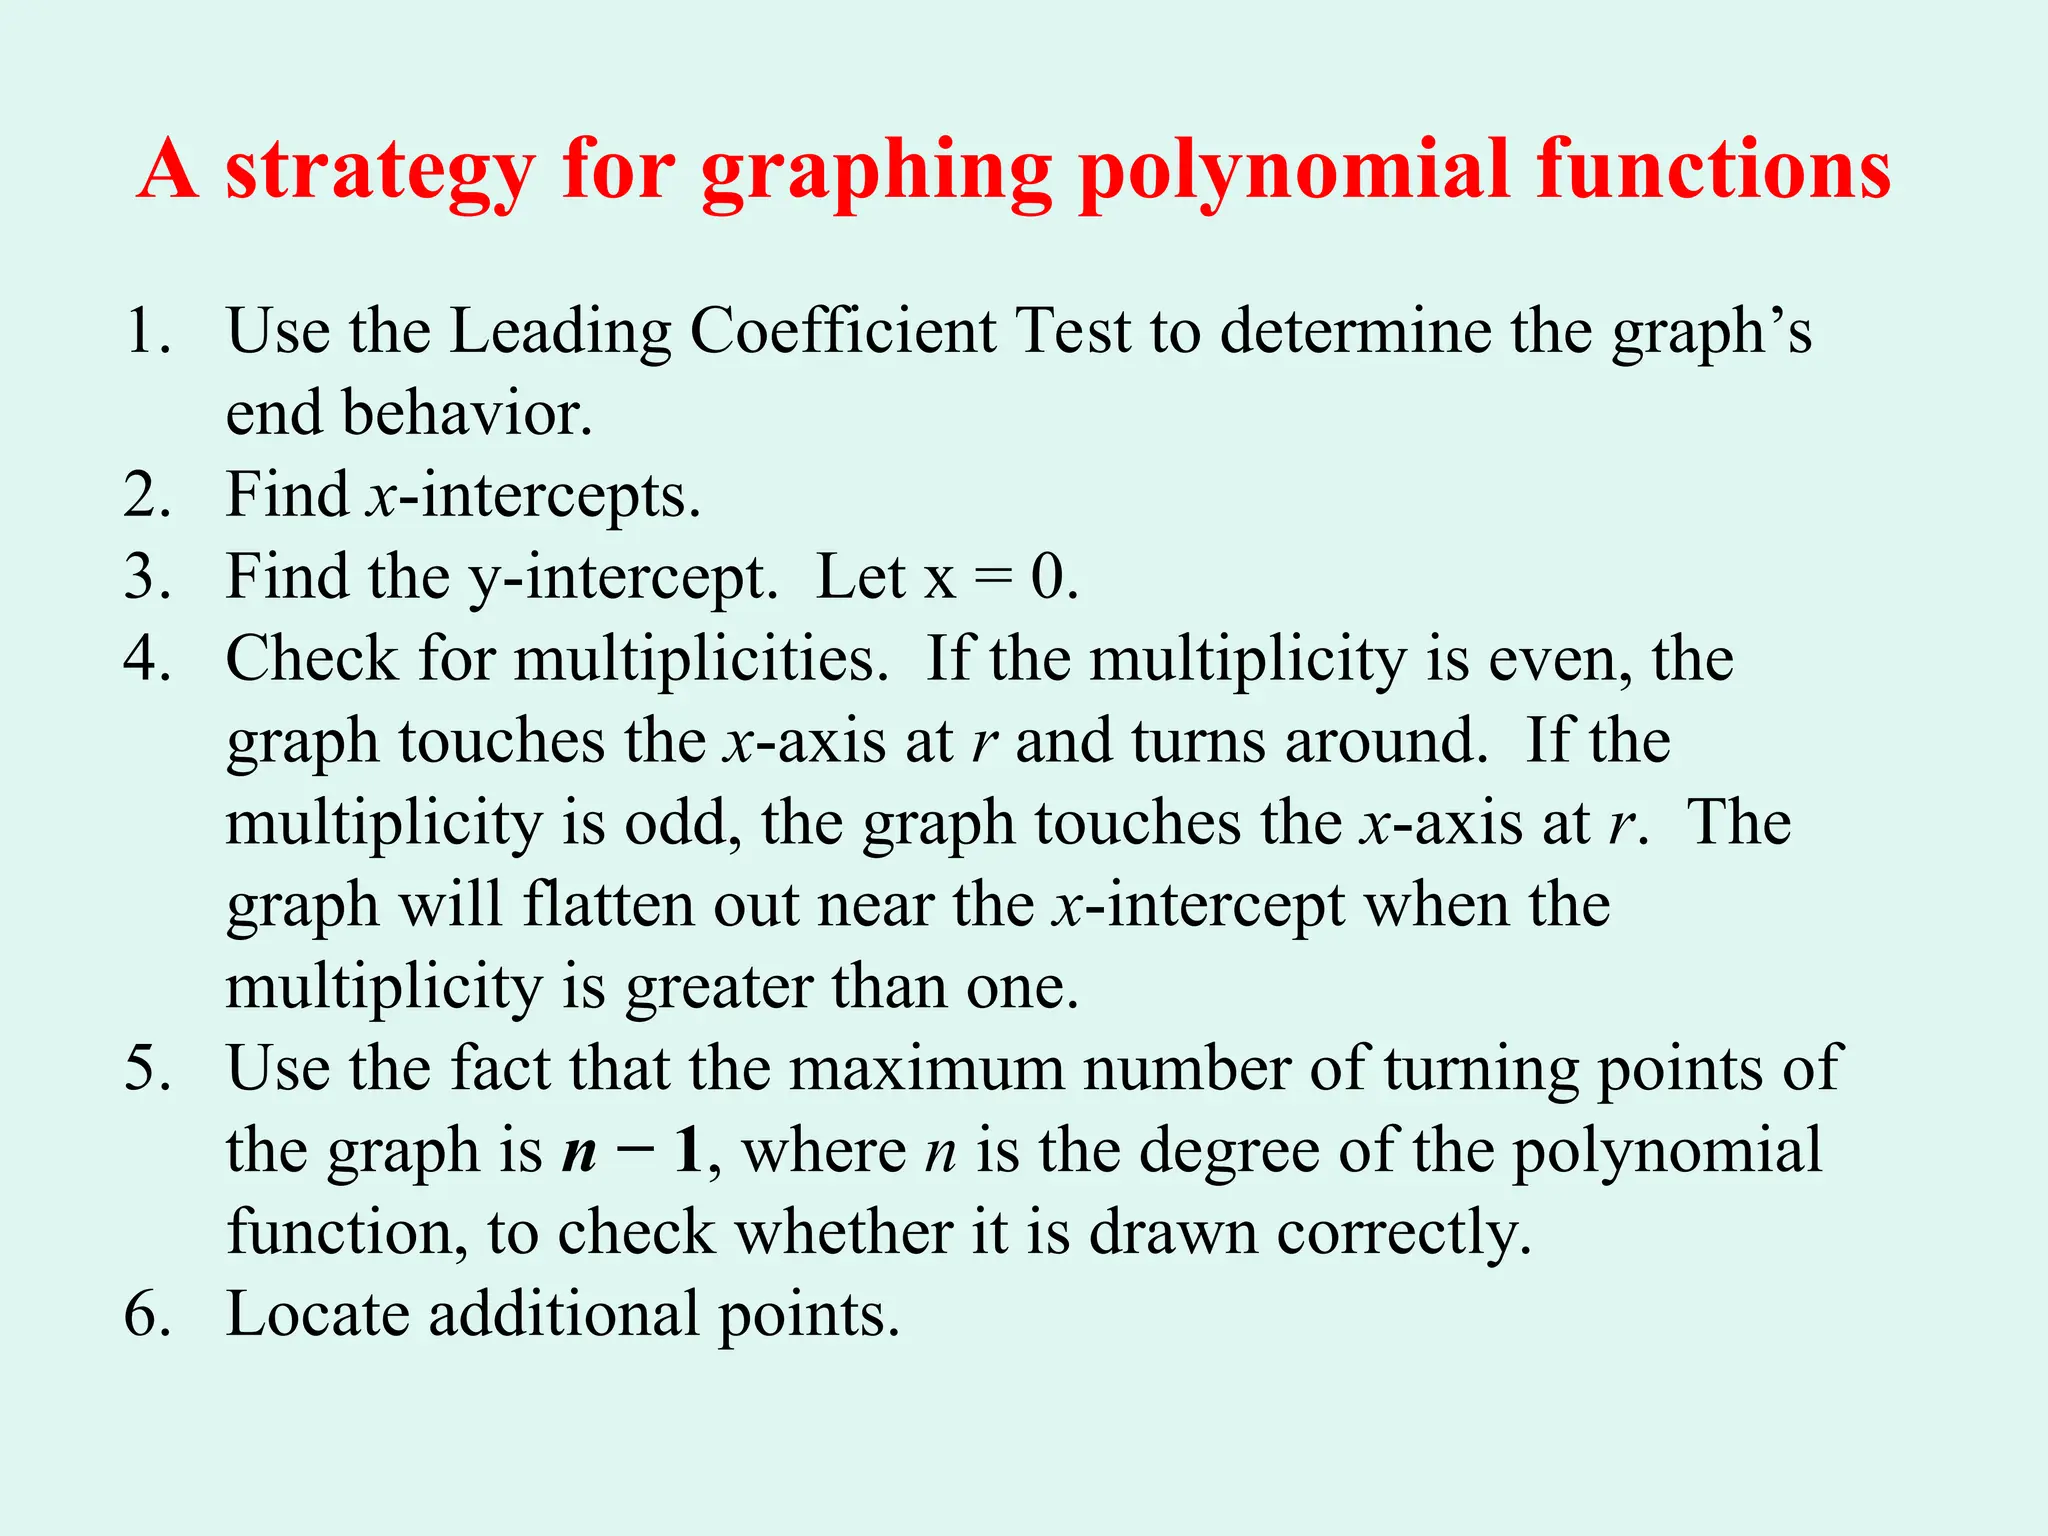
A strategy forgraphing polynomial functions
1. Use the Leading Coefficient Test to determine the graph’s
end behavior.
2. Find x-intercepts.
3. Find the y-intercept. Let x = 0.
4. Check for multiplicities. If the multiplicity is even, the
graph touches the x-axis at r and turns around. If the
multiplicity is odd, the graph touches the x-axis at r. The
graph will flatten out near the x-intercept when the
multiplicity is greater than one.
5. Use the fact that the maximum number of turning points of
the graph is n − 1, where n is the degree of the polynomial
function, to check whether it is drawn correctly.
6. Locate additional points.
34.
Graphing a PolynomialFunction
Let’s graph the function f(x) = x³ + 3x² − x − 3
What is it’s end behavior?
If the leading coefficient is positive with an odd degree to its
variable, the graph falls to the left and rises to the right (, ).
Find all the x-intercepts of… f(x) = x³ + 3x² − x − 3
f(x) = (0)³ + (0)² − (0) − 3
35.
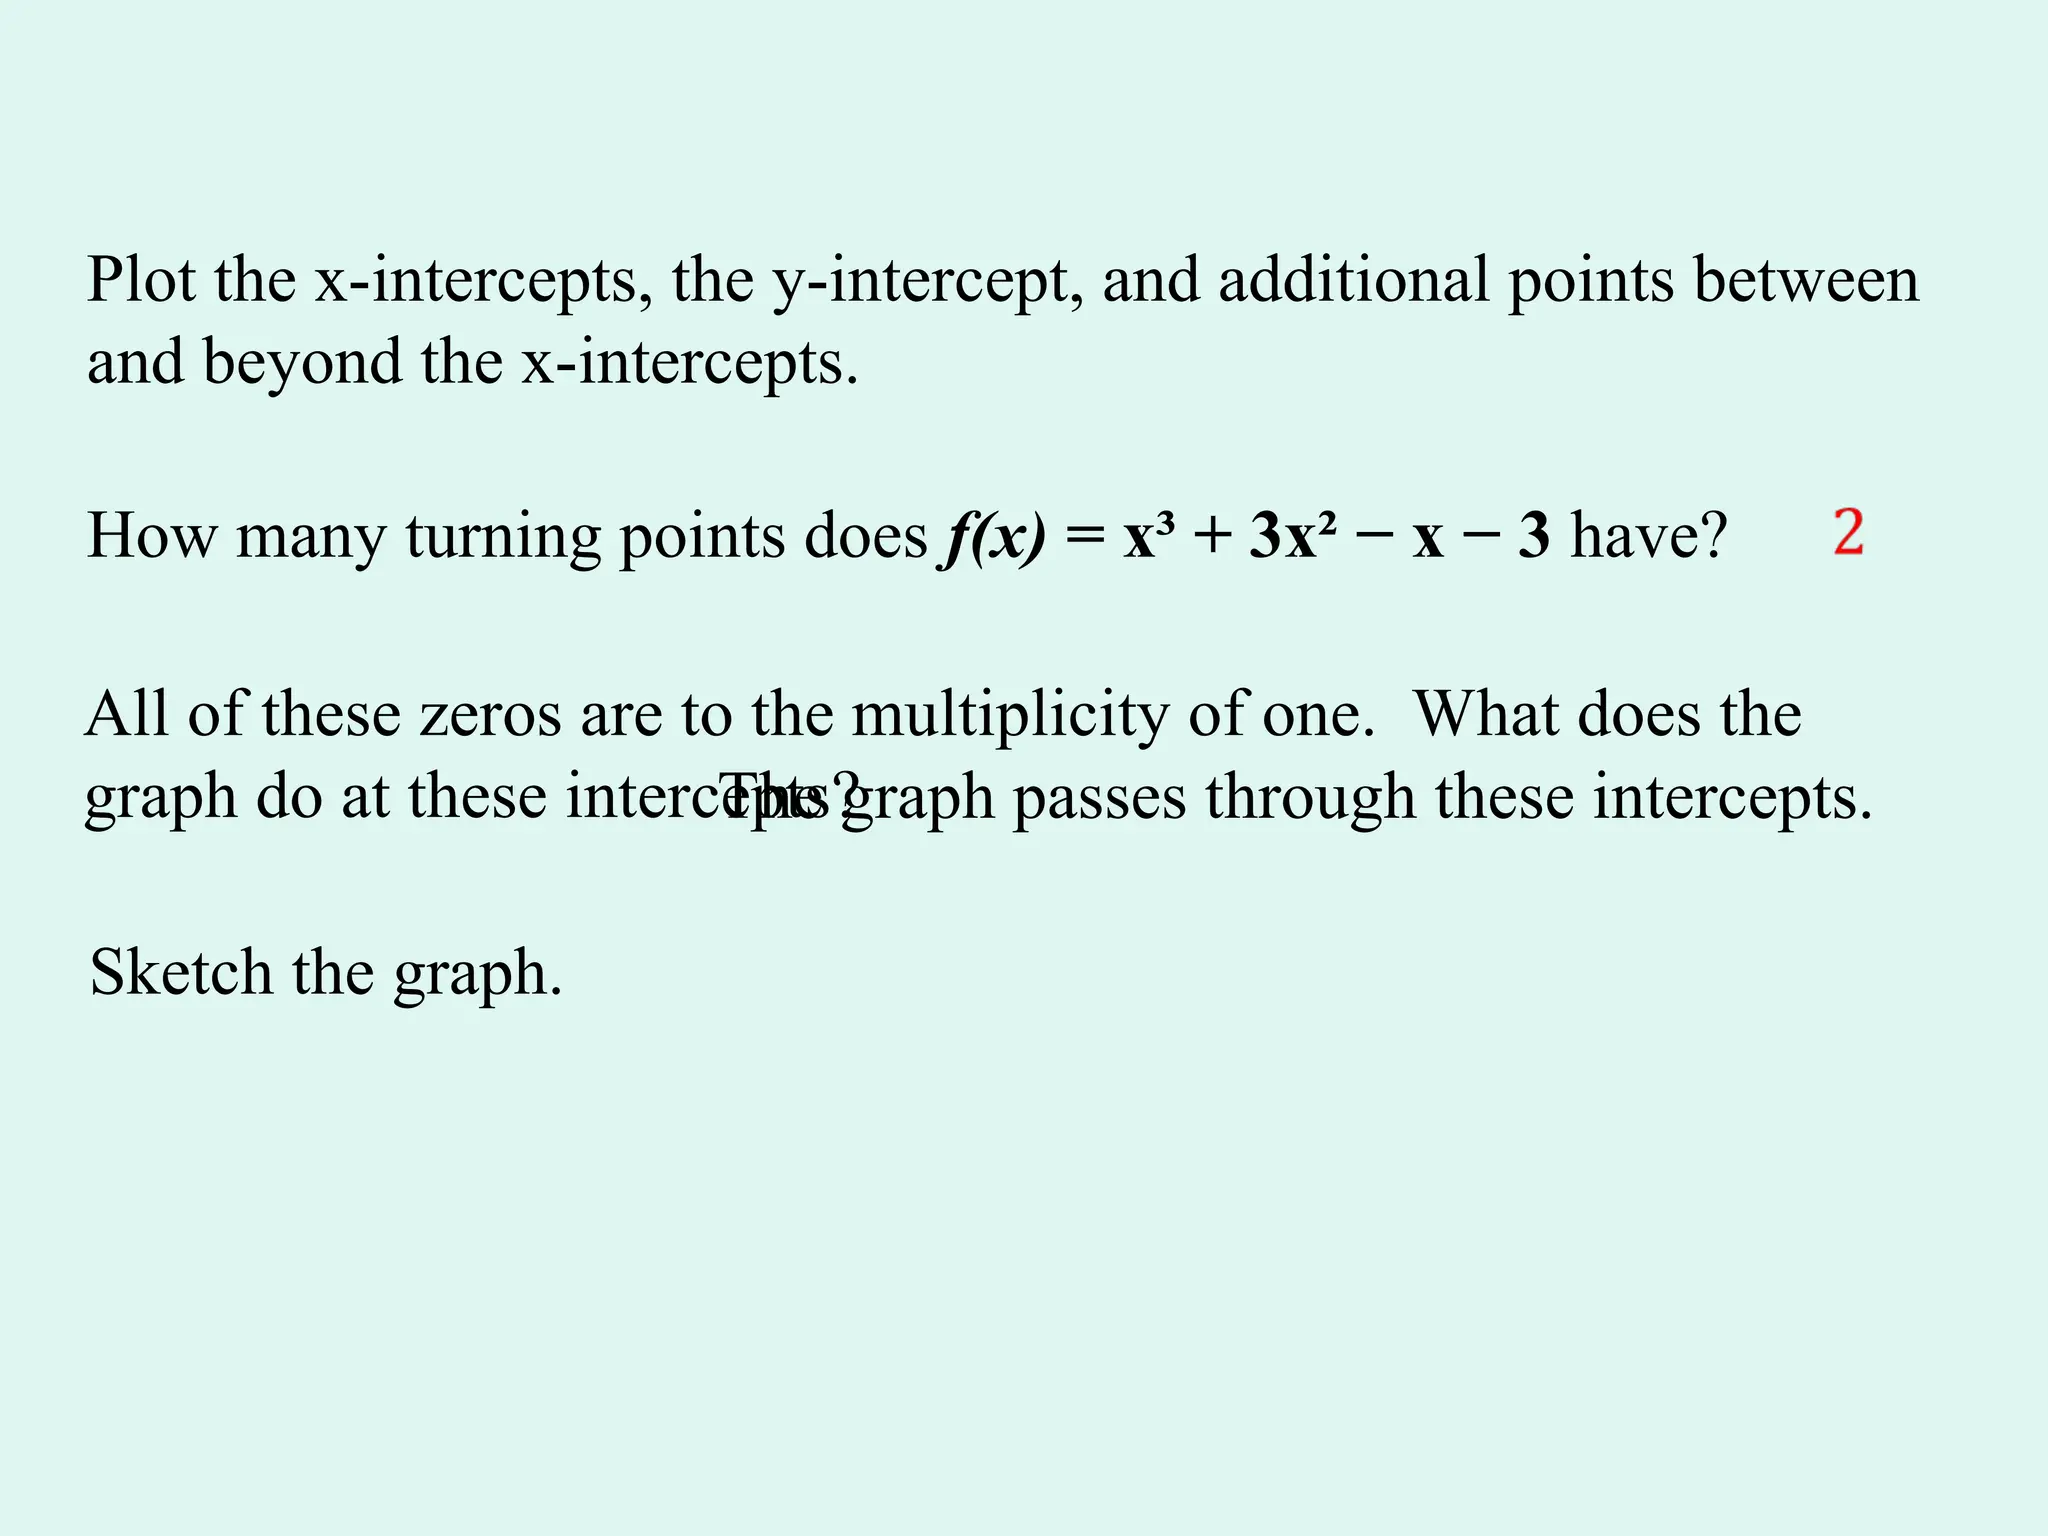
Plot the x-intercepts,the y-intercept, and additional points between
and beyond the x-intercepts.
How many turning points does f(x) = x³ + 3x² − x − 3 have?
All of these zeros are to the multiplicity of one. What does the
graph do at these intercepts?
The graph passes through these intercepts.
Sketch the graph.