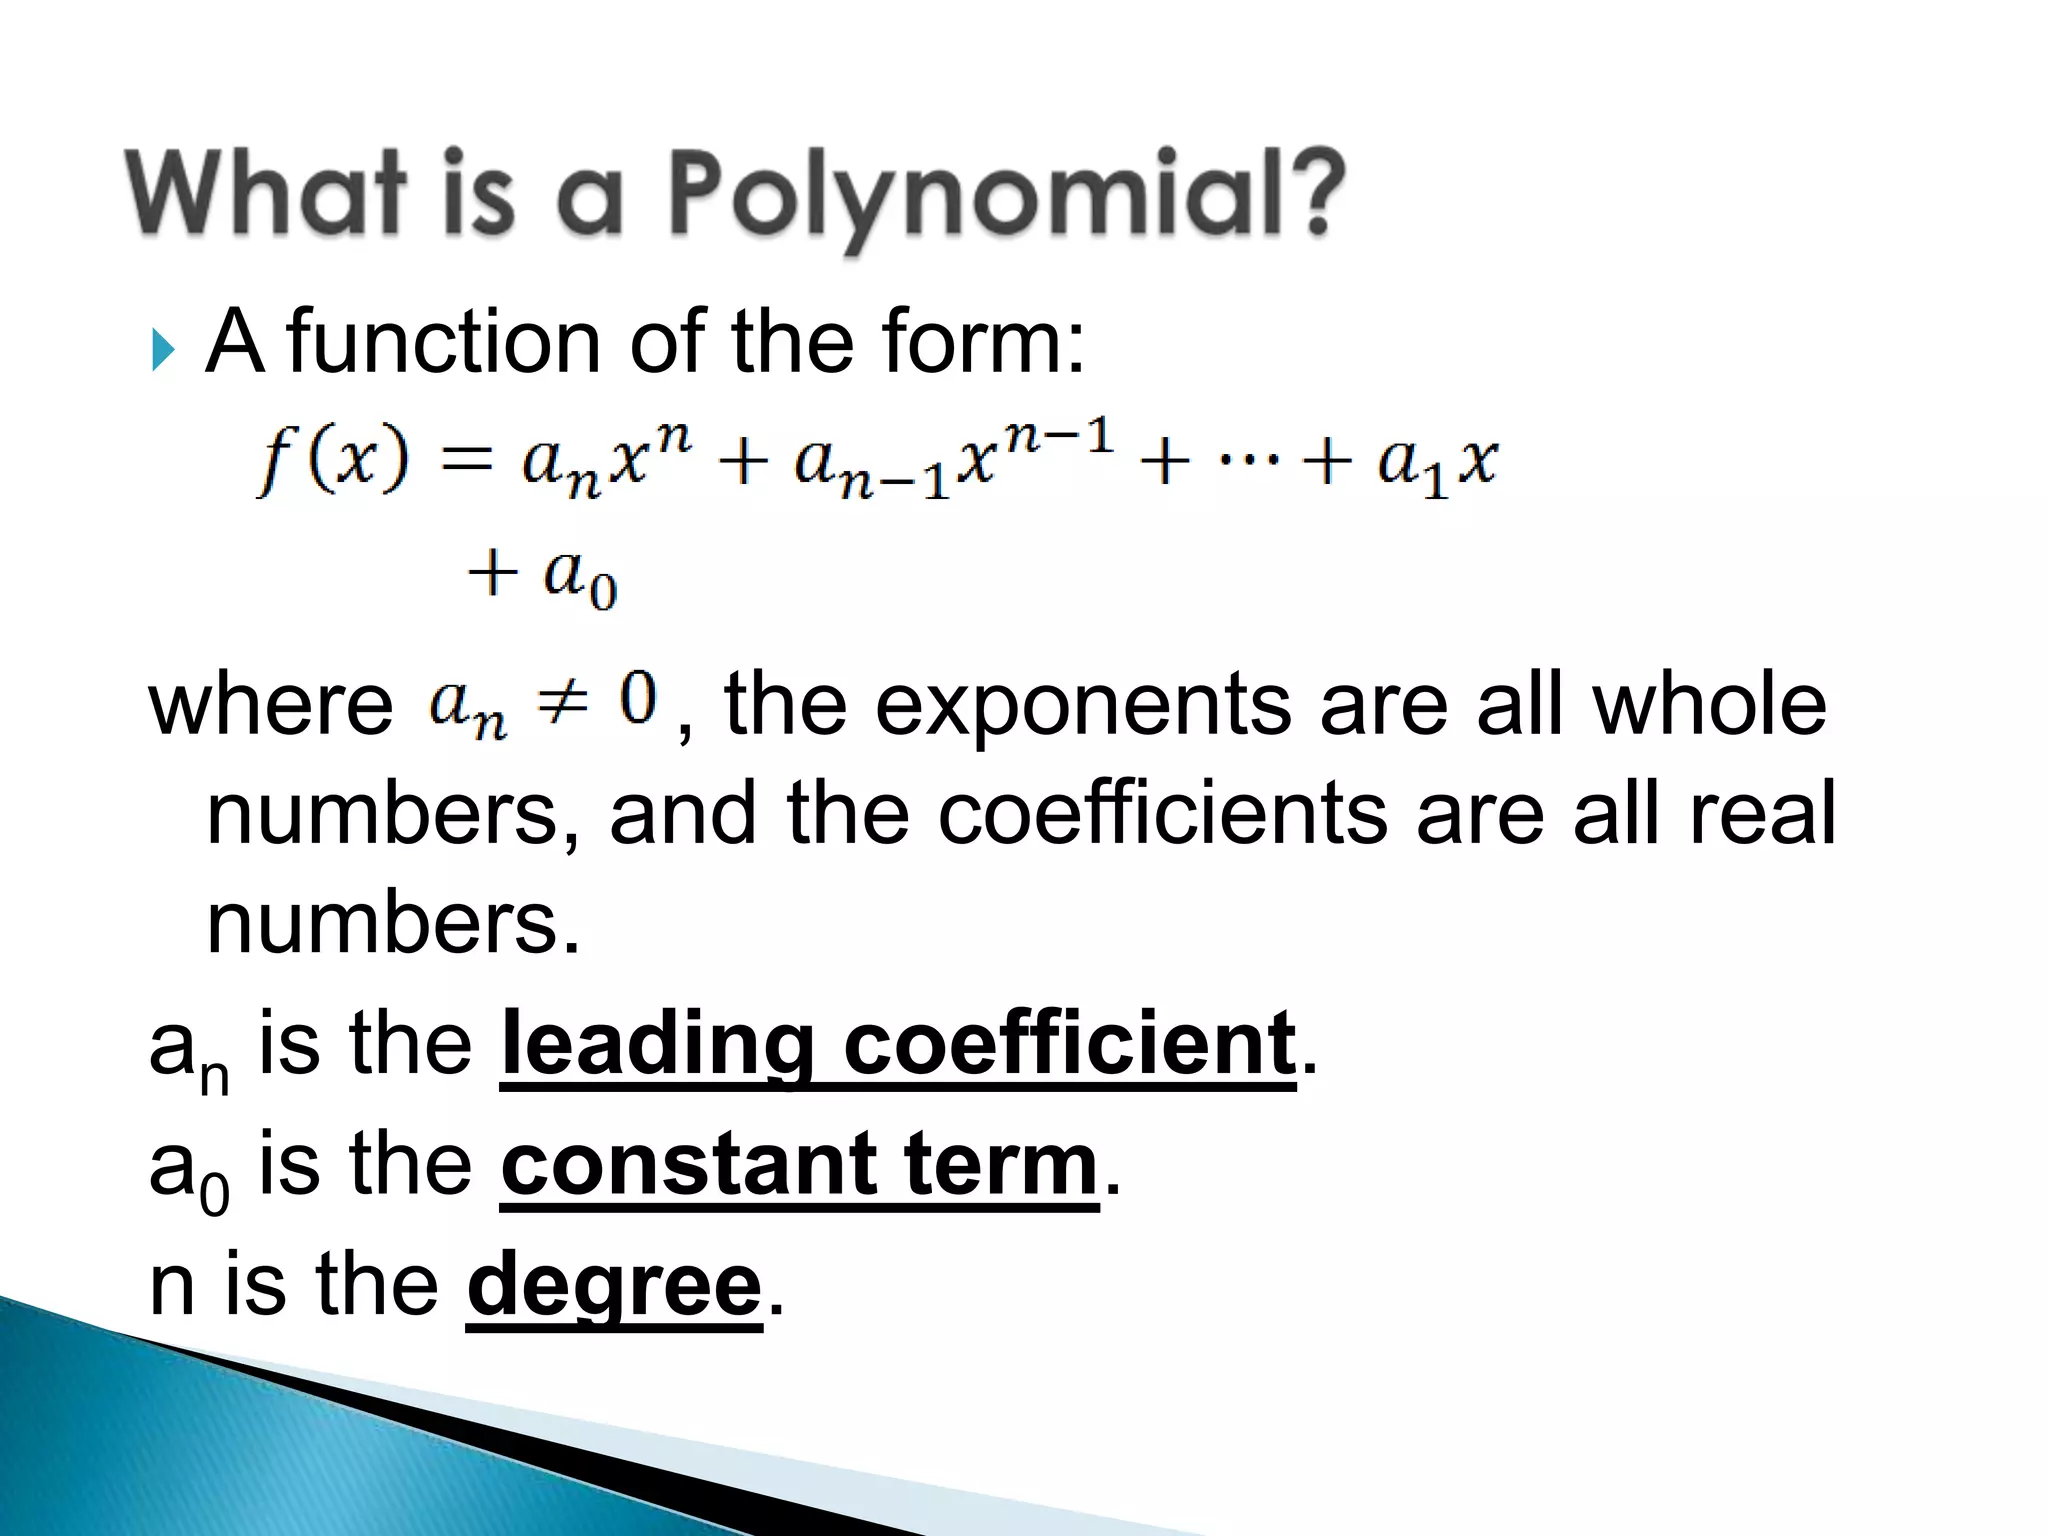
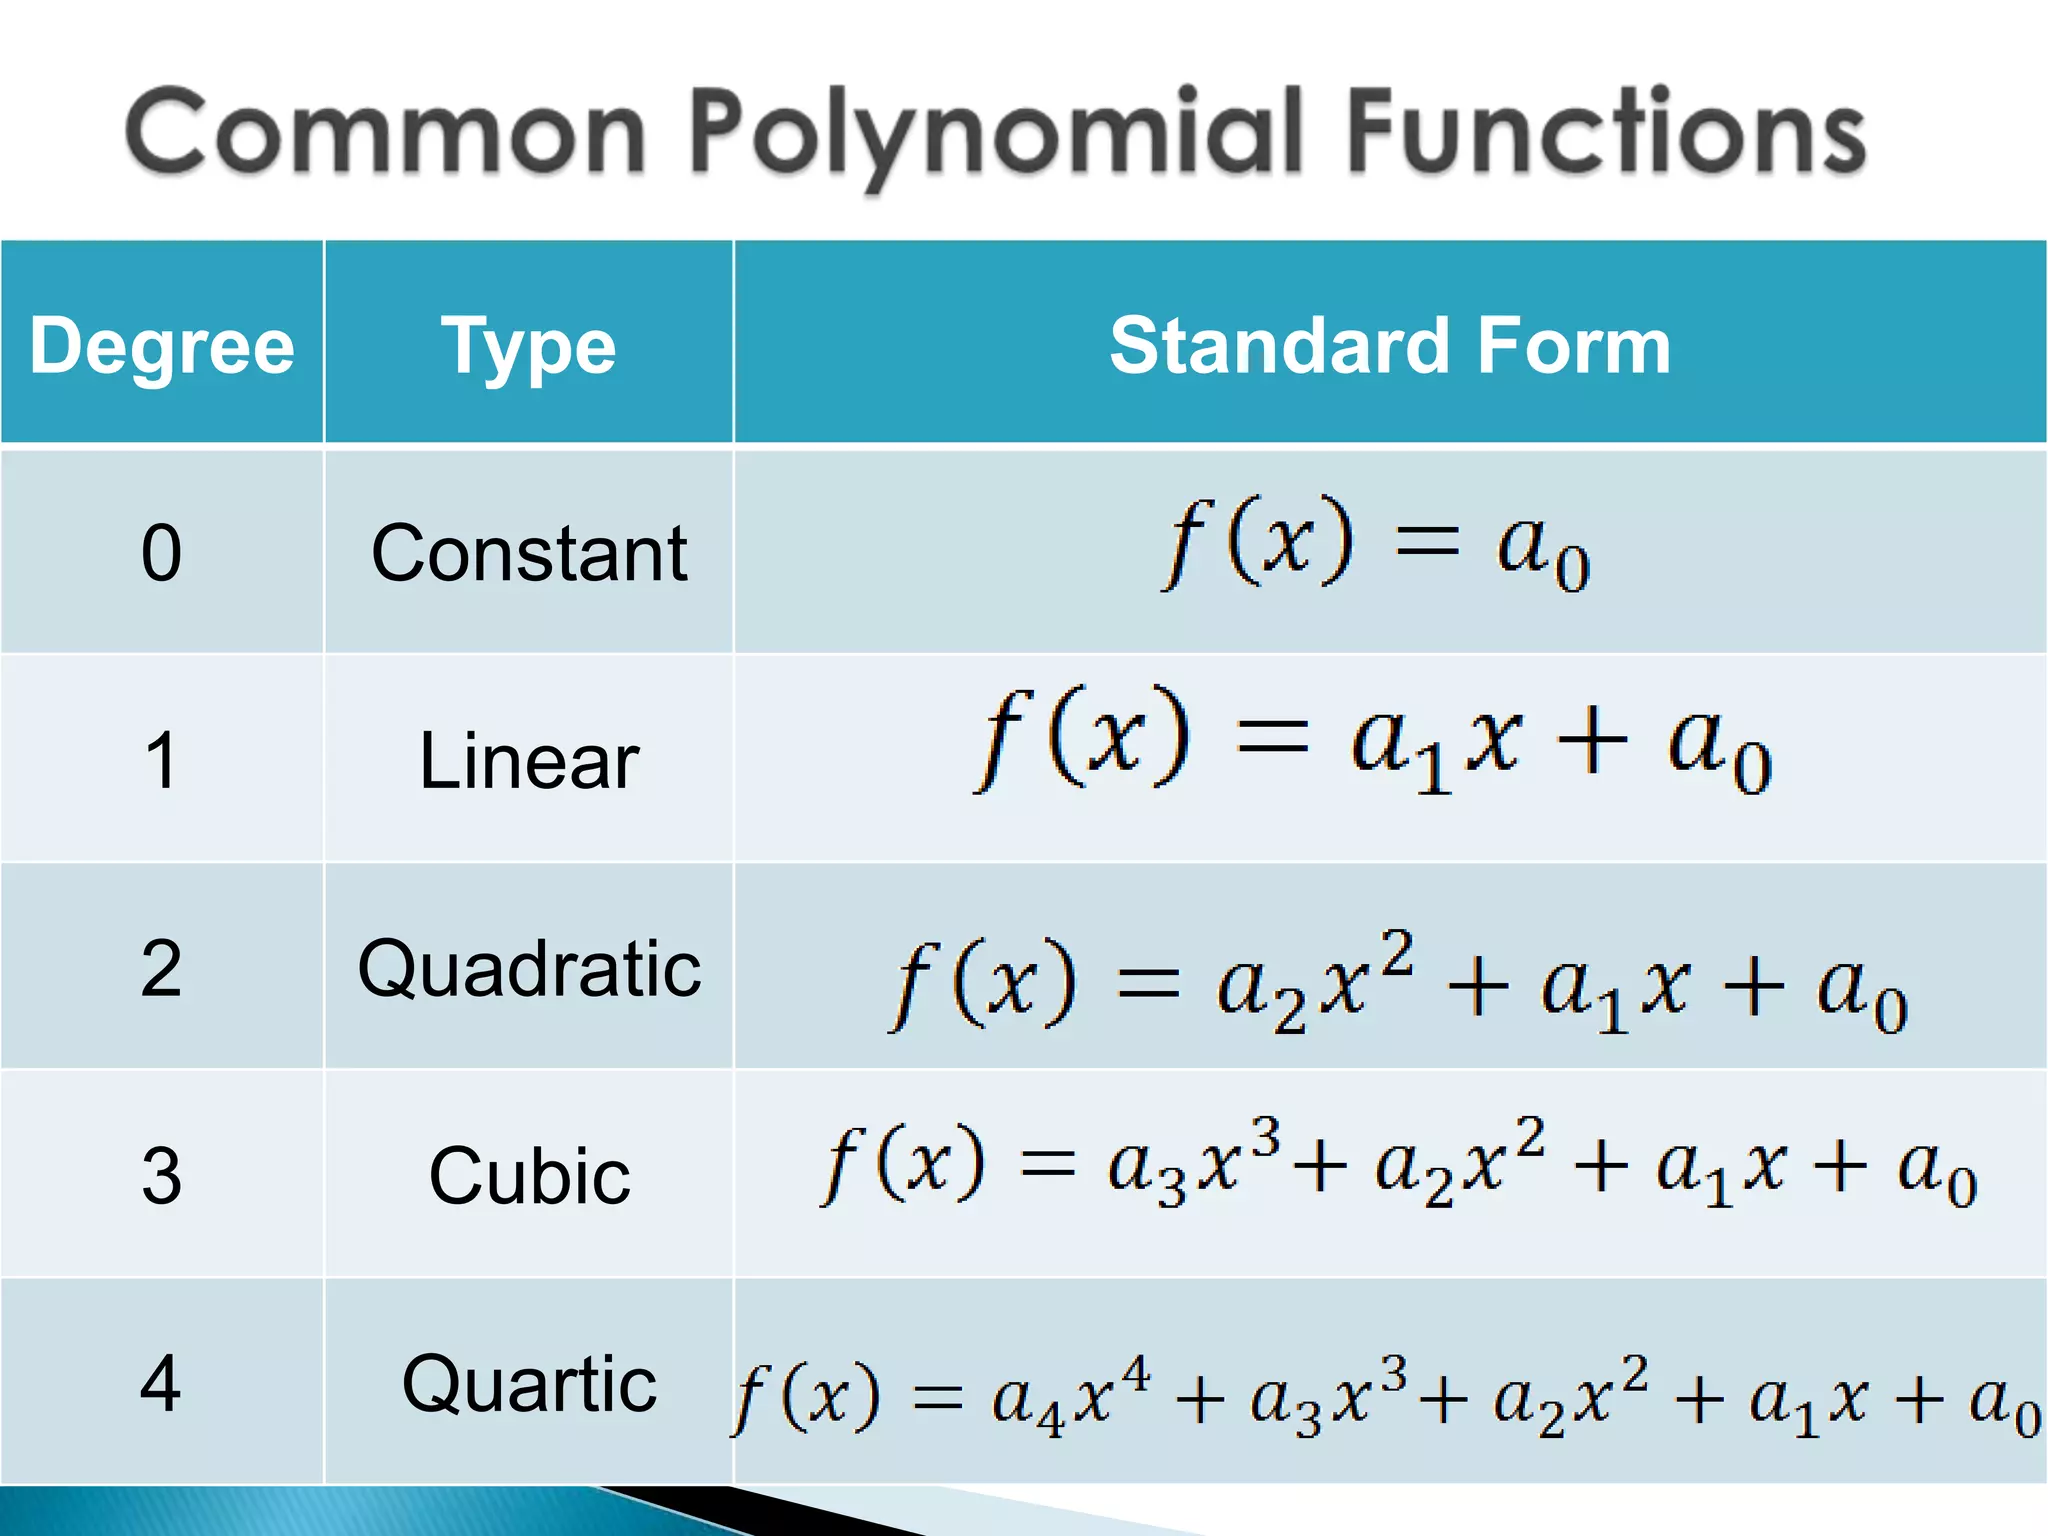
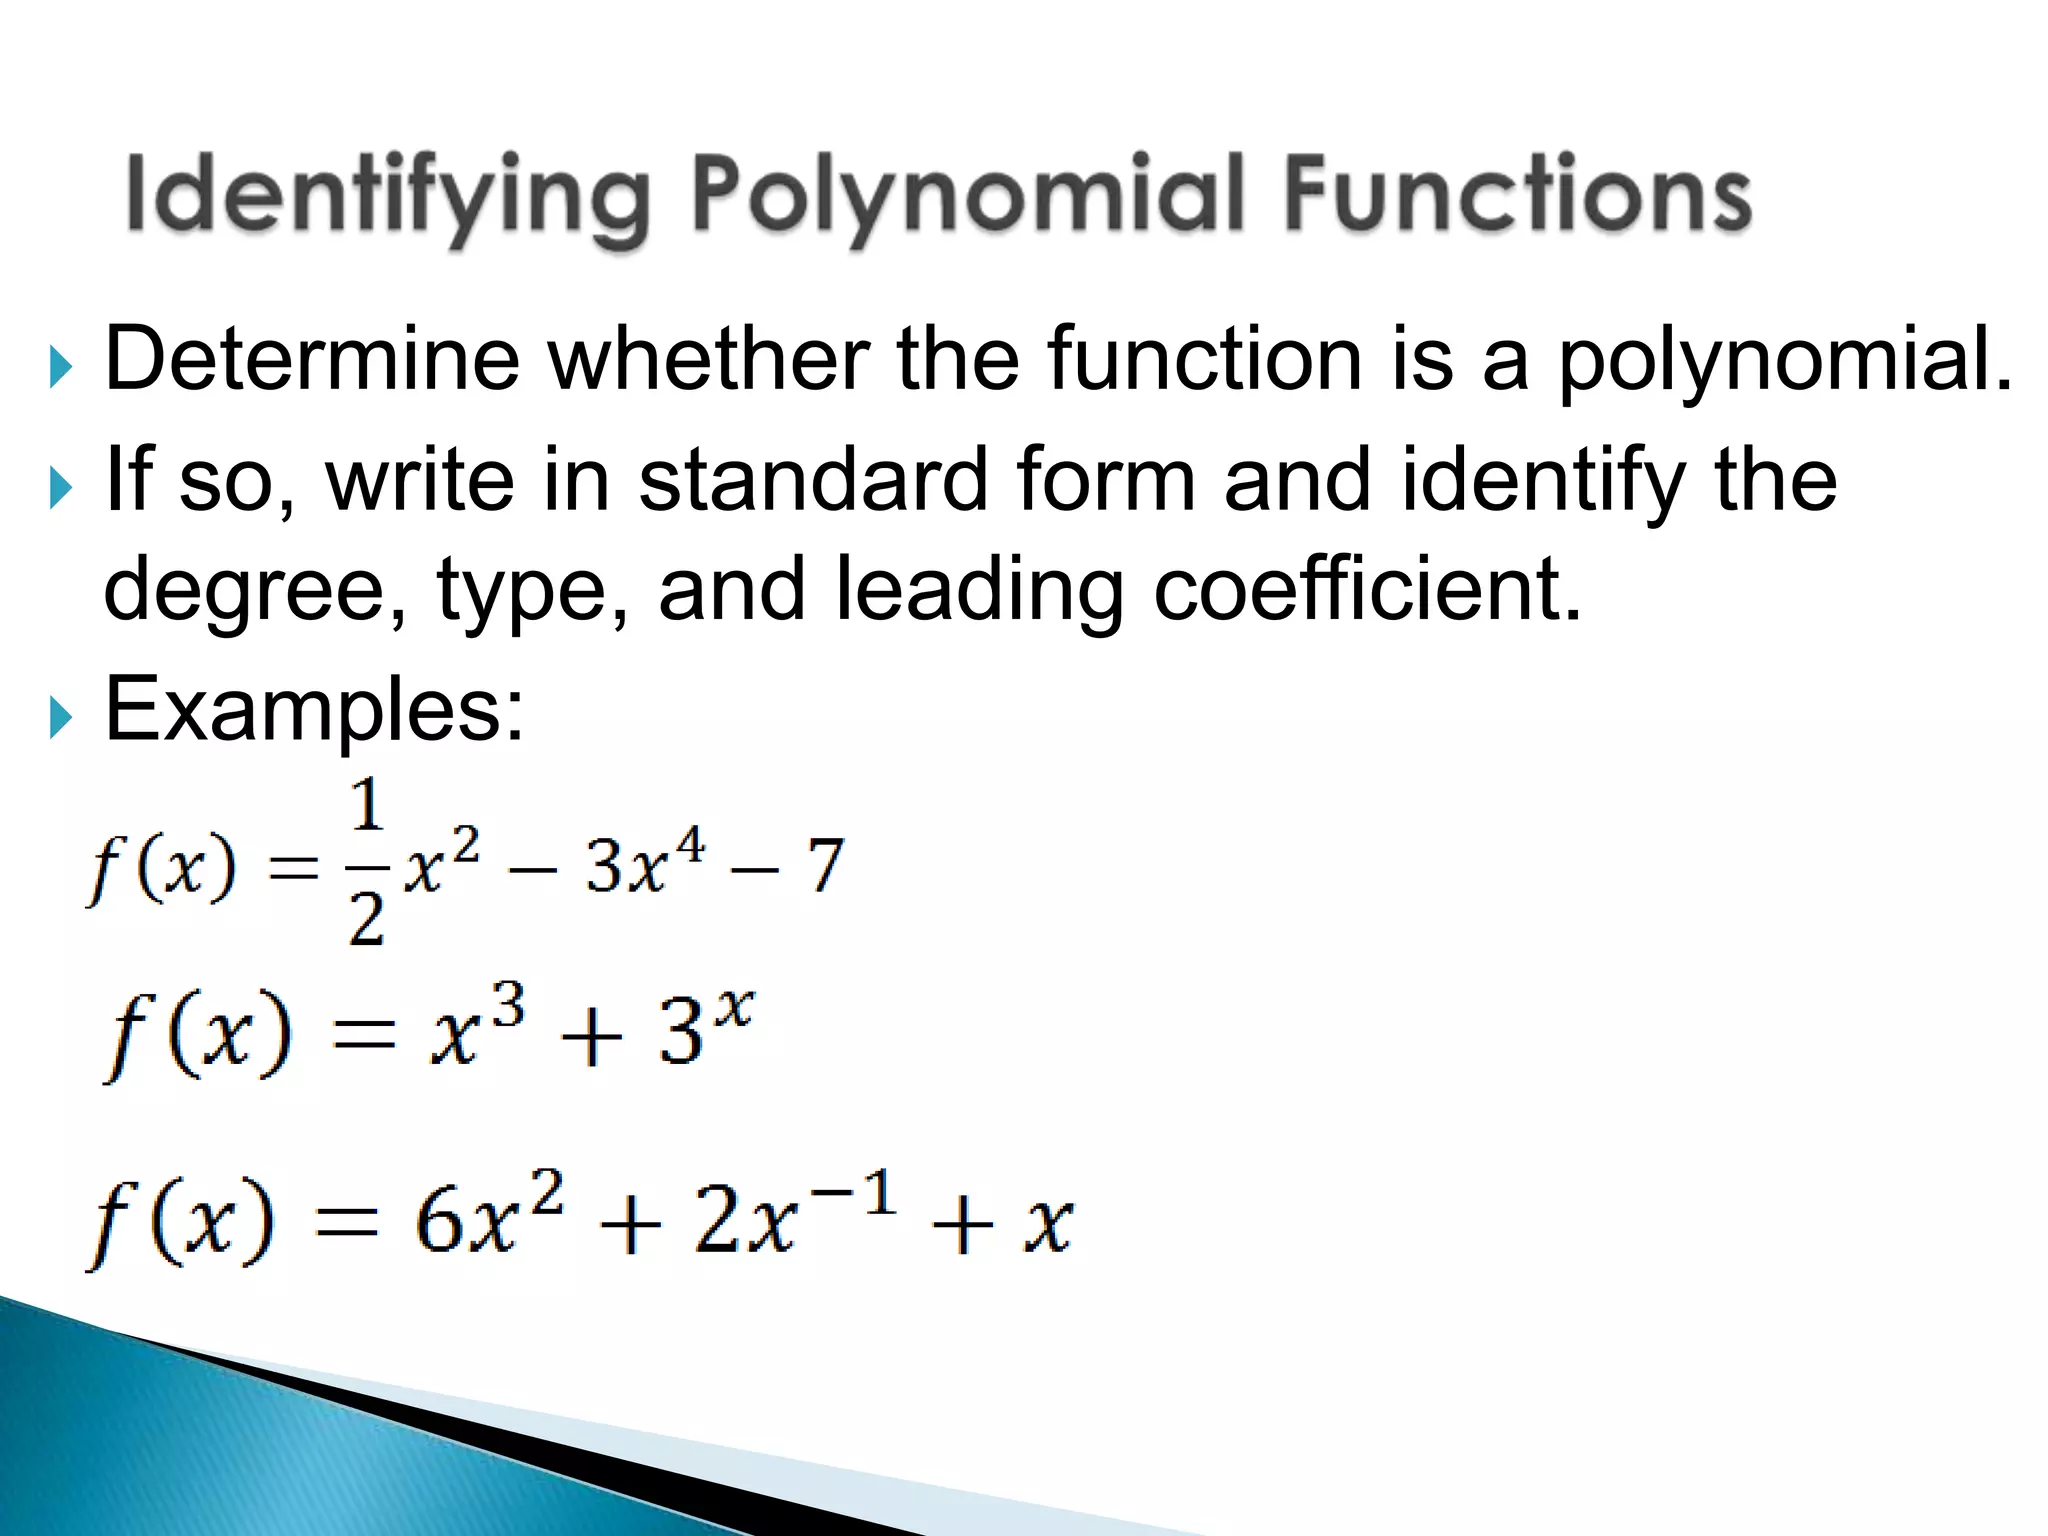
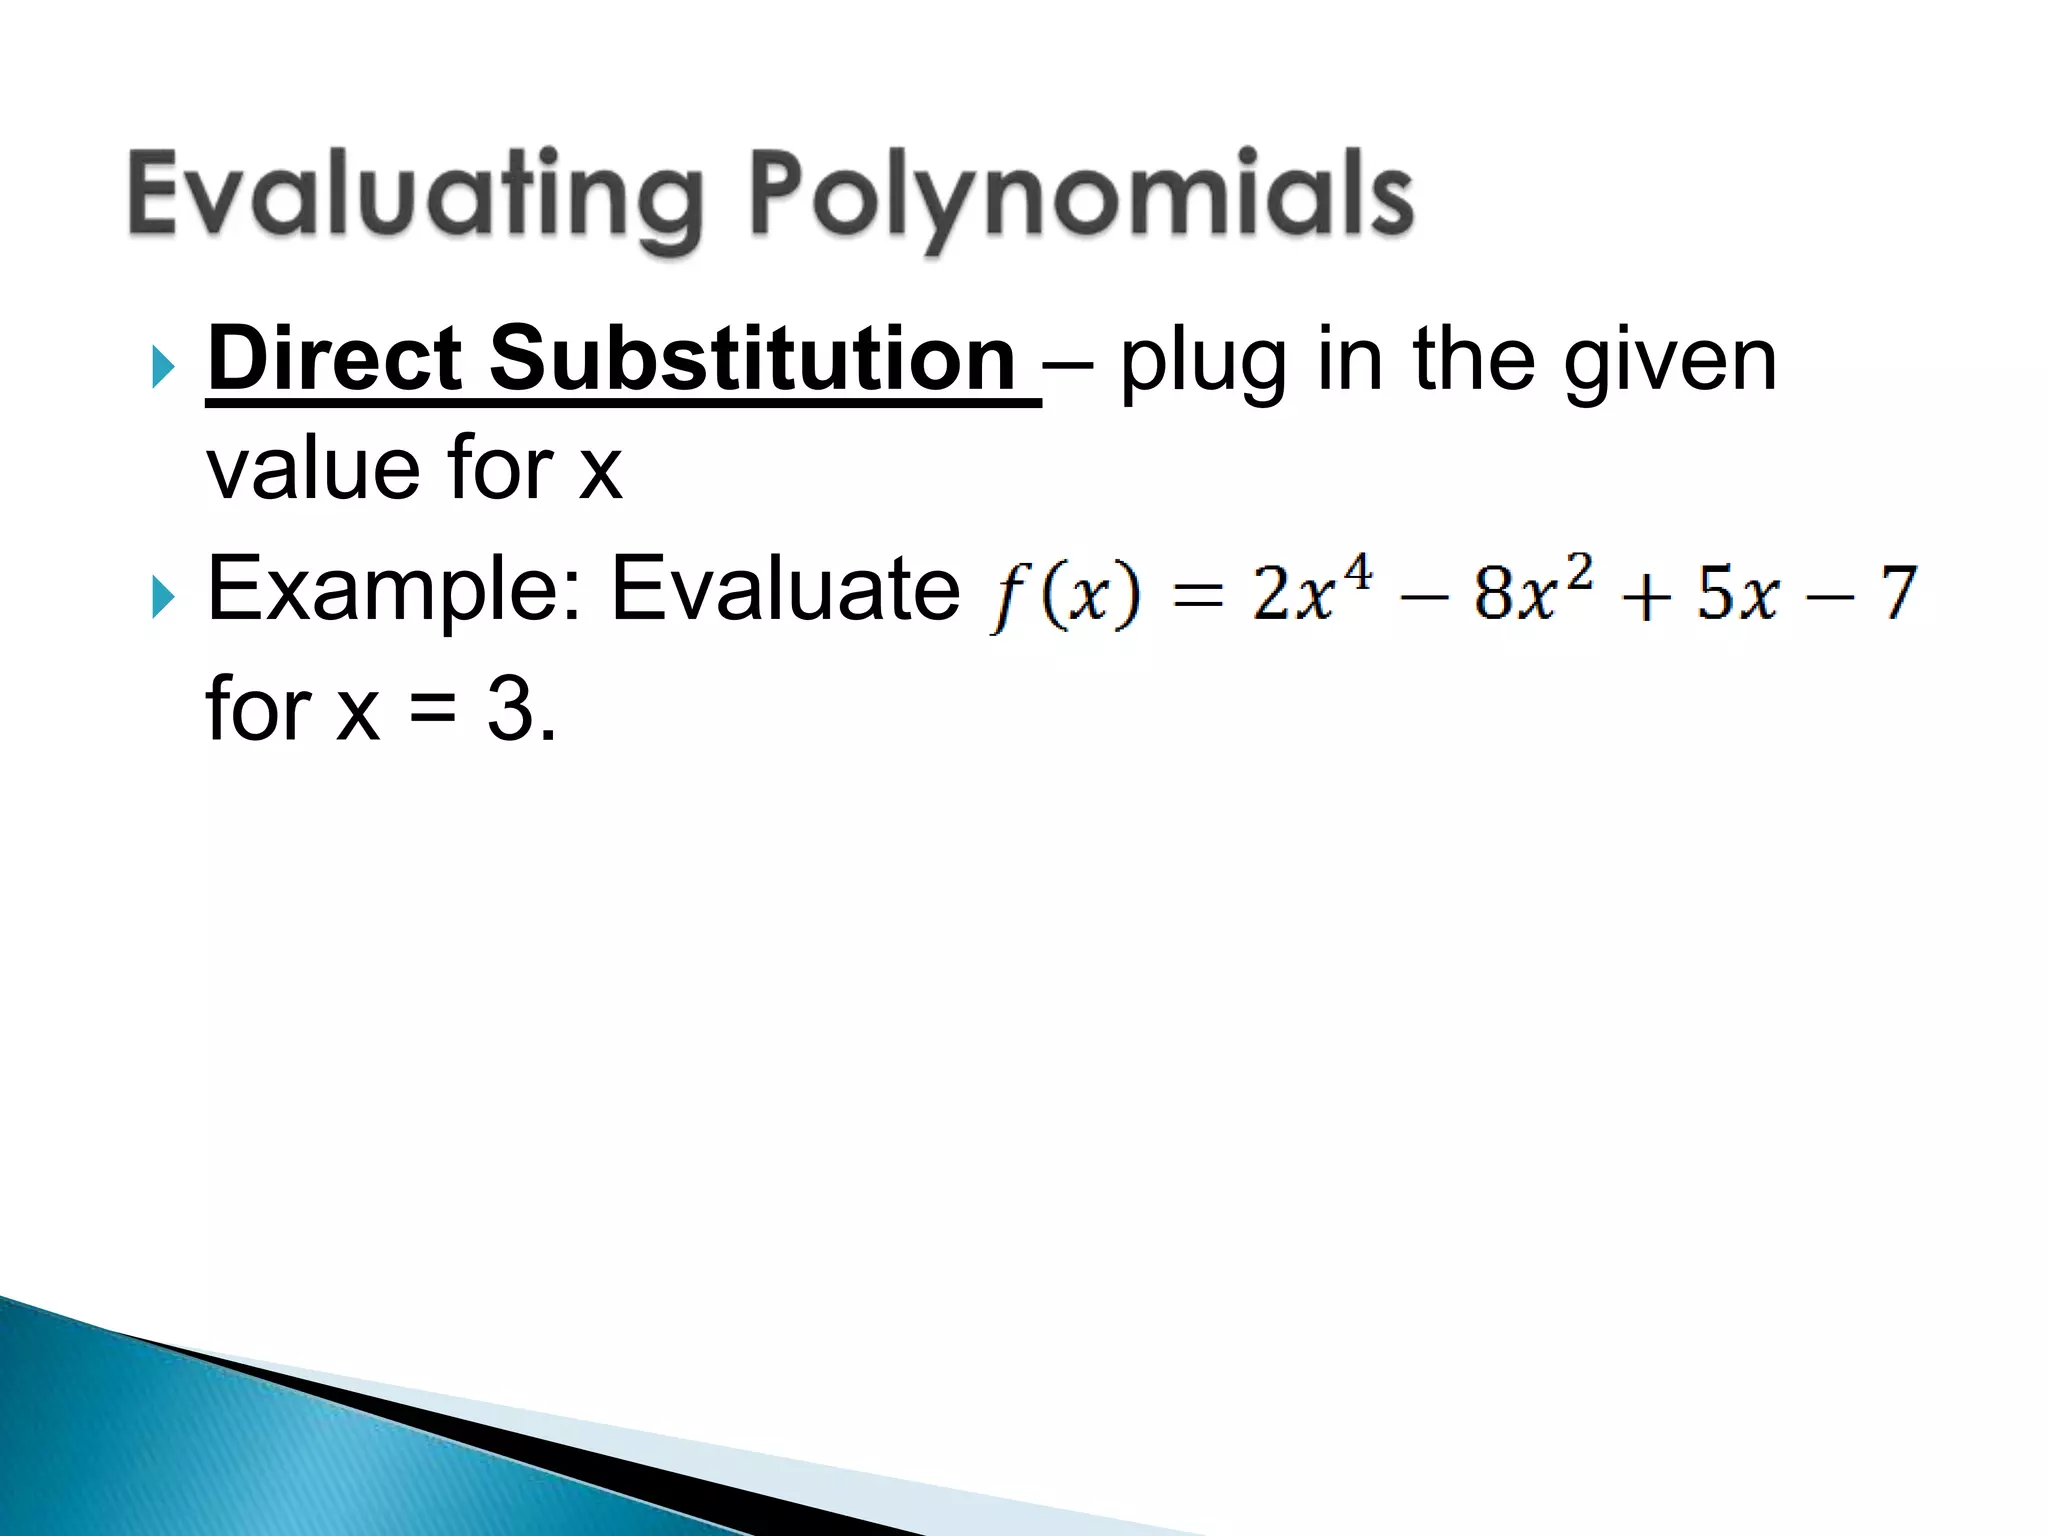
   A function of the form:


where         , the exponents are all whole
 numbers, and the coefficients are all real
 numbers.
an is the leading coefficient.
a0 is the constant term.
n is the degree.
Degree     Type      Standard Form

  0      Constant

  1       Linear

  2      Quadratic

  3       Cubic

  4       Quartic
 Determine whether the function is a polynomial.
 If so, write in standard form and identify the
  degree, type, and leading coefficient.
 Examples:
 Direct Substitution – plug in the given
  value for x
 Example: Evaluate
  for x = 3.
 The behavior of the graph as x approaches
  positive infinity (+∞) or negative infinity (-∞).
 Written:             as
    and                as
Example:
   Describe the end behavior of the graph.
 Write your two functions.
 Sketch a graph of both functions
  (use graphing calculator, then copy)
 For each graph, identify:
1. The degree
2. Is the degree odd or even?
3. Leading coefficient (+ or -)
4. End behavior
5. Number of “bumps”/changes in direction
 Make a table of values and plot some
  points. Connect them with a curve.
 Check for correct end behavior.
 Example: Graph
   Graph the polynomial function

6.2 evaluating and graphing polynomials

  • 2.
    A function of the form: where , the exponents are all whole numbers, and the coefficients are all real numbers. an is the leading coefficient. a0 is the constant term. n is the degree.
  • 3.
    Degree Type Standard Form 0 Constant 1 Linear 2 Quadratic 3 Cubic 4 Quartic
  • 4.
     Determine whetherthe function is a polynomial.  If so, write in standard form and identify the degree, type, and leading coefficient.  Examples:
  • 5.
     Direct Substitution– plug in the given value for x  Example: Evaluate for x = 3.
  • 6.
     The behaviorof the graph as x approaches positive infinity (+∞) or negative infinity (-∞).  Written: as and as Example:
  • 7.
    Describe the end behavior of the graph.
  • 8.
     Write yourtwo functions.  Sketch a graph of both functions (use graphing calculator, then copy)  For each graph, identify: 1. The degree 2. Is the degree odd or even? 3. Leading coefficient (+ or -) 4. End behavior 5. Number of “bumps”/changes in direction
  • 10.
     Make atable of values and plot some points. Connect them with a curve.  Check for correct end behavior.  Example: Graph
  • 11.
    Graph the polynomial function