Downloaded 204 times
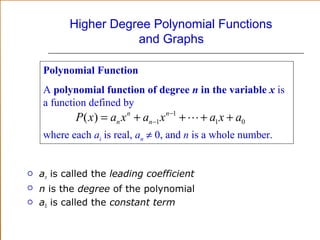
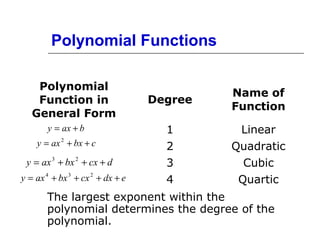
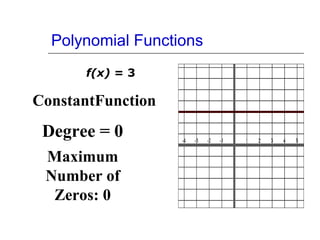
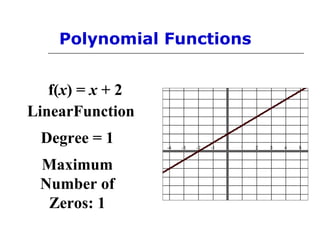
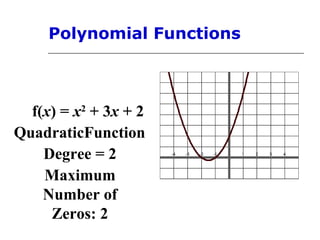
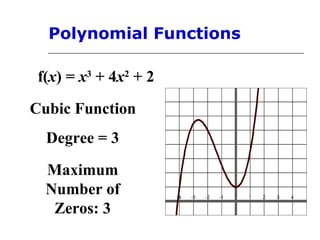
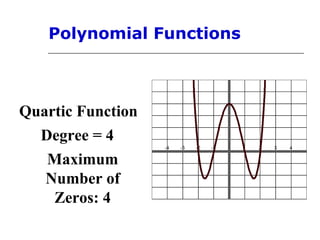
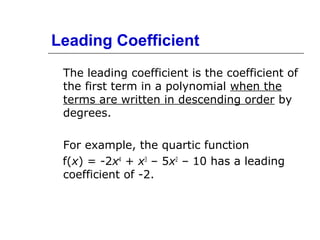
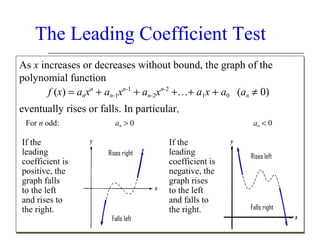
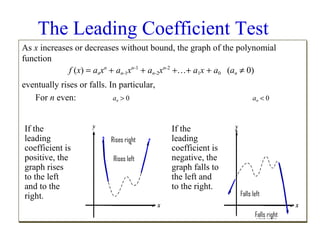
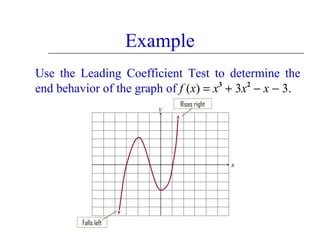
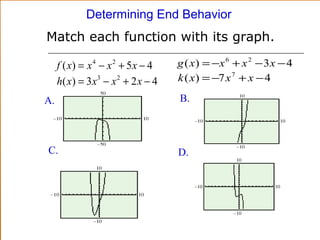
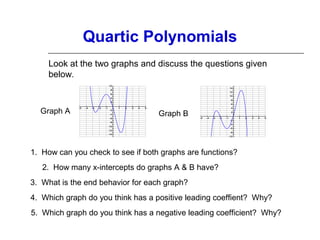
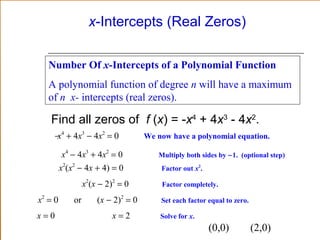

This document discusses polynomial functions and their graphs. It defines polynomial functions as functions of the form P(x) = anxn + an-1xn-1 + ... + a1x + a0, where an is the leading coefficient. The degree of the polynomial determines features of its graph like the maximum number of x-intercepts. The leading coefficient test determines the end behavior of the graph. Key features of polynomial graphs are intercepts, extrema, and end behavior.