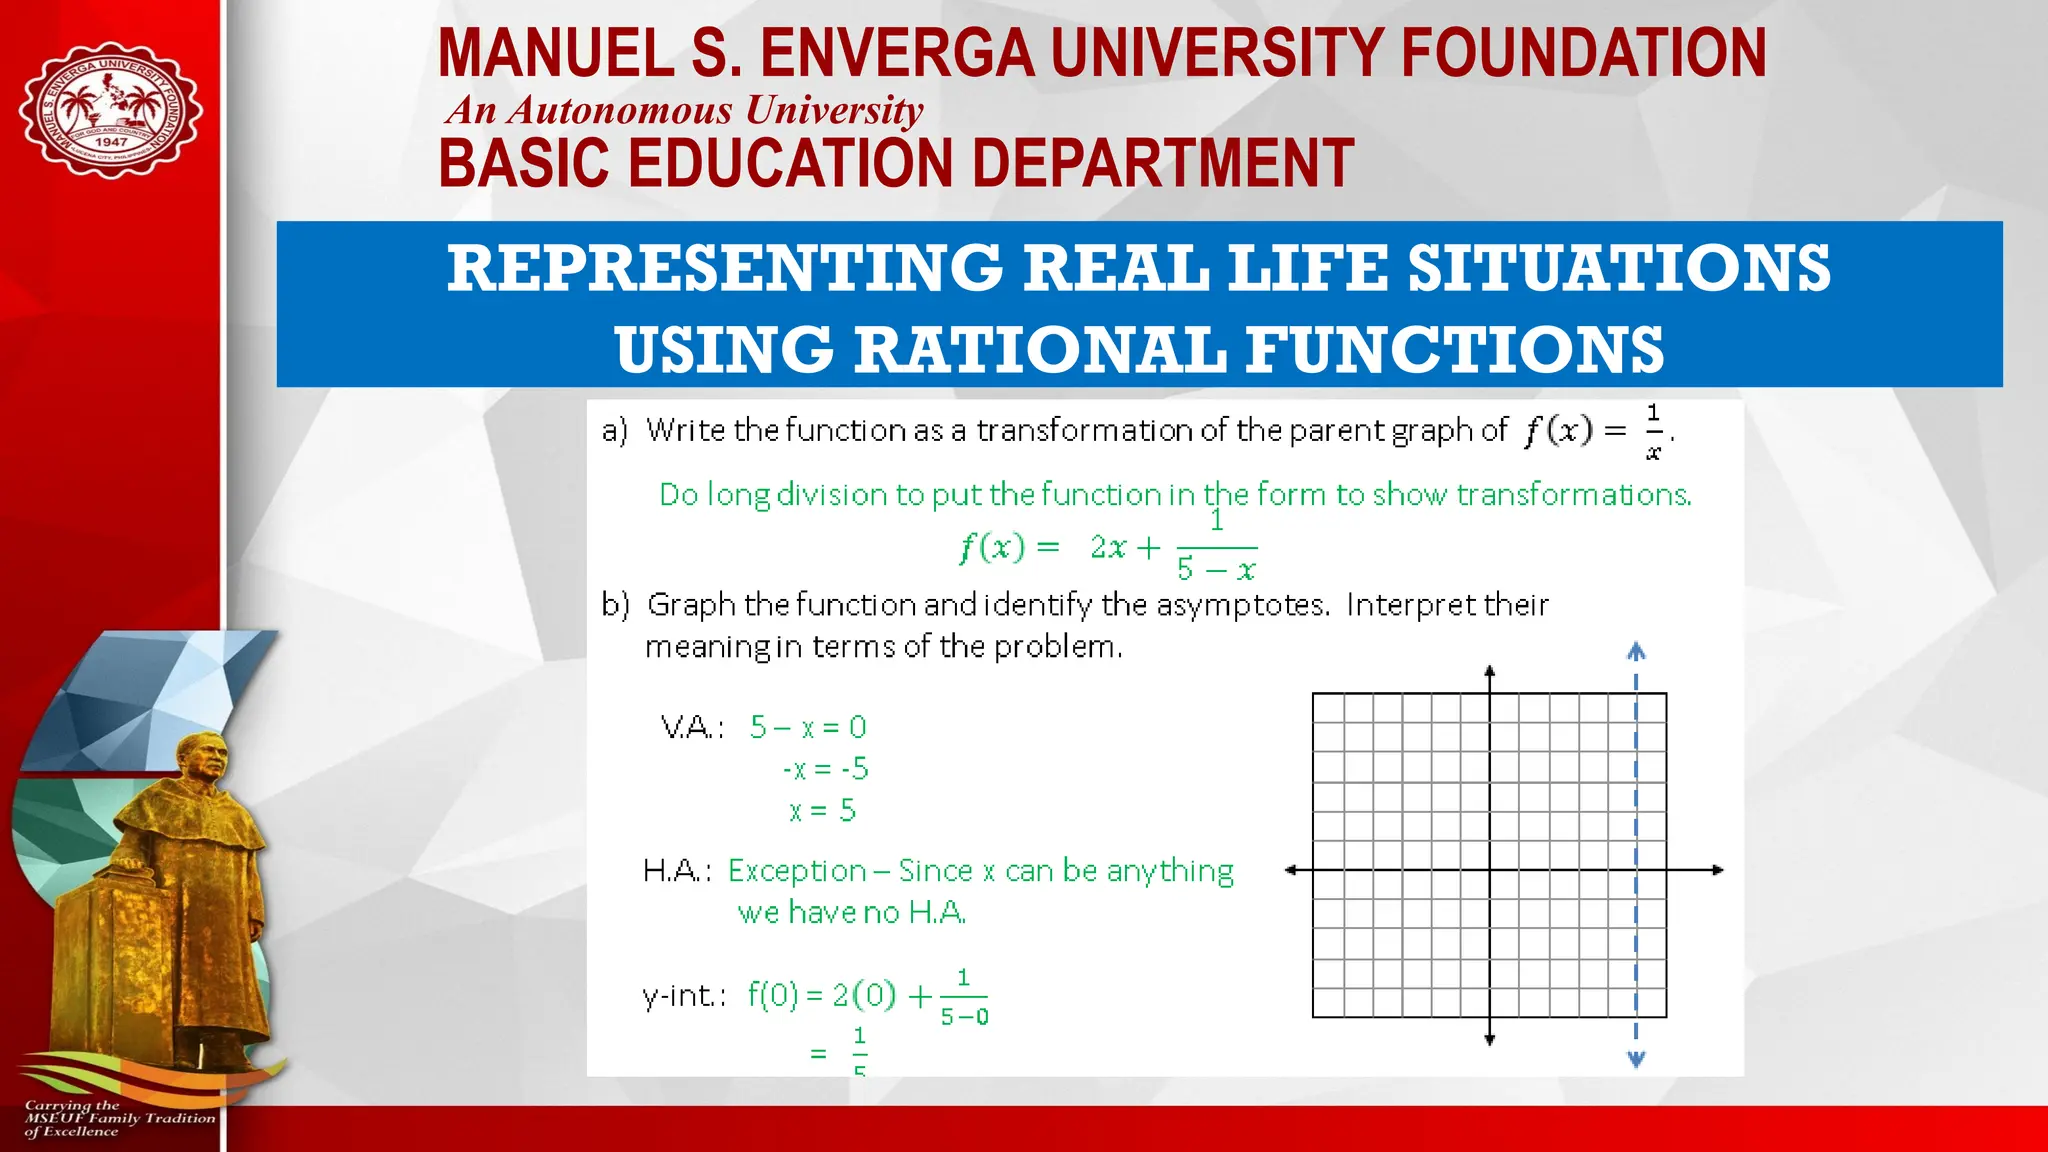
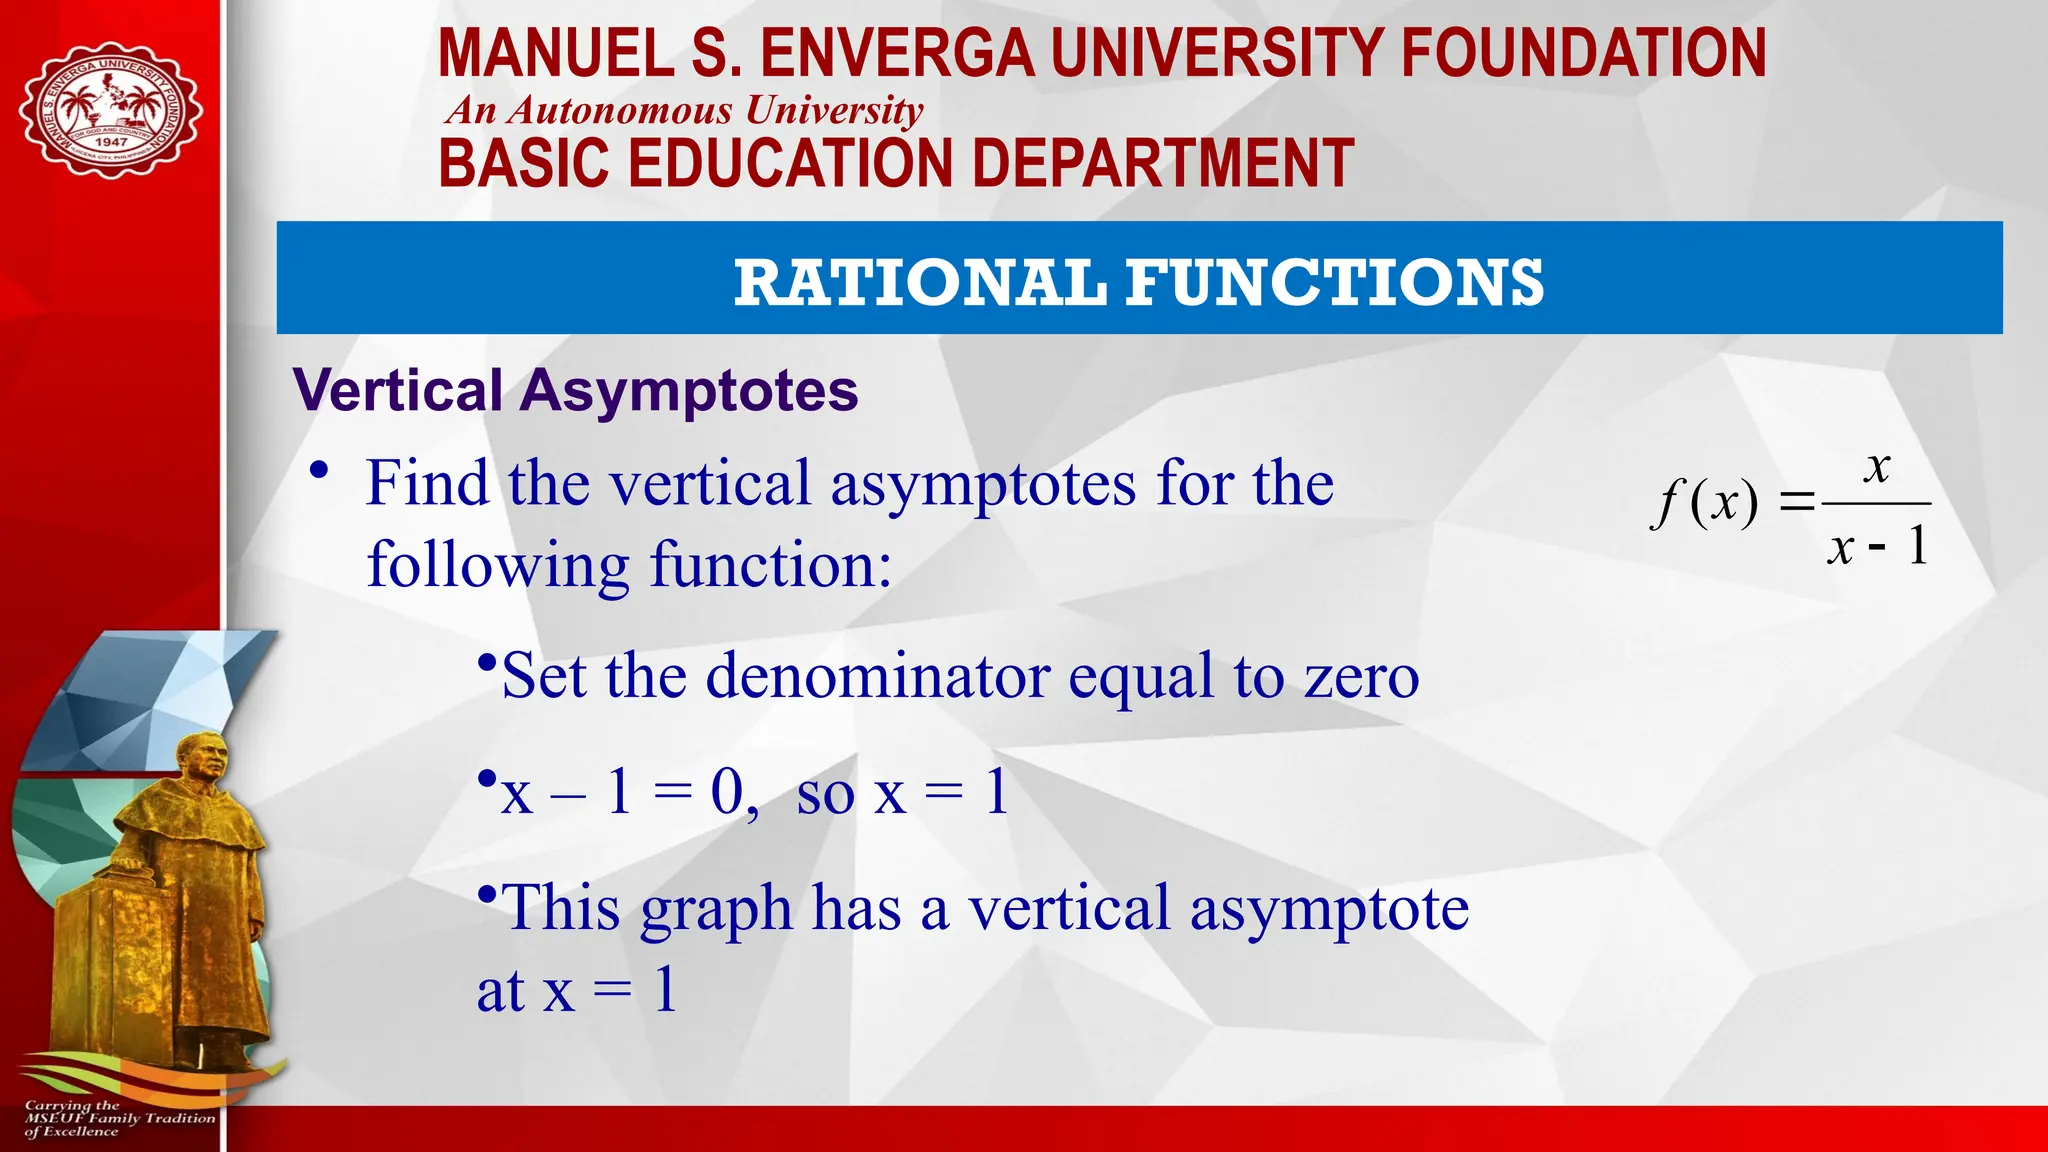
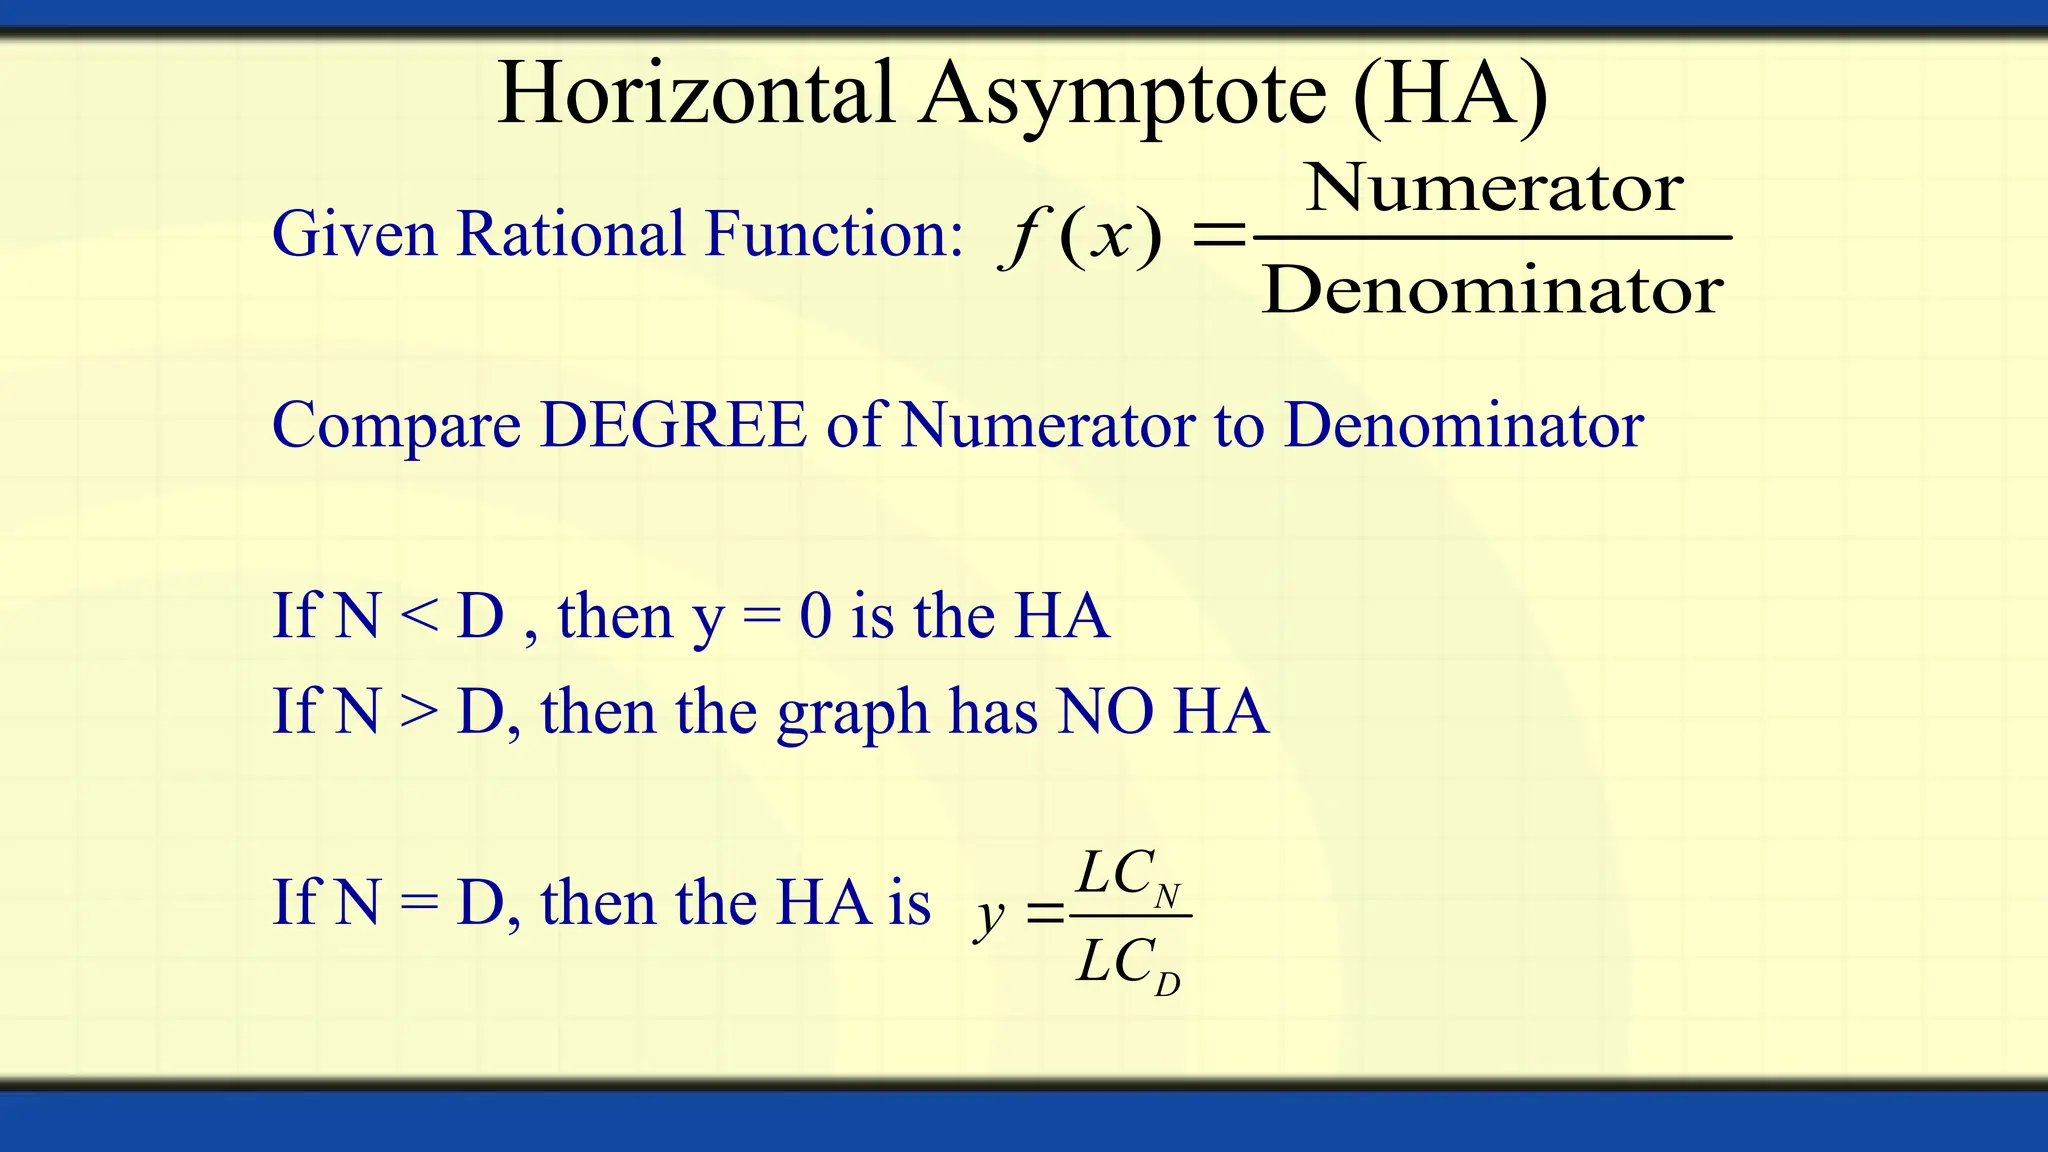
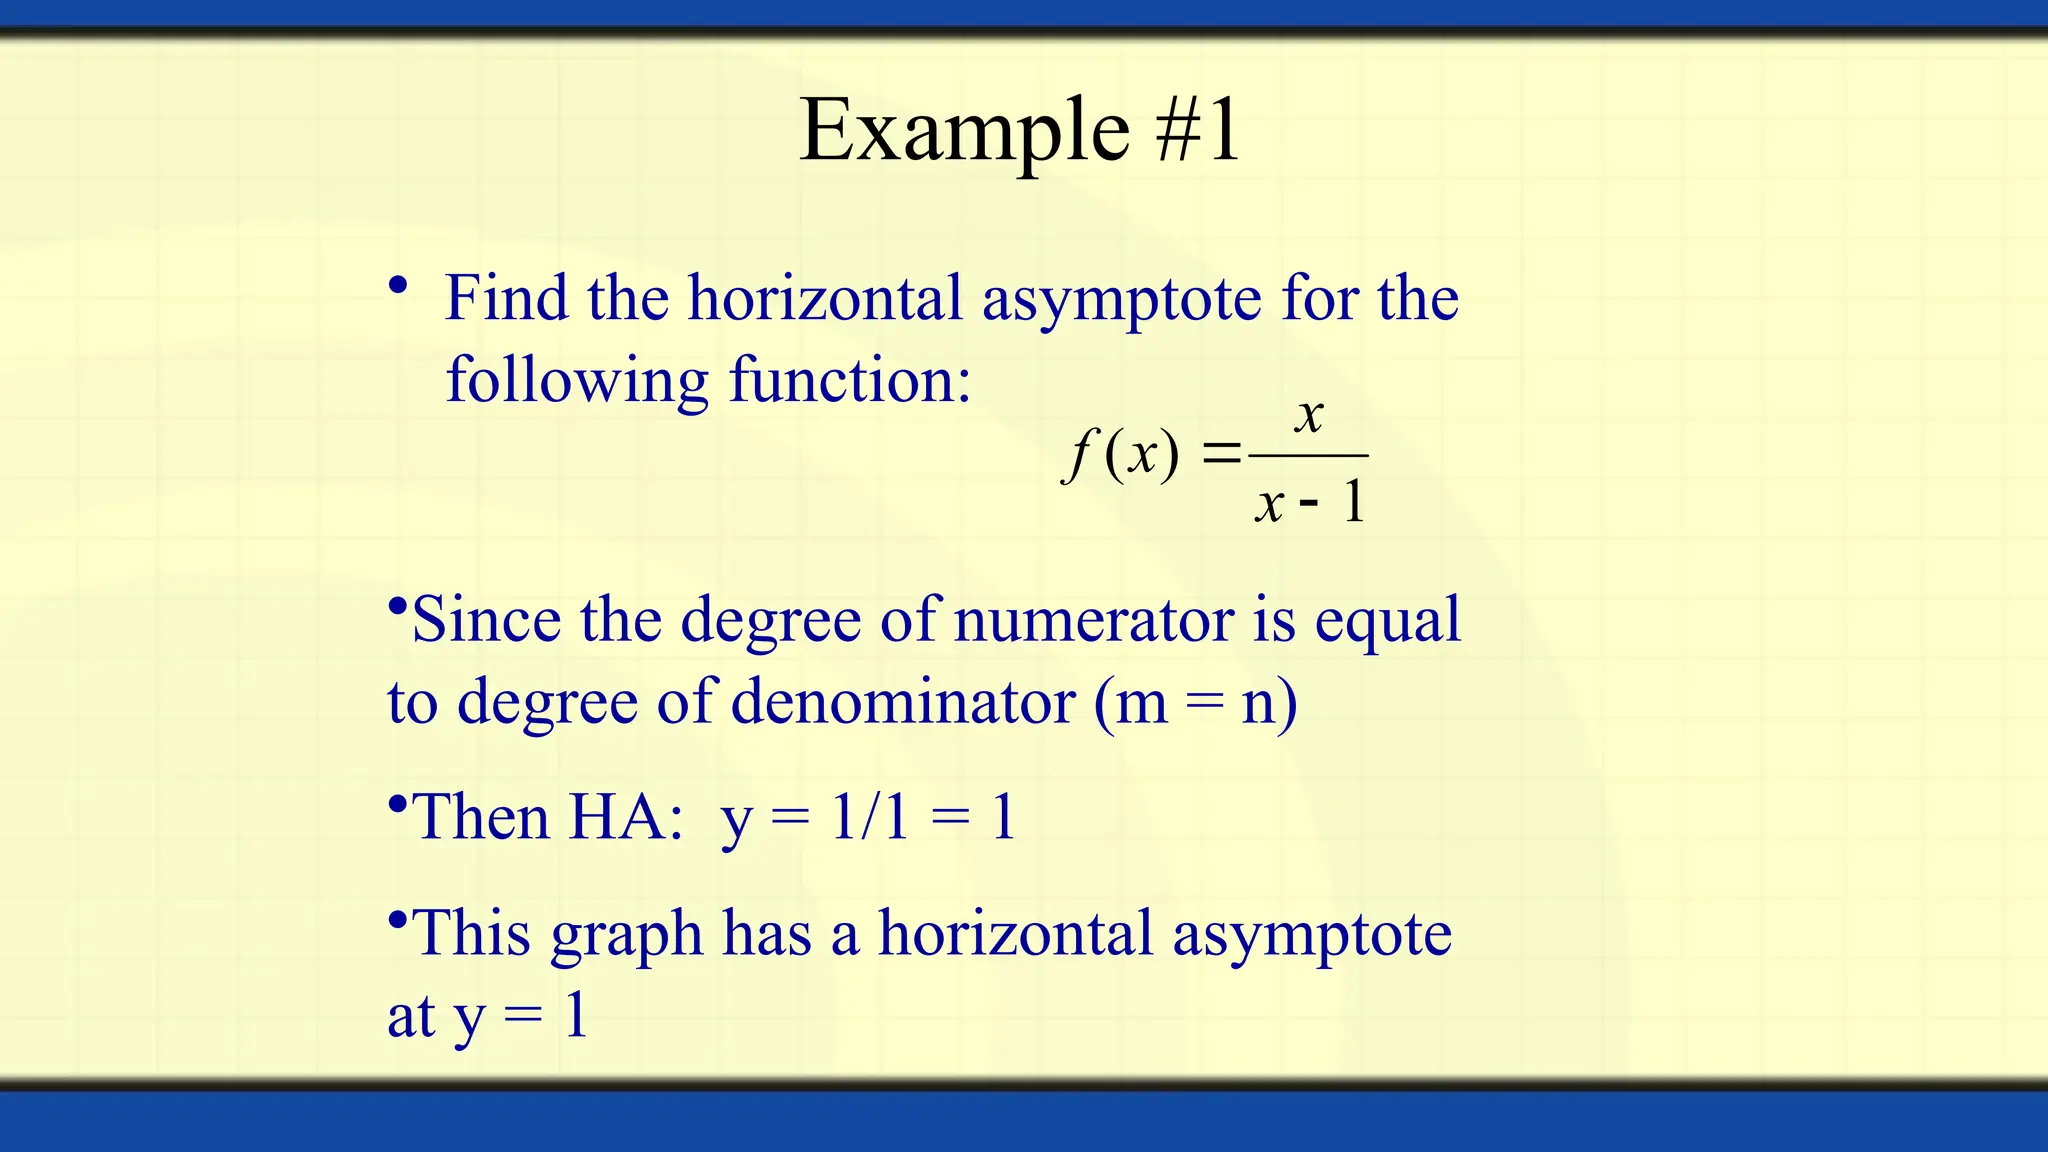
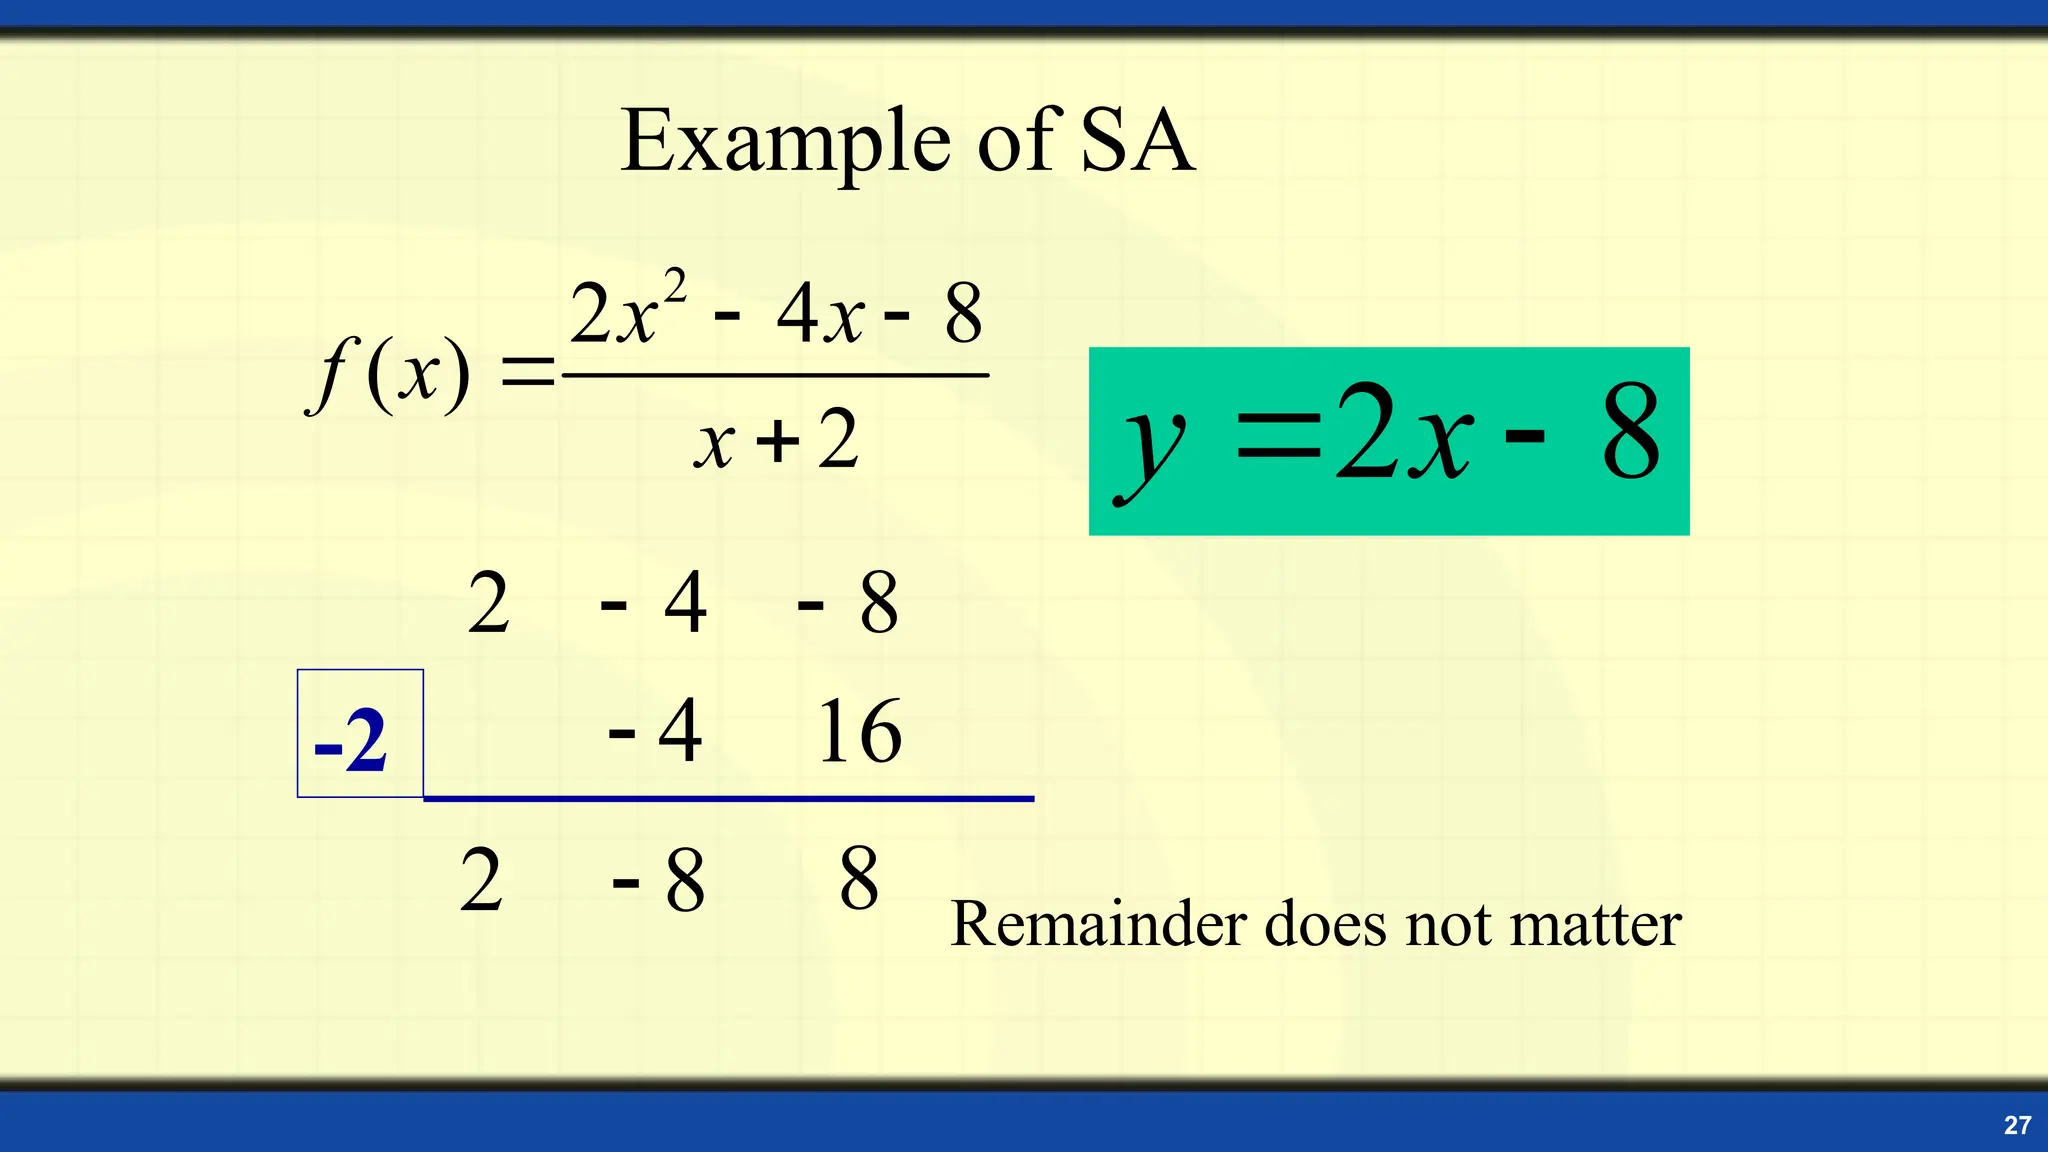
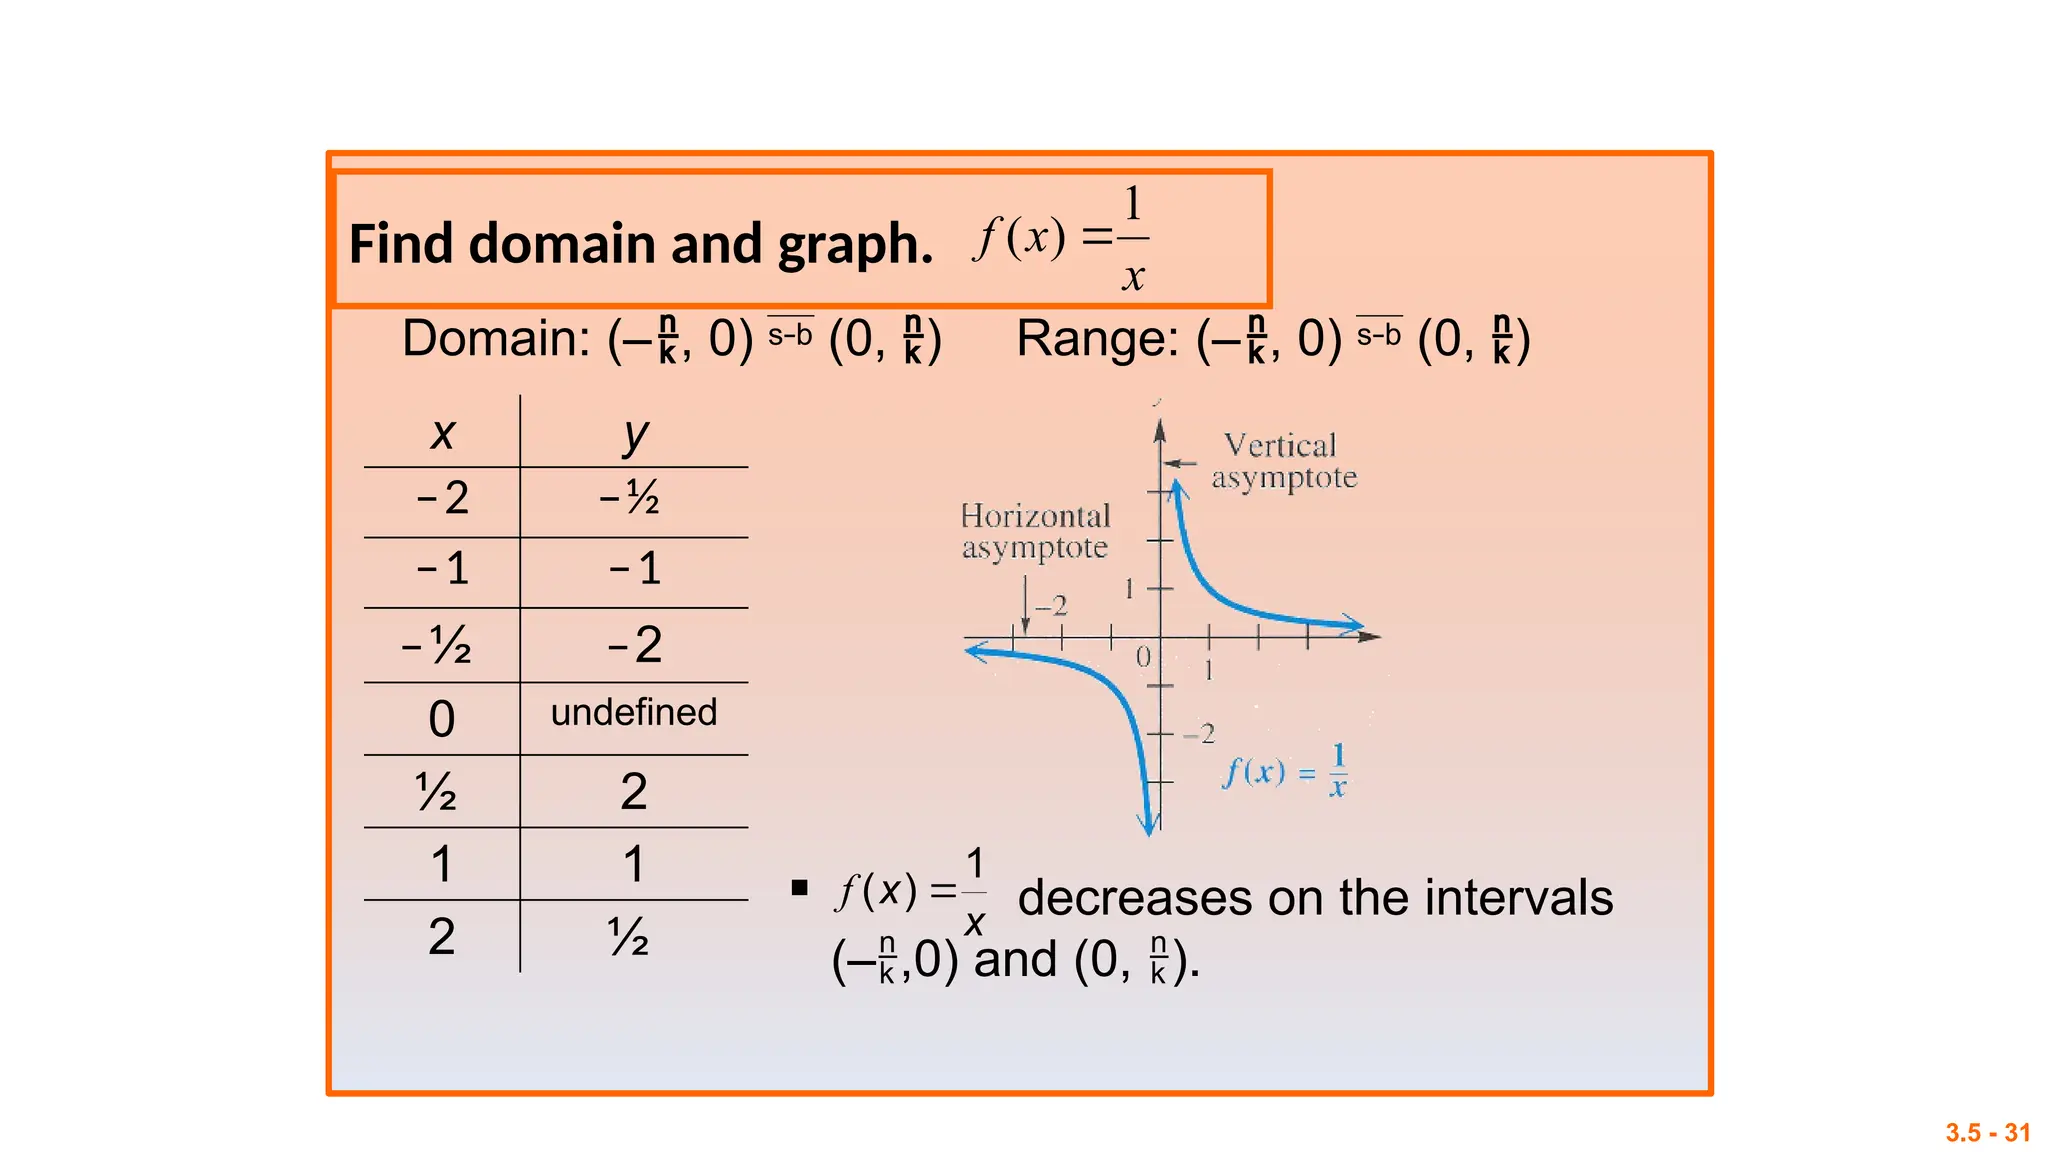
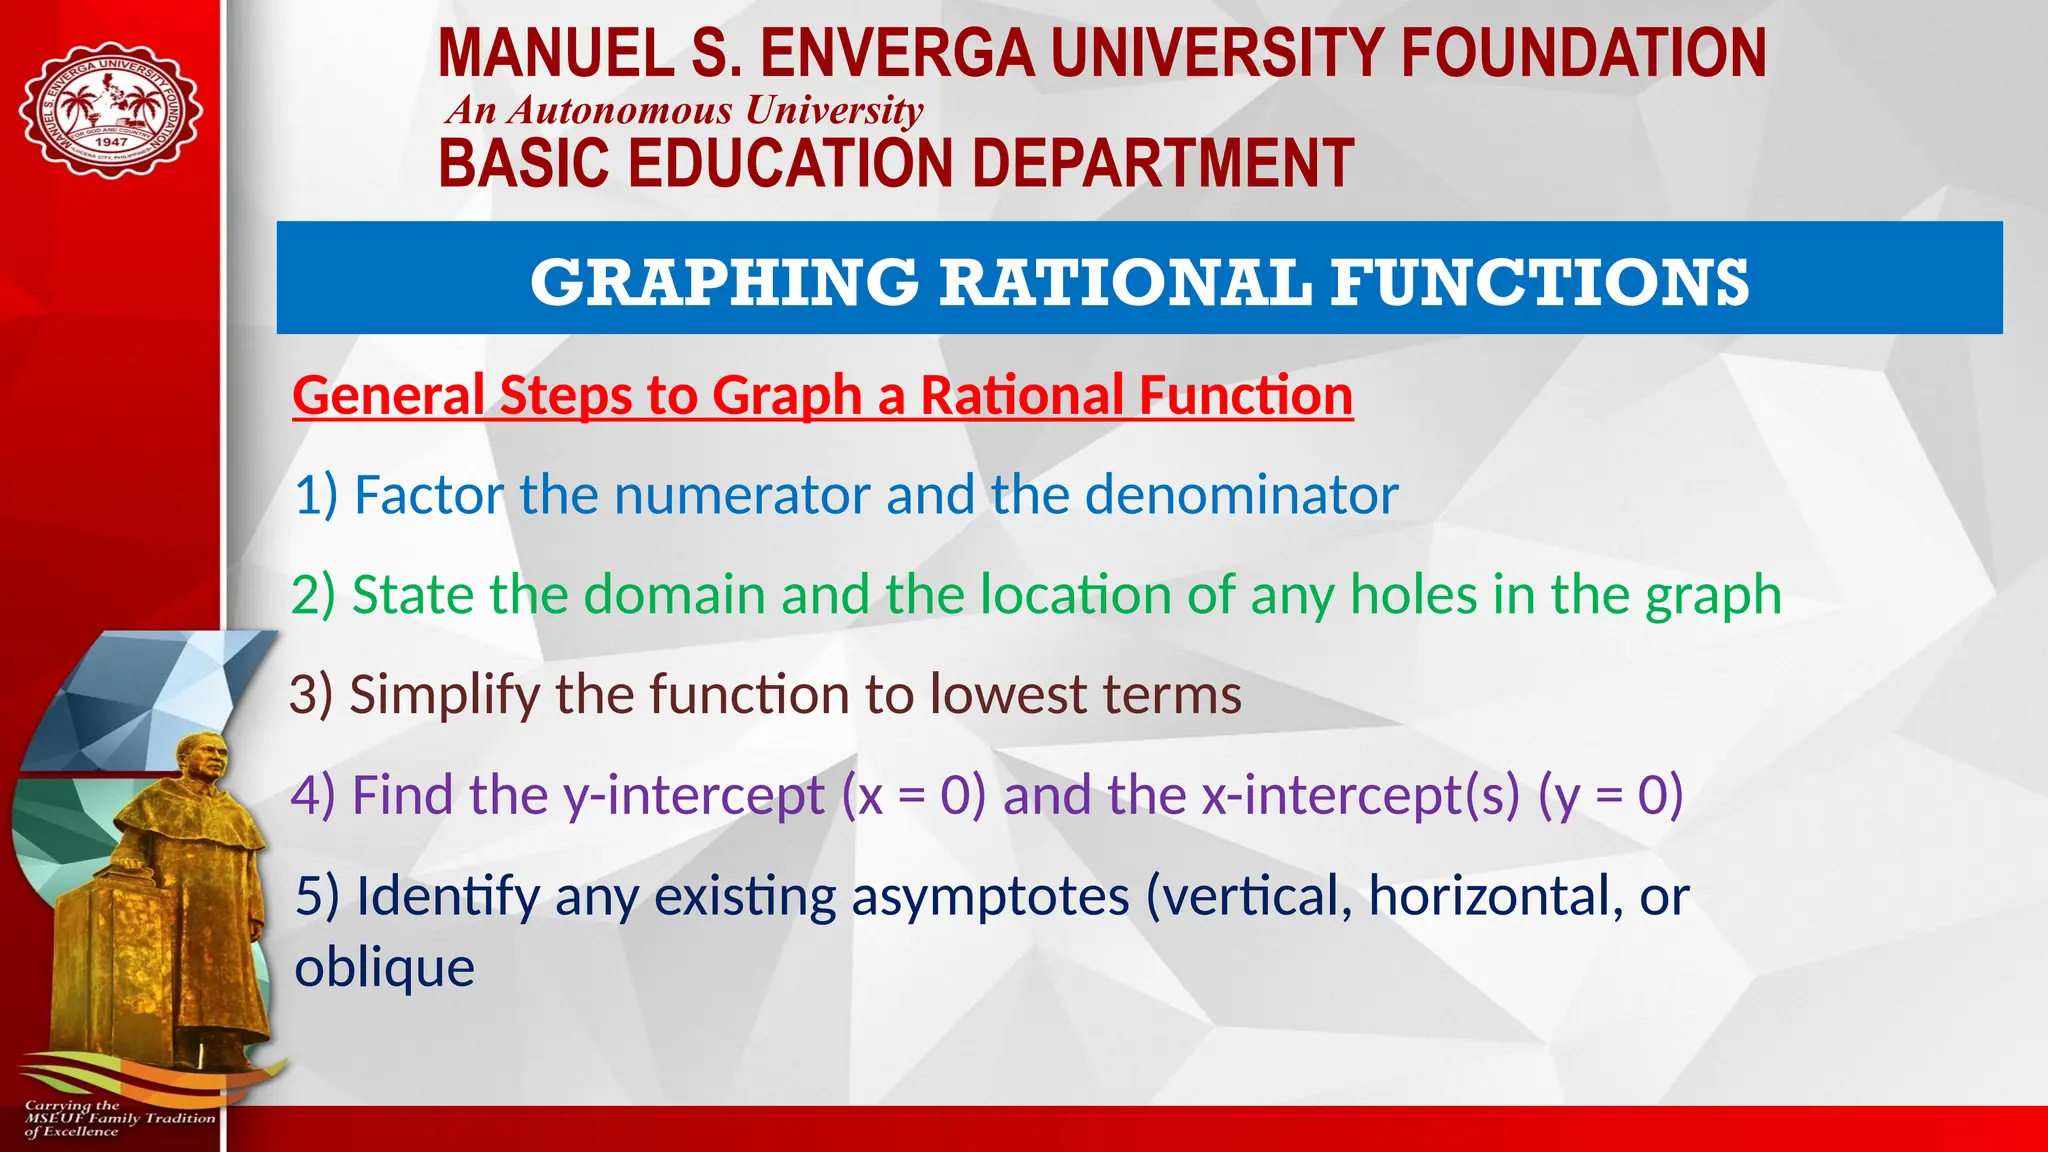
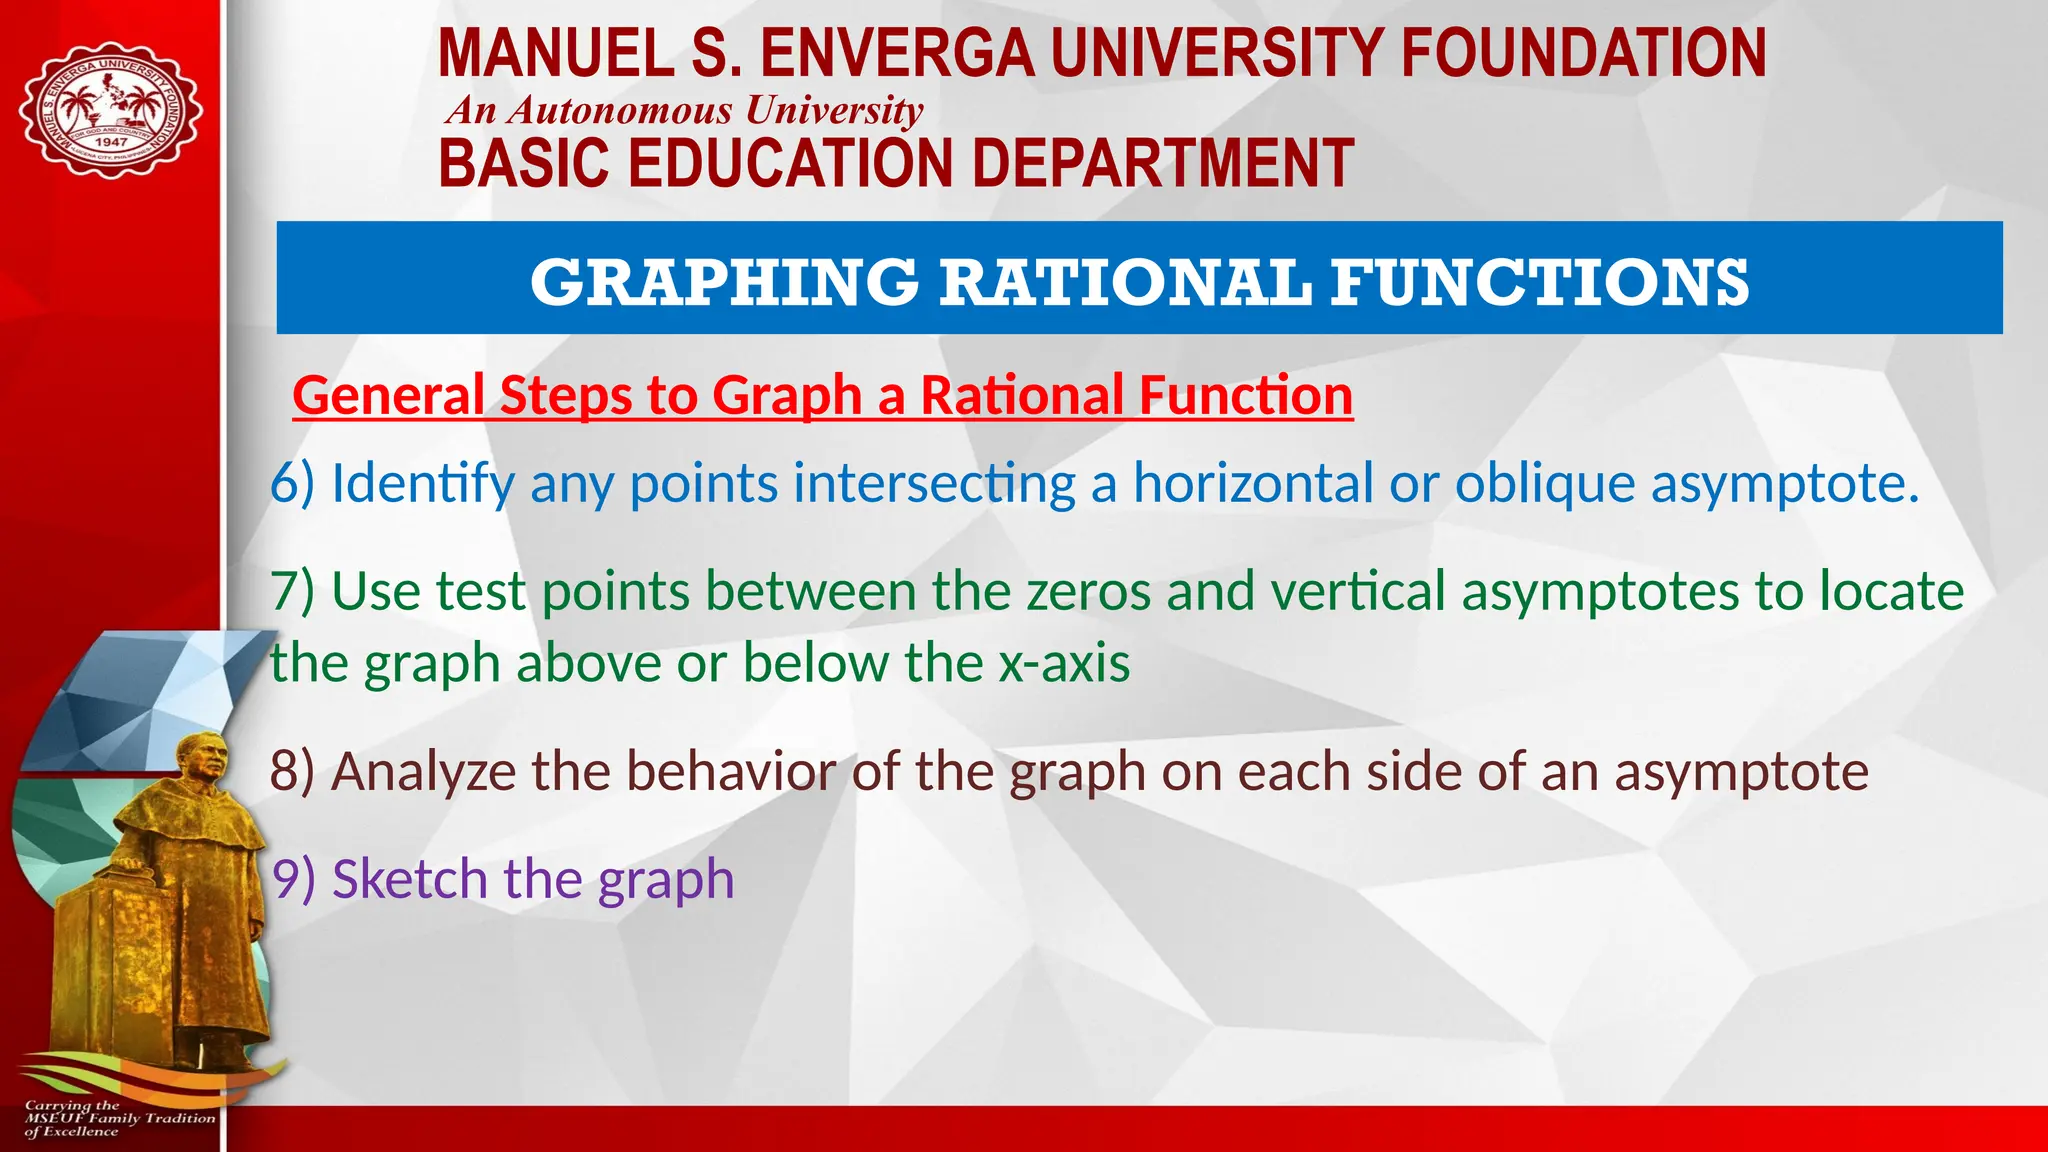
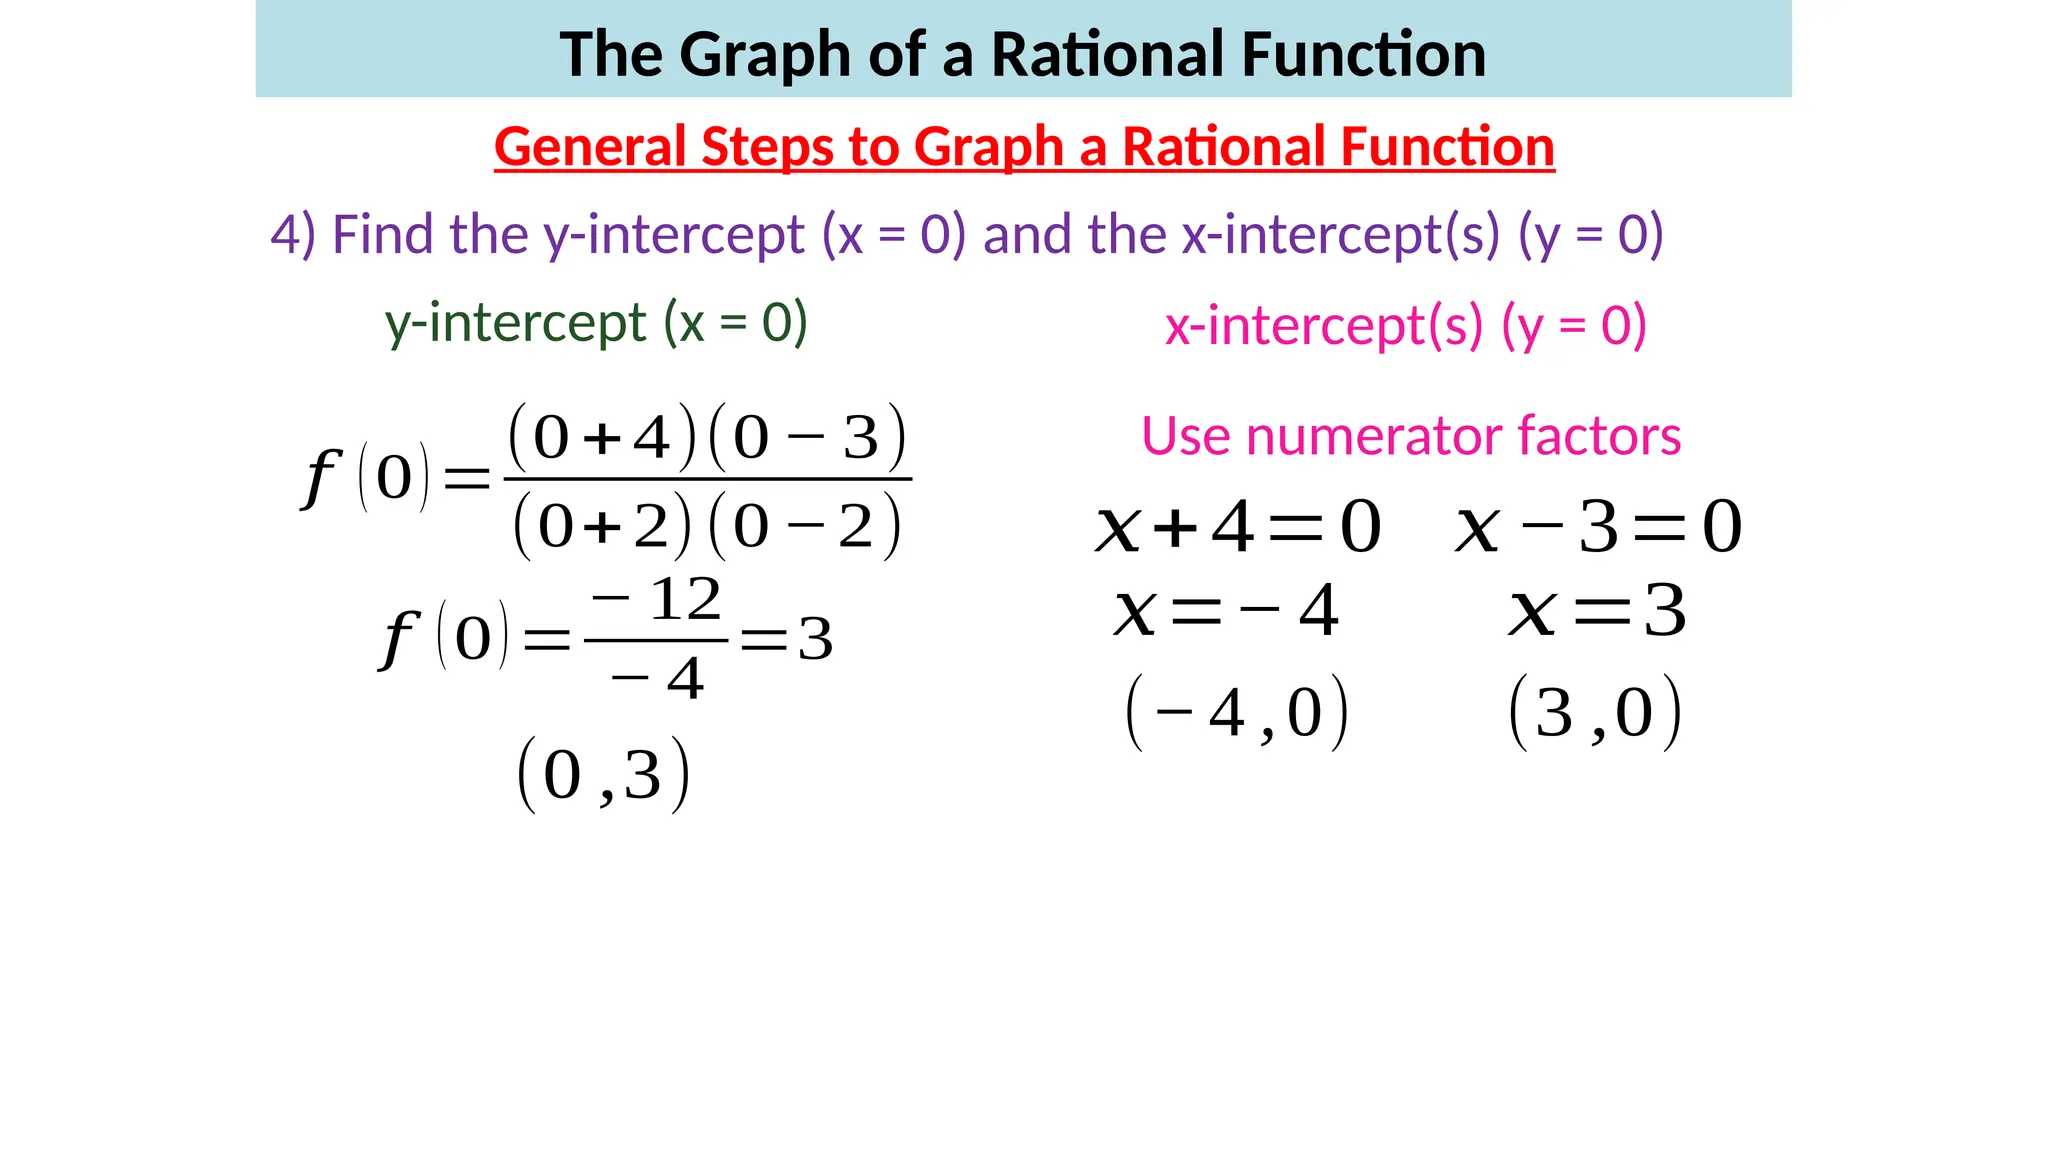
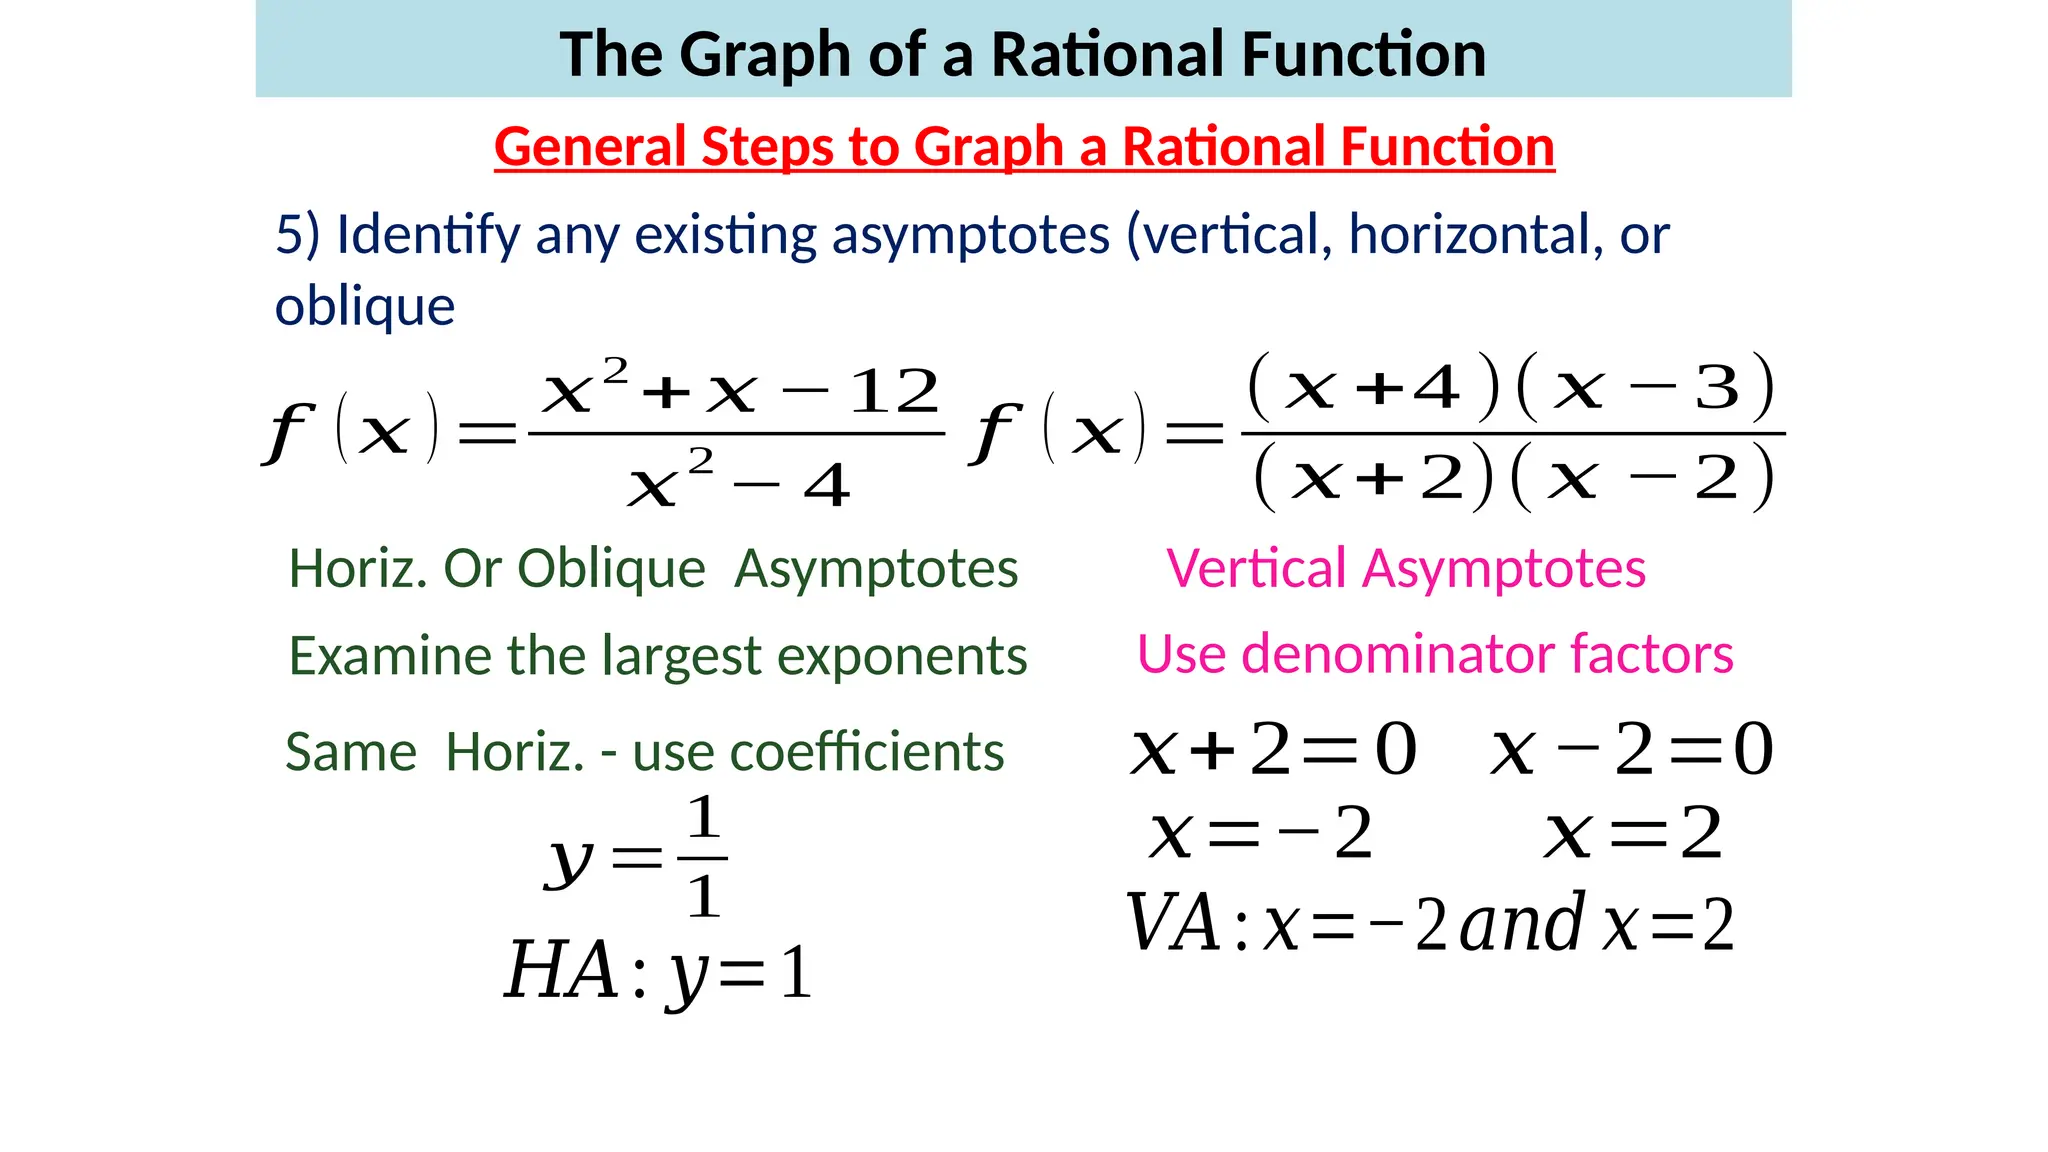
MANUEL S. ENVERGA UNIVERSITY FOUNDATION
An Autonomous University
BASIC EDUCATION DEPARTMENT
Session 2
RATIONAL FUNCTIONS
MSEUF, Lucena City
April 18, 2017
Facilitator: Mr. WILLIAM M. VERZO
MANUEL S. ENVERGA UNIVERSITY FOUNDATION
An Autonomous University
BASIC EDUCATION DEPARTMENT
At the end of the session, the teacher-participants are expected to:
1. represents real-life situations using rational functions.
2. distinguishes rational function, rational equation, and rational
inequality.
3. solves rational equations and inequalities.
4. represents a rational function through its: (a) table of values, (b) graph,
and (c) equation.
5. finds the domain and range of a rational function.
6. determines the: (a) intercepts; (b) zeroes; and asymptotes of rational
functions.
7. graphs rational functions.
8. solves problems involving rational functions, equations, and
inequalities.
MANUEL S. ENVERGA UNIVERSITY FOUNDATION
An Autonomous University
BASIC EDUCATION DEPARTMENT
PRIMING ACTIVITY
1. 3x2
-8x+4
2. 11x2
-99
3. 16x3
+128
Factor the following completely:
4. x3
+2x2
-4x-8
5. 2x2
-x-15
6. 10x3
-80
(3x-2)(x-2)
11(x+3)(x-3)
16(x+2)(x2
-2x+4)
(x-2)(x+2)2
(2x+5)(x-3)
10(x-2)(x2
+2x+4)
MANUEL S. ENVERGA UNIVERSITY FOUNDATION
An Autonomous University
BASIC EDUCATION DEPARTMENT
PRIMING ACTIVITY
• Solve the following rational equation.
x
x
x
x
x
2
4
1
4
12
2





: 1
: 4
Solution x
Extr x


MANUEL S. ENVERGA UNIVERSITY FOUNDATION
An Autonomous University
BASIC EDUCATION DEPARTMENT
PRIMING ACTIVITY
0
8
2
12 2




 x
x
x
0
4
3
2



 x
x
0
4
3
2


 x
x
0
)
1
)(
4
( 

 x
x
1
4 

 x
or
x
x = -4 Extraneous
x = 1
MANUEL S. ENVERGA UNIVERSITY FOUNDATION
An Autonomous University
BASIC EDUCATION DEPARTMENT
ACTIVITY 1 (Group Work) (15 min)
1. Your task is to complete the table to show that the time it takes to
reach the top of wall depends on the climber’s speed.
2. Compare your results and describe their properties.
3. The team leaders of the groups report their conclusions to the whole
class.
Climbing the Wall
MANUEL S. ENVERGA UNIVERSITY FOUNDATION
An Autonomous University
BASIC EDUCATION DEPARTMENT
ANALYSIS
1. What did you find difficult about this task?
2. What task did you find most difficult to do? Why?
3. What information can you get from the equation of a rational graph?
4. What have you learned about the key features of the rational function?
5. What are some common errors which students may commit? How can
we prevent such error? Feel free to offer a suggestion.
MANUEL S. ENVERGA UNIVERSITY FOUNDATION
An Autonomous University
BASIC EDUCATION DEPARTMENT
ABSTRACTION
LEARNING AREA STANDARD:
At the end of the course, the students must know how to solve problems
involving rational, exponential and logarithmic functions; to solve business-
related problems; and to apply logic to real-life situations.
CONTENT STANDARD:
The learner demonstrates understanding of key concepts of rational
functions.
MANUEL S. ENVERGA UNIVERSITY FOUNDATION
An Autonomous University
BASIC EDUCATION DEPARTMENT
ABSTRACTION
PERFORMANCE STANDARD:
The learner is able to accurately formulate and solve real-life problems
involving rational functions.
MANUEL S. ENVERGA UNIVERSITY FOUNDATION
An Autonomous University
BASIC EDUCATION DEPARTMENT
ABSTRACTION
LEARNING COMPETENCIES:
The learners ...
a. represents real-life situations using rational functions.
b. distinguishes rational function, rational equation, and rational
inequality.
c. solves rational equations and inequalities.
d. represents a rational function through its: (a) table of values, (b) graph,
and (c) equation.
e. finds the domain and range of a rational function.
MANUEL S. ENVERGA UNIVERSITY FOUNDATION
An Autonomous University
BASIC EDUCATION DEPARTMENT
ABSTRACTION
LEARNING COMPETENCIES:
The learners ...
f. determines the: (a) intercepts; (b) zeroes; and asymptotes of rational
functions.
g. graphs rational functions.
h. solves problems involving rational functions, equations, and
inequalities.
MANUEL S. ENVERGA UNIVERSITY FOUNDATION
An Autonomous University
BASIC EDUCATION DEPARTMENT
Many real-world problems can be modeled by rational functions.
REPRESENTING REAL LIFE SITUATIONS
USING RATIONAL FUNCTIONS
MANUEL S. ENVERGA UNIVERSITY FOUNDATION
An Autonomous University
BASIC EDUCATION DEPARTMENT
REPRESENTING REAL LIFE SITUATIONS
USING RATIONAL FUNCTIONS
MANUEL S. ENVERGA UNIVERSITY FOUNDATION
An Autonomous University
BASIC EDUCATION DEPARTMENT
RATIONAL FUNCTIONS
Rational Expression
 It is the quotient of two polynomials.
 A rational function is any ratio of two polynomials, where
denominator cannot be ZERO!
Examples:
2
5
x
y
x



2
3 2
3 2 5
4 5 7
x x
y
x x x
 

  
Not Rational:
4
2
x
y
x

 2
5
x
y
x


MANUEL S. ENVERGA UNIVERSITY FOUNDATION
An Autonomous University
BASIC EDUCATION DEPARTMENT
RATIONAL FUNCTIONS
Asymptotes
 Asymptotes are the boundary lines that a rational function
approaches, but never crosses.
 We draw these as Dashed Lines on our graphs.
 There are three types of asymptotes:
Vertical
Horizontal (Graph can cross these)
Slant
MANUEL S. ENVERGA UNIVERSITY FOUNDATION
An Autonomous University
BASIC EDUCATION DEPARTMENT
RATIONAL FUNCTIONS
Vertical Asymptotes
 Vertical Asymptotes exist where the denominator would be zero.
 They are graphed as Vertical Dashed Lines
 There can be more than one!
 To find them, set the denominator equal to zero and solve for “x”
MANUEL S. ENVERGA UNIVERSITY FOUNDATION
An Autonomous University
BASIC EDUCATION DEPARTMENT
RATIONAL FUNCTIONS
Vertical Asymptotes
1
)
(


x
x
x
f
•Set the denominator equal to zero
•x – 1 = 0, so x = 1
•This graph has a vertical asymptote
at x = 1
• Find the vertical asymptotes for the
following function:
1 2 6
3 4 5 7 8 9 1
0
4
3
2
7
5
6
8
9
x-
axis
y-
axis
0
1
-2
-6 -3
-4
-5
-7
-8
-9
1
0
-4
-3
-2
-1
-7
-5
-6
-8
-9
0
-1
Vertical
Asymptote at
X = 1
Other Examples:
• Find the vertical asymptotes for the following
functions:
3
3
)
(


x
x
g
)
5
)(
2
(
1
)
(




x
x
x
x
g
3
: 
x
VA
5
:
2
:



x
VA
x
VA
Horizontal Asymptotes
• Horizontal Asymptotes are also Dashed Lines drawn
horizontally to represent another boundary.
• To find the horizontal asymptote you compare the degree
of the numerator with the degree of the denominator
Horizontal Asymptote (HA)
Given Rational Function:
Compare DEGREE of Numerator to Denominator
If N < D , then y = 0 is the HA
If N > D, then the graph has NO HA
If N = D, then the HA is
Numerator
( )
Denominator
f x 
N
D
LC
y
LC

Example #1
• Find the horizontal asymptote for the
following function:
1
)
(


x
x
x
f
•Since the degree of numerator is equal
to degree of denominator (m = n)
•Then HA: y = 1/1 = 1
•This graph has a horizontal asymptote
at y = 1
1 2 6
3 4 5 7 8 9 1
0
4
3
2
7
5
6
8
9
x-
axis
y-
axis
0
1
-2
-6 -3
-4
-5
-7
-8
-9
1
0
-4
-3
-2
-1
-7
-5
-6
-8
-9
0
-1
Horizontal
Asymptote at
y = 1
Other Examples:
• Find the horizontal asymptote for the following
functions:
3
3
)
(


x
x
g
1
3
1
3
)
( 2
2




x
x
x
x
g
5
1
)
(
3



x
x
x
g
0
: 
y
HA
3
: 
y
HA
None
HA :
Slant Asymptotes (SA)
• Slant asymptotes exist when the degree of the numerator is
one larger than the denominator.
• Cannot have both a HA and SA
• To find the SA, divide the Numerator by the Denominator.
• The results is a line y = mx + b that is the SA.
Example of SA
27
2
2 4 8
( )
2
x x
f x
x
 


2 4 8
 
-2
2
4

8

16
8
2 8
y x
 
Remainder does not matter
28
Holes
• A hole exists when the same factor
exists in both the numerator and
denominator of the rational
expression and the factor is
eliminated when you reduce!
Example of Hole Discontinuity
29
( 4)( 1)
( )
( 2)( 4)
x x
f x
x x
 

 
Cancel LIKE factors
( 1)
( )
( 2)
x
f x
x



 
____, ____
4

( 4 1) 5 5
( 4 2) 6 6
  
 
  
5
6
3.5 - 30
Domain: (–, 0)  (0, ) Range: (–, 0)  (0, )
Find domain and graph.
x y
–2 –½
–1 –1
–½ –2
0 undefined
½ 2
1 1
2 ½
x
x
f
1
)
( 
 It is discontinuous at x = 0.
3.5 - 31
Domain: (–, 0)  (0, ) Range: (–, 0)  (0, )
Find domain and graph.
x y
–2 –½
–1 –1
–½ –2
0 undefined
½ 2
1 1
2 ½
 decreases on the intervals
(–,0) and (0, ).
1
( )
x
x

f
x
x
f
1
)
( 
3.5 - 32
Domain: (–, 0)  (0, ) Range: (–, 0)  (0, )
Find domain and graph.
x y
–2 –½
–1 –1
–½ –2
0 undefined
½ 2
1 1
2 ½
x
x
f
1
)
( 
 The y-axis is a vertical
asymptote, and the x-axis is
a horizontal asymptote.
3.5 - 33
Domain: (–, 0)  (0, ) Range: (–, 0)  (0, )
Find domain and graph.
x y
–2 –½
–1 –1
–½ –2
0 undefined
½ 2
1 1
2 ½
x
x
f
1
)
( 
 It is an odd function and its
graph is symmetric with respect
to the origin.
3.5 - 34
Domain: (–, 0)  (0, ) Range: (0, )
Find domain and graph.
x y
 3
 2 ¼
 1 1
 ½ 4
 ¼ 16
0 undefined
 increases on the interval (–,0) and
decreases on the interval (0, ).
2
1
( )
x
x

f
1
9
2
1
( )
x
x

f
3.5 - 35
Domain: (–, 0)  (0, ) Range: (0, )
Find domain and graph.
x y
 3
 2 ¼
 1 1
 ½ 4
 ¼ 16
0 undefined
It is discontinuous at x = 0.
1
9
2
1
( )
x
x

f
3.5 - 36
Domain: (–, 0)  (0, ) Range: (0, )
Find domain and graph.
x y
 3
 2 ¼
 1 1
 ½ 4
 ¼ 16
0 undefined
 The y-axis is a vertical asymptote, and the x-axis is a
horizontal asymptote.
1
9
2
1
( )
x
x

f
3.5 - 37
Domain: (–, 0)  (0, ) Range: (0, )
Find domain and graph.
x y
 3
 2 ¼
 1 1
 ½ 4
 ¼ 16
0 undefined
 It is an even function, and Its graph is symmetric with
respect to the y-axis.
1
9
2
1
( )
x
x

f
MANUEL S. ENVERGA UNIVERSITY FOUNDATION
An Autonomous University
BASIC EDUCATION DEPARTMENT
RATIONAL EQUATIONS
MANUEL S. ENVERGA UNIVERSITY FOUNDATION
An Autonomous University
BASIC EDUCATION DEPARTMENT
RATIONAL INEQUALITIES
MANUEL S. ENVERGA UNIVERSITY FOUNDATION
An Autonomous University
BASIC EDUCATION DEPARTMENT
RATIONAL FUNCTIONS
Lesson 4: Representations of Rational Functions
Lesson 4:
MANUEL S. ENVERGA UNIVERSITY FOUNDATION
An Autonomous University
BASIC EDUCATION DEPARTMENT
GRAPHING RATIONAL FUNCTIONS
General Steps to Graph a Rational Function
1) Factor the numerator and the denominator
2) State the domain and the location of any holes in the graph
3) Simplify the function to lowest terms
4) Find the y-intercept (x = 0) and the x-intercept(s) (y = 0)
5) Identify any existing asymptotes (vertical, horizontal, or
oblique
MANUEL S. ENVERGA UNIVERSITY FOUNDATION
An Autonomous University
BASIC EDUCATION DEPARTMENT
GRAPHING RATIONAL FUNCTIONS
General Steps to Graph a Rational Function
6) Identify any points intersecting a horizontal or oblique asymptote.
7) Use test points between the zeros and vertical asymptotes to locate
the graph above or below the x-axis
8) Analyze the behavior of the graph on each side of an asymptote
9) Sketch the graph
The Graph of a Rational Function
General Steps to Graph a Rational Function
4) Find the y-intercept (x = 0) and the x-intercept(s) (y = 0)
y-intercept (x = 0) x-intercept(s) (y = 0)
𝑓 (0)=
(0+4)(0− 3)
(0+2)(0−2)
𝑓 (0)=
− 12
− 4
=3
(0 ,3)
Use numerator factors
𝑥+4=0 𝑥−3=0
𝑥=−4 𝑥=3
(−4 ,0) (3 ,0)
The Graph of a Rational Function
General Steps to Graph a Rational Function
5) Identify any existing asymptotes (vertical, horizontal, or
oblique
Horiz. Or Oblique Asymptotes Vertical Asymptotes
𝑦 =
1
1
𝐻𝐴: 𝑦=1
Use denominator factors
𝑥+2=0 𝑥−2=0
𝑥=−2 𝑥=2
𝑉𝐴:𝑥=−2𝑎𝑛𝑑 𝑥=2
𝑓 (𝑥 )=
𝑥2
+ 𝑥 −12
𝑥
2
− 4
𝑓 ( 𝑥)=
(𝑥 +4 )( 𝑥 −3)
(𝑥+ 2)(𝑥 −2)
Examine the largest exponents
Same Horiz. - use coefficients
The Graph of a Rational Function
General Steps to Graph a Rational Function
6) Identify any points intersecting a horizontal or oblique
asymptote.
𝑦 =1 𝑎𝑛𝑑 𝑓 ( 𝑥) =
𝑥2
+ 𝑥 − 12
𝑥
2
− 4
1=
𝑥 2
+ 𝑥 − 12
𝑥
2
− 4
𝑥 2
− 4 = 𝑥 2
+ 𝑥 − 12
− 4 = 𝑥 − 12
8 = 𝑥
( 8,1 )
The Graph of a Rational Function
General Steps to Graph a Rational Function
𝑓 (𝑥)=
(𝑥+4)(𝑥 −3)
(𝑥+2)(𝑥− 2)
7) Use test points between the zeros and vertical asymptotes
to locate the graph above or below the x-axis
-4 -2 2 3
𝑓 (−5)=
(−5+4)(−5− 3)
(−5+2)(−5−2)
𝑓 (−5)=
(−)(−)
(−)(−)
=+¿
𝑓 (−5)=𝑎𝑏𝑜𝑣𝑒
𝑓 (−3 )=¿¿
𝑓 (−3 )=𝑏𝑒𝑙𝑜𝑤
𝑓 (0)=¿ ¿
𝑓 (0)=𝑎𝑏𝑜𝑣𝑒
𝑎𝑏𝑜𝑣𝑒 𝑏𝑒𝑙𝑜𝑤 𝑎𝑏𝑜𝑣𝑒
The Graph of a Rational Function
General Steps to Graph a Rational Function
𝑓 (𝑥)=
(𝑥+4)(𝑥 −3)
(𝑥+2)(𝑥− 2)
7) Use test points between the zeros and vertical asymptotes
to locate the graph above or below the x-axis
-4 -2 2 3
𝑓 (2.5)=¿¿
𝑓 (2.5)=𝑏𝑒𝑙𝑜𝑤
𝑓 (4 )=¿ ¿
𝑓 (4 )=𝑎𝑏𝑜𝑣𝑒
𝑎𝑏𝑜𝑣𝑒 𝑏𝑒𝑙𝑜𝑤 𝑎𝑏𝑜𝑣𝑒 𝑏𝑒𝑙𝑜𝑤 𝑎𝑏𝑜𝑣𝑒
The Graph of a Rational Function
General Steps to Graph a Rational Function
𝑓 (𝑥)=
(𝑥+4)(𝑥 −3)
(𝑥+2)(𝑥− 2)
𝑥 → −2−
𝑎𝑏𝑜𝑣𝑒
-4 -2 2 3
𝑎𝑏𝑜𝑣𝑒 𝑏𝑒𝑙𝑜𝑤 𝑎𝑏𝑜𝑣𝑒 𝑏𝑒𝑙𝑜𝑤
8) Analyze the behavior of the graph on each side of an
asymptote
𝑓 (𝑥)→¿¿ 𝑓 (𝑥)→−∞
𝑥→−2
+¿ ¿
𝑓 (𝑥)→¿¿ 𝑓 (𝑥)→∞
The Graph of a Rational Function
General Steps to Graph a Rational Function
𝑓 (𝑥)=
(𝑥+4)(𝑥 −3)
(𝑥+2)(𝑥− 2)
𝑥 → 2−
8) Analyze the behavior of the graph on each side of an
asymptote
𝑓 (𝑥)→¿¿ 𝑓 (𝑥)→∞
𝑥→2
+¿ ¿
𝑓 (𝑥)→¿¿ 𝑓 (𝑥)→−∞
𝑎𝑏𝑜𝑣𝑒
-4 -2 2 3
𝑎𝑏𝑜𝑣𝑒 𝑏𝑒𝑙𝑜𝑤 𝑎𝑏𝑜𝑣𝑒 𝑏𝑒𝑙𝑜𝑤
The Graph of a Rational Function
9) Sketch the graph
The Graph of a Rational Function
Example
1) Factor the numerator and the denominator
2) State the domain and the location of any holes in the graph
3) Simplify the function to lowest terms
𝑓 ( 𝑥 ) =
( 𝑥 − 2 )
( 𝑥 + 3 )
𝑓 ( 𝑥 ) =
𝑥 2
+3 𝑥 − 10
𝑥
2
+8 𝑥 +15
𝑓 ( 𝑥 ) =
( 𝑥 +5 ) (𝑥 − 2 )
( 𝑥 + 5 )( 𝑥 + 3 )
Domain:
Hole in the graph at
The Graph of a Rational Function
General Steps to Graph a Rational Function
4) Find the y-intercept (x = 0) and the x-intercept(s) (y = 0)
y-intercept (x = 0) x-intercept(s) (y = 0)
𝑓 (0)=
(0 − 2)
(0+3)
𝑓 (0)=−
2
3
(0 ,−
2
3
)
Use numerator factors
𝑥−2=0
𝑥=2
(2,0)
The Graph of a Rational Function
General Steps to Graph a Rational Function
5) Identify any existing asymptotes (vertical, horizontal, or
oblique
Horiz. Or Oblique Asymptotes Vertical Asymptotes
𝑦 =
1
1
𝐻𝐴: 𝑦=1
Use denominator factors
𝑥+3=0
𝑥=−3
𝑉𝐴: 𝑥=−3
𝑓 (𝑥 )=
𝑥2
+3 𝑥 −10
𝑥
2
+8 𝑥 +15
𝑓 (𝑥 )=
( 𝑥 −2)
( 𝑥+ 3)
Examine the largest exponents
Same Horiz. - use coefficients
The Graph of a Rational Function
General Steps to Graph a Rational Function
6) Identify any points intersecting a horizontal or oblique
asymptote.
𝑦 =1 𝑎𝑛𝑑 𝑓 ( 𝑥 ) =
𝑥 − 2
𝑥 +3
1=
𝑥 − 2
𝑥 + 3
𝑥 + 3 =𝑥 − 2
3 = − 2
𝑙𝑜𝑠𝑡 𝑣𝑎𝑟𝑖𝑎𝑏𝑙𝑒
𝑛𝑜𝑝𝑜𝑖𝑛𝑡𝑠𝑜𝑓 𝑖𝑛𝑡𝑒𝑟𝑠𝑒𝑐𝑡𝑖𝑜𝑛𝑜𝑛 h
𝑡 𝑒𝑎𝑠𝑦𝑚𝑝𝑡𝑜𝑡𝑒
The Graph of a Rational Function
General Steps to Graph a Rational Function
𝑓 (𝑥 )=
( 𝑥 −2)
( 𝑥+ 3)
7) Use test points between the zeros and vertical asymptotes
to locate the graph above or below the x-axis
𝑓 (− 4)=
(− 4 − 2)
(− 4 +3)
𝑓 (− 4)=
(−)
(−)
=+¿
𝑓 (− 4)=𝑎𝑏𝑜𝑣𝑒
𝑓 ( 0) =
(−)
¿ ¿
𝑓 (0)=𝑏𝑒𝑙𝑜𝑤
𝑓 (3)=¿ ¿
𝑓 (3)=𝑎𝑏𝑜𝑣𝑒
𝑎𝑏𝑜𝑣𝑒 𝑏𝑒𝑙𝑜𝑤 𝑎𝑏𝑜𝑣𝑒
-3 2
The Graph of a Rational Function
General Steps to Graph a Rational Function
𝑓 (𝑥 )=
( 𝑥 −2)
( 𝑥+ 3)
𝑥 → −3−
8) Analyze the behavior of the graph on each side of an
asymptote
𝑓 (𝑥)→
(−)
(0
−
)
𝑓 (𝑥)→∞
𝑥→−3
+¿¿
𝑓 (𝑥)→
(−)
¿¿
𝑓 (𝑥)→−∞
-3 2
The Graph of a Rational Function
9) Sketch the graph
The Graph of a Rational Function
Example
1) Factor the numerator and the denominator
2) State the domain and the location of any holes in the graph
3) Simplify the function to lowest terms
𝑓 ( 𝑥 ) =
( 𝑥 + 2)( 𝑥 +1 )
( 𝑥 − 1 )
𝑓 ( 𝑥 ) =
𝑥 2
+3 𝑥 + 2
𝑥 − 1
𝑓 ( 𝑥 ) =
( 𝑥 + 2)( 𝑥 +1 )
𝑥 − 1
Domain:
No holes
The Graph of a Rational Function
General Steps to Graph a Rational Function
4) Find the y-intercept (x = 0) and the x-intercept(s) (y = 0)
y-intercept (x = 0) x-intercept(s) (y = 0)
𝑓 (0)=
(0 +2)(0+1)
(0 − 1)
𝑓 (0)=
2
− 1
=−2
(0 ,−2)
Use numerator factors
𝑥+2=0
𝑥=−2
(−2,0)
𝑥+1=0
𝑥=−1
(−1,0)
The Graph of a Rational Function
General Steps to Graph a Rational Function
5) Identify any existing asymptotes (vertical, horizontal, or
oblique
Horiz. or Oblique Asymptotes Vertical Asymptotes
𝑥−1
O 𝐴: 𝑦=𝑥+4
Use denominator factors
𝑥−1=0
𝑥=1
𝑉𝐴: 𝑥=1
𝑓 (𝑥 )=
𝑥2
+3 𝑥+ 2
𝑥 − 1
𝑓 (𝑥 )=
(𝑥 +2)(𝑥 +1)
(𝑥 −1)
Examine the largest exponents
Oblique: Use long division
2
3
2

 x
x
𝑥
𝑥2
− 𝑥
−+¿
4 𝑥
+2
+4
4 𝑥− 4
−+¿
0
The Graph of a Rational Function
General Steps to Graph a Rational Function
6) Identify any points intersecting a horizontal or oblique
asymptote.
𝑦 =𝑥+ 4 𝑎𝑛𝑑 𝑓 (𝑥 )=
( 𝑥+2)( 𝑥 +1)
𝑥 −1
𝑥 + 4 =
(𝑥 +2 )( 𝑥 +1)
𝑥 − 1
( 𝑥+ 4 )( 𝑥 −1)=( 𝑥+ 2)( 𝑥 +1)
𝑥 2
+ 3 𝑥 − 4 = 𝑥2
+3 𝑥 +2
𝑙𝑜𝑠𝑡 𝑣𝑎𝑟𝑖𝑎𝑏𝑙𝑒
𝑛𝑜𝑝𝑜𝑖𝑛𝑡𝑠𝑜𝑓 𝑖𝑛𝑡𝑒𝑟𝑠𝑒𝑐𝑡𝑖𝑜𝑛𝑜𝑛 h
𝑡 𝑒𝑎𝑠𝑦𝑚𝑝𝑡𝑜𝑡𝑒
The Graph of a Rational Function
General Steps to Graph a Rational Function
𝑓 (𝑥)=
(𝑥+2)(𝑥+1)
(𝑥 −1)
7) Use test points between the zeros and vertical asymptotes
to locate the graph above or below the x-axis
𝑓 (− 4)=
(−)(−)
(−)
=−
𝑓 (−1.5)=¿¿
𝑓 (− 4)=𝑏𝑒𝑙𝑜𝑤 𝑓 (0)=¿¿
𝑓 (0)=𝑏𝑒𝑙𝑜𝑤
𝑓 (3)=¿¿
𝑓 (3)=𝑎𝑏𝑜𝑣𝑒
𝑎𝑏𝑜𝑣𝑒
𝑏𝑒𝑙𝑜𝑤 𝑎𝑏𝑜𝑣𝑒
-2 1
-1
𝑓 (−1.5)=𝑎𝑏𝑜𝑣𝑒
𝑏𝑒𝑙𝑜𝑤
The Graph of a Rational Function
General Steps to Graph a Rational Function
𝑓 (𝑥 )=
(𝑥+2)(𝑥 +1)
(𝑥 −1)
𝑥 → 1−
8) Analyze the behavior of the graph on each side of an
asymptote
𝑓 (𝑥)→¿¿ 𝑓 (𝑥)→−∞
𝑥 → 1
+¿¿
𝑓 (𝑥)→¿¿ 𝑓 (𝑥 ) → ∞
1
The Graph of a Rational Function
9) Sketch the graph
Review: STEPS for GRAPHING
HOLES
___________________________________________
___________________________________________
EX _________________________________________
Discontinuous part of the graph where the line jumps over.
Represented by a little open circle.
)
5
x
)(
3
x
(
)
3
x
(
y




)
2
x
(
x
)
2
x
(
x
y 2



Hole @ x = 3
Hole @ x = 2
No hole at x = 0
VERTICAL ASYMPTOTES
___________________________________________
___________________________________________
EX _________________________________________
Discontinuous part of the graph where the line cannot cross over.
Represented by a dotted line called an asymptote.
)
2
x
(
)
5
x
(
y



)
5
x
)(
2
x
(
x
x
y



VA @ x = 2
Hole @ x =0
VA @ x = 2, -5
Review: STEPS for GRAPHING
HORIZONTAL ASYMPTOTES
n = degree of numerator
d = degree of denominator
_______________________________________________
_______________________________________________
_______________________________________________
Case 1 n > d
)
2
x
(
7
x
5
y
2


 No HA
Case 2 n < d
1
x
3
x
y 3


 HA @ y = 0
Case 1 n = d
)
2
x
)(
2
x
(
5
1
x
4
y
2



 HA is the ratio of coefficients
HA @ y = 4 / 5
Review: STEPS for GRAPHING
Finding holes and asymptotes
VA: x=-1, -5
HA: y=0 (power of the denominator
is greater than the numerator)
Holes: none
VA: none (graph is the same as
y=x-1 once the (x-2)s cancel
HA: none (degree of the numerator
is greater than the denominator)
Hole: x=2
Let’s try some
VA: x=3
HA: none (power of the numerator is
greater than the denominator)
Holes: x=2
VA: x=-5,0 ( cancel the (x-3)s
HA: y=0 (degree of the denominator
is greater than the numerator)
Hole: x=3
Find the vertical, horizontal asymptotes and any holes
GRAPHING
y = x / (x – 3)
1) HOLES?
no holes since nothing cancels
2) VERTICAL ASYMPTOTES?
Yes ! VA @ x =3
4) T-CHART
X Y = x/(x – 3)
4 Y = 4
2 Y = -2
3) HORIZONTAL ASYMPTOTES?
Yes ! HA @ y =1
0
5
Y = 0
Y = 5/2
GRAPHING
1) HOLES?
2) VERTICAL ASYMPTOTES?
3) HORIZONTAL ASYMPTOTES?
4) The graph -
What cancels?
Graph the function
y=x with a hole
at x=-1
hole @ x = -1
None!
None!
GRAPHING
1) HOLES?
2) VERTICAL ASYMPTOTES?
4) T-CHART
X
6 Y = 1/2
-3 Y = -5/8
3) HORIZONTAL ASYMPTOTES?
1
2
Y = 1/12
Y = 0
)
5
x
)(
2
x
(
x
)
2
x
(
x
y




)
5
x
)(
2
x
(
)
2
x
(
y




)
5
x
)(
2
x
(
)
2
x
(
y




3 Y = -1 / 10
WAIT –
What about
the
Horizontal
Asymptote
here?
hole @ x = 0
Yes ! VA @ x =-2 , 5
Yes ! HA @ y =0 (Power of the denominator
is greater than the numerator)
Remember,
Horizontal
Asymptotes only
describe the ends of
the function (left and
right). What happens
in the middle is ‘fair
game’.
T-CHART
X
-1 Y = 1/2
4 Y = -1/3
2 Y = 0
)
5
x
)(
2
x
(
)
2
x
(
y




To find out what the graph looks like between the
vertical asymptotes, go to a T Chart and plug in
values close to the asymptotes.
Left
Right
Middle
Let’s try one:
Sketch the Graph
1) HOLES?
2) VERTICAL ASYMPTOTES?
4) T-CHART
X
0 Y = 0
-1 Y = 1/4
3) HORIZONTAL ASYMPTOTES?
-2
2
Y = .22
Y=-2
3 Y = -3/4
none
Yes ! VA @ x = 1
Yes ! HA @ y =0 (Power of the denominator
is greater than the numerator)
Problems
Find the vertical asymptotes, horizontal asymptotes, slant
asymptotes and holes for each of the following functions.
 
2
2
2 15
7 10
x x
f x
x x
 

 
Vertical: x = -2
Horizontal : y = 1
Slant: none
Hole: at x = - 5
 
2
2 5 7
3
x x
g x
x
 


Vertical: x = 3
Horizontal : none
Slant: y = 2x +11
Hole: none
MANUEL S. ENVERGA UNIVERSITY FOUNDATION
An Autonomous University
BASIC EDUCATION DEPARTMENT
APPLICATION
On a manila paper, paste/draw some small pictures of objects such that
they are positioned at different coordinates.
Then, draw circles that contain these pictures.
Using the pictures and the circles drawn on the grid, formulate problems
involving the equation of the circle and then solve them.
MANUEL S. ENVERGA UNIVERSITY FOUNDATION
An Autonomous University
BASIC EDUCATION DEPARTMENT
CLOSURE
“The ability to simplify means to eliminate
the unnecessary so that the necessary may
speak.”
Hans Hofmann – early 20th century teacher and painter
MANUEL S. ENVERGA UNIVERSITY FOUNDATION
An Autonomous University
BASIC EDUCATION DEPARTMENT

Rational-Functions-GENERAL MATHEMATICS.pptx

  • 1.
    MANUEL S. ENVERGAUNIVERSITY FOUNDATION An Autonomous University BASIC EDUCATION DEPARTMENT Session 2 RATIONAL FUNCTIONS MSEUF, Lucena City April 18, 2017 Facilitator: Mr. WILLIAM M. VERZO
  • 3.
    MANUEL S. ENVERGAUNIVERSITY FOUNDATION An Autonomous University BASIC EDUCATION DEPARTMENT At the end of the session, the teacher-participants are expected to: 1. represents real-life situations using rational functions. 2. distinguishes rational function, rational equation, and rational inequality. 3. solves rational equations and inequalities. 4. represents a rational function through its: (a) table of values, (b) graph, and (c) equation. 5. finds the domain and range of a rational function. 6. determines the: (a) intercepts; (b) zeroes; and asymptotes of rational functions. 7. graphs rational functions. 8. solves problems involving rational functions, equations, and inequalities.
  • 4.
    MANUEL S. ENVERGAUNIVERSITY FOUNDATION An Autonomous University BASIC EDUCATION DEPARTMENT PRIMING ACTIVITY 1. 3x2 -8x+4 2. 11x2 -99 3. 16x3 +128 Factor the following completely: 4. x3 +2x2 -4x-8 5. 2x2 -x-15 6. 10x3 -80 (3x-2)(x-2) 11(x+3)(x-3) 16(x+2)(x2 -2x+4) (x-2)(x+2)2 (2x+5)(x-3) 10(x-2)(x2 +2x+4)
  • 5.
    MANUEL S. ENVERGAUNIVERSITY FOUNDATION An Autonomous University BASIC EDUCATION DEPARTMENT PRIMING ACTIVITY • Solve the following rational equation. x x x x x 2 4 1 4 12 2      : 1 : 4 Solution x Extr x  
  • 6.
    MANUEL S. ENVERGAUNIVERSITY FOUNDATION An Autonomous University BASIC EDUCATION DEPARTMENT PRIMING ACTIVITY 0 8 2 12 2      x x x 0 4 3 2     x x 0 4 3 2    x x 0 ) 1 )( 4 (    x x 1 4    x or x x = -4 Extraneous x = 1
  • 7.
    MANUEL S. ENVERGAUNIVERSITY FOUNDATION An Autonomous University BASIC EDUCATION DEPARTMENT ACTIVITY 1 (Group Work) (15 min) 1. Your task is to complete the table to show that the time it takes to reach the top of wall depends on the climber’s speed. 2. Compare your results and describe their properties. 3. The team leaders of the groups report their conclusions to the whole class. Climbing the Wall
  • 8.
    MANUEL S. ENVERGAUNIVERSITY FOUNDATION An Autonomous University BASIC EDUCATION DEPARTMENT ANALYSIS 1. What did you find difficult about this task? 2. What task did you find most difficult to do? Why? 3. What information can you get from the equation of a rational graph? 4. What have you learned about the key features of the rational function? 5. What are some common errors which students may commit? How can we prevent such error? Feel free to offer a suggestion.
  • 9.
    MANUEL S. ENVERGAUNIVERSITY FOUNDATION An Autonomous University BASIC EDUCATION DEPARTMENT ABSTRACTION LEARNING AREA STANDARD: At the end of the course, the students must know how to solve problems involving rational, exponential and logarithmic functions; to solve business- related problems; and to apply logic to real-life situations. CONTENT STANDARD: The learner demonstrates understanding of key concepts of rational functions.
  • 10.
    MANUEL S. ENVERGAUNIVERSITY FOUNDATION An Autonomous University BASIC EDUCATION DEPARTMENT ABSTRACTION PERFORMANCE STANDARD: The learner is able to accurately formulate and solve real-life problems involving rational functions.
  • 11.
    MANUEL S. ENVERGAUNIVERSITY FOUNDATION An Autonomous University BASIC EDUCATION DEPARTMENT ABSTRACTION LEARNING COMPETENCIES: The learners ... a. represents real-life situations using rational functions. b. distinguishes rational function, rational equation, and rational inequality. c. solves rational equations and inequalities. d. represents a rational function through its: (a) table of values, (b) graph, and (c) equation. e. finds the domain and range of a rational function.
  • 12.
    MANUEL S. ENVERGAUNIVERSITY FOUNDATION An Autonomous University BASIC EDUCATION DEPARTMENT ABSTRACTION LEARNING COMPETENCIES: The learners ... f. determines the: (a) intercepts; (b) zeroes; and asymptotes of rational functions. g. graphs rational functions. h. solves problems involving rational functions, equations, and inequalities.
  • 13.
    MANUEL S. ENVERGAUNIVERSITY FOUNDATION An Autonomous University BASIC EDUCATION DEPARTMENT Many real-world problems can be modeled by rational functions. REPRESENTING REAL LIFE SITUATIONS USING RATIONAL FUNCTIONS
  • 14.
    MANUEL S. ENVERGAUNIVERSITY FOUNDATION An Autonomous University BASIC EDUCATION DEPARTMENT REPRESENTING REAL LIFE SITUATIONS USING RATIONAL FUNCTIONS
  • 15.
    MANUEL S. ENVERGAUNIVERSITY FOUNDATION An Autonomous University BASIC EDUCATION DEPARTMENT RATIONAL FUNCTIONS Rational Expression  It is the quotient of two polynomials.  A rational function is any ratio of two polynomials, where denominator cannot be ZERO! Examples: 2 5 x y x    2 3 2 3 2 5 4 5 7 x x y x x x       Not Rational: 4 2 x y x   2 5 x y x  
  • 16.
    MANUEL S. ENVERGAUNIVERSITY FOUNDATION An Autonomous University BASIC EDUCATION DEPARTMENT RATIONAL FUNCTIONS Asymptotes  Asymptotes are the boundary lines that a rational function approaches, but never crosses.  We draw these as Dashed Lines on our graphs.  There are three types of asymptotes: Vertical Horizontal (Graph can cross these) Slant
  • 17.
    MANUEL S. ENVERGAUNIVERSITY FOUNDATION An Autonomous University BASIC EDUCATION DEPARTMENT RATIONAL FUNCTIONS Vertical Asymptotes  Vertical Asymptotes exist where the denominator would be zero.  They are graphed as Vertical Dashed Lines  There can be more than one!  To find them, set the denominator equal to zero and solve for “x”
  • 18.
    MANUEL S. ENVERGAUNIVERSITY FOUNDATION An Autonomous University BASIC EDUCATION DEPARTMENT RATIONAL FUNCTIONS Vertical Asymptotes 1 ) (   x x x f •Set the denominator equal to zero •x – 1 = 0, so x = 1 •This graph has a vertical asymptote at x = 1 • Find the vertical asymptotes for the following function:
  • 19.
    1 2 6 34 5 7 8 9 1 0 4 3 2 7 5 6 8 9 x- axis y- axis 0 1 -2 -6 -3 -4 -5 -7 -8 -9 1 0 -4 -3 -2 -1 -7 -5 -6 -8 -9 0 -1 Vertical Asymptote at X = 1
  • 20.
    Other Examples: • Findthe vertical asymptotes for the following functions: 3 3 ) (   x x g ) 5 )( 2 ( 1 ) (     x x x x g 3 :  x VA 5 : 2 :    x VA x VA
  • 21.
    Horizontal Asymptotes • HorizontalAsymptotes are also Dashed Lines drawn horizontally to represent another boundary. • To find the horizontal asymptote you compare the degree of the numerator with the degree of the denominator
  • 22.
    Horizontal Asymptote (HA) GivenRational Function: Compare DEGREE of Numerator to Denominator If N < D , then y = 0 is the HA If N > D, then the graph has NO HA If N = D, then the HA is Numerator ( ) Denominator f x  N D LC y LC 
  • 23.
    Example #1 • Findthe horizontal asymptote for the following function: 1 ) (   x x x f •Since the degree of numerator is equal to degree of denominator (m = n) •Then HA: y = 1/1 = 1 •This graph has a horizontal asymptote at y = 1
  • 24.
    1 2 6 34 5 7 8 9 1 0 4 3 2 7 5 6 8 9 x- axis y- axis 0 1 -2 -6 -3 -4 -5 -7 -8 -9 1 0 -4 -3 -2 -1 -7 -5 -6 -8 -9 0 -1 Horizontal Asymptote at y = 1
  • 25.
    Other Examples: • Findthe horizontal asymptote for the following functions: 3 3 ) (   x x g 1 3 1 3 ) ( 2 2     x x x x g 5 1 ) ( 3    x x x g 0 :  y HA 3 :  y HA None HA :
  • 26.
    Slant Asymptotes (SA) •Slant asymptotes exist when the degree of the numerator is one larger than the denominator. • Cannot have both a HA and SA • To find the SA, divide the Numerator by the Denominator. • The results is a line y = mx + b that is the SA.
  • 27.
    Example of SA 27 2 24 8 ( ) 2 x x f x x     2 4 8   -2 2 4  8  16 8 2 8 y x   Remainder does not matter
  • 28.
    28 Holes • A holeexists when the same factor exists in both the numerator and denominator of the rational expression and the factor is eliminated when you reduce!
  • 29.
    Example of HoleDiscontinuity 29 ( 4)( 1) ( ) ( 2)( 4) x x f x x x      Cancel LIKE factors ( 1) ( ) ( 2) x f x x      ____, ____ 4  ( 4 1) 5 5 ( 4 2) 6 6         5 6
  • 30.
    3.5 - 30 Domain:(–, 0)  (0, ) Range: (–, 0)  (0, ) Find domain and graph. x y –2 –½ –1 –1 –½ –2 0 undefined ½ 2 1 1 2 ½ x x f 1 ) (   It is discontinuous at x = 0.
  • 31.
    3.5 - 31 Domain:(–, 0)  (0, ) Range: (–, 0)  (0, ) Find domain and graph. x y –2 –½ –1 –1 –½ –2 0 undefined ½ 2 1 1 2 ½  decreases on the intervals (–,0) and (0, ). 1 ( ) x x  f x x f 1 ) ( 
  • 32.
    3.5 - 32 Domain:(–, 0)  (0, ) Range: (–, 0)  (0, ) Find domain and graph. x y –2 –½ –1 –1 –½ –2 0 undefined ½ 2 1 1 2 ½ x x f 1 ) (   The y-axis is a vertical asymptote, and the x-axis is a horizontal asymptote.
  • 33.
    3.5 - 33 Domain:(–, 0)  (0, ) Range: (–, 0)  (0, ) Find domain and graph. x y –2 –½ –1 –1 –½ –2 0 undefined ½ 2 1 1 2 ½ x x f 1 ) (   It is an odd function and its graph is symmetric with respect to the origin.
  • 34.
    3.5 - 34 Domain:(–, 0)  (0, ) Range: (0, ) Find domain and graph. x y  3  2 ¼  1 1  ½ 4  ¼ 16 0 undefined  increases on the interval (–,0) and decreases on the interval (0, ). 2 1 ( ) x x  f 1 9 2 1 ( ) x x  f
  • 35.
    3.5 - 35 Domain:(–, 0)  (0, ) Range: (0, ) Find domain and graph. x y  3  2 ¼  1 1  ½ 4  ¼ 16 0 undefined It is discontinuous at x = 0. 1 9 2 1 ( ) x x  f
  • 36.
    3.5 - 36 Domain:(–, 0)  (0, ) Range: (0, ) Find domain and graph. x y  3  2 ¼  1 1  ½ 4  ¼ 16 0 undefined  The y-axis is a vertical asymptote, and the x-axis is a horizontal asymptote. 1 9 2 1 ( ) x x  f
  • 37.
    3.5 - 37 Domain:(–, 0)  (0, ) Range: (0, ) Find domain and graph. x y  3  2 ¼  1 1  ½ 4  ¼ 16 0 undefined  It is an even function, and Its graph is symmetric with respect to the y-axis. 1 9 2 1 ( ) x x  f
  • 38.
    MANUEL S. ENVERGAUNIVERSITY FOUNDATION An Autonomous University BASIC EDUCATION DEPARTMENT RATIONAL EQUATIONS
  • 39.
    MANUEL S. ENVERGAUNIVERSITY FOUNDATION An Autonomous University BASIC EDUCATION DEPARTMENT RATIONAL INEQUALITIES
  • 40.
    MANUEL S. ENVERGAUNIVERSITY FOUNDATION An Autonomous University BASIC EDUCATION DEPARTMENT RATIONAL FUNCTIONS Lesson 4: Representations of Rational Functions Lesson 4:
  • 41.
    MANUEL S. ENVERGAUNIVERSITY FOUNDATION An Autonomous University BASIC EDUCATION DEPARTMENT GRAPHING RATIONAL FUNCTIONS General Steps to Graph a Rational Function 1) Factor the numerator and the denominator 2) State the domain and the location of any holes in the graph 3) Simplify the function to lowest terms 4) Find the y-intercept (x = 0) and the x-intercept(s) (y = 0) 5) Identify any existing asymptotes (vertical, horizontal, or oblique
  • 42.
    MANUEL S. ENVERGAUNIVERSITY FOUNDATION An Autonomous University BASIC EDUCATION DEPARTMENT GRAPHING RATIONAL FUNCTIONS General Steps to Graph a Rational Function 6) Identify any points intersecting a horizontal or oblique asymptote. 7) Use test points between the zeros and vertical asymptotes to locate the graph above or below the x-axis 8) Analyze the behavior of the graph on each side of an asymptote 9) Sketch the graph
  • 43.
    The Graph ofa Rational Function General Steps to Graph a Rational Function 4) Find the y-intercept (x = 0) and the x-intercept(s) (y = 0) y-intercept (x = 0) x-intercept(s) (y = 0) 𝑓 (0)= (0+4)(0− 3) (0+2)(0−2) 𝑓 (0)= − 12 − 4 =3 (0 ,3) Use numerator factors 𝑥+4=0 𝑥−3=0 𝑥=−4 𝑥=3 (−4 ,0) (3 ,0)
  • 44.
    The Graph ofa Rational Function General Steps to Graph a Rational Function 5) Identify any existing asymptotes (vertical, horizontal, or oblique Horiz. Or Oblique Asymptotes Vertical Asymptotes 𝑦 = 1 1 𝐻𝐴: 𝑦=1 Use denominator factors 𝑥+2=0 𝑥−2=0 𝑥=−2 𝑥=2 𝑉𝐴:𝑥=−2𝑎𝑛𝑑 𝑥=2 𝑓 (𝑥 )= 𝑥2 + 𝑥 −12 𝑥 2 − 4 𝑓 ( 𝑥)= (𝑥 +4 )( 𝑥 −3) (𝑥+ 2)(𝑥 −2) Examine the largest exponents Same Horiz. - use coefficients
  • 45.
    The Graph ofa Rational Function
  • 46.
    The Graph ofa Rational Function General Steps to Graph a Rational Function 6) Identify any points intersecting a horizontal or oblique asymptote. 𝑦 =1 𝑎𝑛𝑑 𝑓 ( 𝑥) = 𝑥2 + 𝑥 − 12 𝑥 2 − 4 1= 𝑥 2 + 𝑥 − 12 𝑥 2 − 4 𝑥 2 − 4 = 𝑥 2 + 𝑥 − 12 − 4 = 𝑥 − 12 8 = 𝑥 ( 8,1 )
  • 47.
    The Graph ofa Rational Function General Steps to Graph a Rational Function 𝑓 (𝑥)= (𝑥+4)(𝑥 −3) (𝑥+2)(𝑥− 2) 7) Use test points between the zeros and vertical asymptotes to locate the graph above or below the x-axis -4 -2 2 3 𝑓 (−5)= (−5+4)(−5− 3) (−5+2)(−5−2) 𝑓 (−5)= (−)(−) (−)(−) =+¿ 𝑓 (−5)=𝑎𝑏𝑜𝑣𝑒 𝑓 (−3 )=¿¿ 𝑓 (−3 )=𝑏𝑒𝑙𝑜𝑤 𝑓 (0)=¿ ¿ 𝑓 (0)=𝑎𝑏𝑜𝑣𝑒 𝑎𝑏𝑜𝑣𝑒 𝑏𝑒𝑙𝑜𝑤 𝑎𝑏𝑜𝑣𝑒
  • 48.
    The Graph ofa Rational Function General Steps to Graph a Rational Function 𝑓 (𝑥)= (𝑥+4)(𝑥 −3) (𝑥+2)(𝑥− 2) 7) Use test points between the zeros and vertical asymptotes to locate the graph above or below the x-axis -4 -2 2 3 𝑓 (2.5)=¿¿ 𝑓 (2.5)=𝑏𝑒𝑙𝑜𝑤 𝑓 (4 )=¿ ¿ 𝑓 (4 )=𝑎𝑏𝑜𝑣𝑒 𝑎𝑏𝑜𝑣𝑒 𝑏𝑒𝑙𝑜𝑤 𝑎𝑏𝑜𝑣𝑒 𝑏𝑒𝑙𝑜𝑤 𝑎𝑏𝑜𝑣𝑒
  • 49.
    The Graph ofa Rational Function General Steps to Graph a Rational Function 𝑓 (𝑥)= (𝑥+4)(𝑥 −3) (𝑥+2)(𝑥− 2) 𝑥 → −2− 𝑎𝑏𝑜𝑣𝑒 -4 -2 2 3 𝑎𝑏𝑜𝑣𝑒 𝑏𝑒𝑙𝑜𝑤 𝑎𝑏𝑜𝑣𝑒 𝑏𝑒𝑙𝑜𝑤 8) Analyze the behavior of the graph on each side of an asymptote 𝑓 (𝑥)→¿¿ 𝑓 (𝑥)→−∞ 𝑥→−2 +¿ ¿ 𝑓 (𝑥)→¿¿ 𝑓 (𝑥)→∞
  • 50.
    The Graph ofa Rational Function General Steps to Graph a Rational Function 𝑓 (𝑥)= (𝑥+4)(𝑥 −3) (𝑥+2)(𝑥− 2) 𝑥 → 2− 8) Analyze the behavior of the graph on each side of an asymptote 𝑓 (𝑥)→¿¿ 𝑓 (𝑥)→∞ 𝑥→2 +¿ ¿ 𝑓 (𝑥)→¿¿ 𝑓 (𝑥)→−∞ 𝑎𝑏𝑜𝑣𝑒 -4 -2 2 3 𝑎𝑏𝑜𝑣𝑒 𝑏𝑒𝑙𝑜𝑤 𝑎𝑏𝑜𝑣𝑒 𝑏𝑒𝑙𝑜𝑤
  • 51.
    The Graph ofa Rational Function 9) Sketch the graph
  • 52.
    The Graph ofa Rational Function Example 1) Factor the numerator and the denominator 2) State the domain and the location of any holes in the graph 3) Simplify the function to lowest terms 𝑓 ( 𝑥 ) = ( 𝑥 − 2 ) ( 𝑥 + 3 ) 𝑓 ( 𝑥 ) = 𝑥 2 +3 𝑥 − 10 𝑥 2 +8 𝑥 +15 𝑓 ( 𝑥 ) = ( 𝑥 +5 ) (𝑥 − 2 ) ( 𝑥 + 5 )( 𝑥 + 3 ) Domain: Hole in the graph at
  • 53.
    The Graph ofa Rational Function General Steps to Graph a Rational Function 4) Find the y-intercept (x = 0) and the x-intercept(s) (y = 0) y-intercept (x = 0) x-intercept(s) (y = 0) 𝑓 (0)= (0 − 2) (0+3) 𝑓 (0)=− 2 3 (0 ,− 2 3 ) Use numerator factors 𝑥−2=0 𝑥=2 (2,0)
  • 54.
    The Graph ofa Rational Function General Steps to Graph a Rational Function 5) Identify any existing asymptotes (vertical, horizontal, or oblique Horiz. Or Oblique Asymptotes Vertical Asymptotes 𝑦 = 1 1 𝐻𝐴: 𝑦=1 Use denominator factors 𝑥+3=0 𝑥=−3 𝑉𝐴: 𝑥=−3 𝑓 (𝑥 )= 𝑥2 +3 𝑥 −10 𝑥 2 +8 𝑥 +15 𝑓 (𝑥 )= ( 𝑥 −2) ( 𝑥+ 3) Examine the largest exponents Same Horiz. - use coefficients
  • 55.
    The Graph ofa Rational Function General Steps to Graph a Rational Function 6) Identify any points intersecting a horizontal or oblique asymptote. 𝑦 =1 𝑎𝑛𝑑 𝑓 ( 𝑥 ) = 𝑥 − 2 𝑥 +3 1= 𝑥 − 2 𝑥 + 3 𝑥 + 3 =𝑥 − 2 3 = − 2 𝑙𝑜𝑠𝑡 𝑣𝑎𝑟𝑖𝑎𝑏𝑙𝑒 𝑛𝑜𝑝𝑜𝑖𝑛𝑡𝑠𝑜𝑓 𝑖𝑛𝑡𝑒𝑟𝑠𝑒𝑐𝑡𝑖𝑜𝑛𝑜𝑛 h 𝑡 𝑒𝑎𝑠𝑦𝑚𝑝𝑡𝑜𝑡𝑒
  • 56.
    The Graph ofa Rational Function General Steps to Graph a Rational Function 𝑓 (𝑥 )= ( 𝑥 −2) ( 𝑥+ 3) 7) Use test points between the zeros and vertical asymptotes to locate the graph above or below the x-axis 𝑓 (− 4)= (− 4 − 2) (− 4 +3) 𝑓 (− 4)= (−) (−) =+¿ 𝑓 (− 4)=𝑎𝑏𝑜𝑣𝑒 𝑓 ( 0) = (−) ¿ ¿ 𝑓 (0)=𝑏𝑒𝑙𝑜𝑤 𝑓 (3)=¿ ¿ 𝑓 (3)=𝑎𝑏𝑜𝑣𝑒 𝑎𝑏𝑜𝑣𝑒 𝑏𝑒𝑙𝑜𝑤 𝑎𝑏𝑜𝑣𝑒 -3 2
  • 57.
    The Graph ofa Rational Function General Steps to Graph a Rational Function 𝑓 (𝑥 )= ( 𝑥 −2) ( 𝑥+ 3) 𝑥 → −3− 8) Analyze the behavior of the graph on each side of an asymptote 𝑓 (𝑥)→ (−) (0 − ) 𝑓 (𝑥)→∞ 𝑥→−3 +¿¿ 𝑓 (𝑥)→ (−) ¿¿ 𝑓 (𝑥)→−∞ -3 2
  • 58.
    The Graph ofa Rational Function 9) Sketch the graph
  • 59.
    The Graph ofa Rational Function Example 1) Factor the numerator and the denominator 2) State the domain and the location of any holes in the graph 3) Simplify the function to lowest terms 𝑓 ( 𝑥 ) = ( 𝑥 + 2)( 𝑥 +1 ) ( 𝑥 − 1 ) 𝑓 ( 𝑥 ) = 𝑥 2 +3 𝑥 + 2 𝑥 − 1 𝑓 ( 𝑥 ) = ( 𝑥 + 2)( 𝑥 +1 ) 𝑥 − 1 Domain: No holes
  • 60.
    The Graph ofa Rational Function General Steps to Graph a Rational Function 4) Find the y-intercept (x = 0) and the x-intercept(s) (y = 0) y-intercept (x = 0) x-intercept(s) (y = 0) 𝑓 (0)= (0 +2)(0+1) (0 − 1) 𝑓 (0)= 2 − 1 =−2 (0 ,−2) Use numerator factors 𝑥+2=0 𝑥=−2 (−2,0) 𝑥+1=0 𝑥=−1 (−1,0)
  • 61.
    The Graph ofa Rational Function General Steps to Graph a Rational Function 5) Identify any existing asymptotes (vertical, horizontal, or oblique Horiz. or Oblique Asymptotes Vertical Asymptotes 𝑥−1 O 𝐴: 𝑦=𝑥+4 Use denominator factors 𝑥−1=0 𝑥=1 𝑉𝐴: 𝑥=1 𝑓 (𝑥 )= 𝑥2 +3 𝑥+ 2 𝑥 − 1 𝑓 (𝑥 )= (𝑥 +2)(𝑥 +1) (𝑥 −1) Examine the largest exponents Oblique: Use long division 2 3 2   x x 𝑥 𝑥2 − 𝑥 −+¿ 4 𝑥 +2 +4 4 𝑥− 4 −+¿ 0
  • 62.
    The Graph ofa Rational Function General Steps to Graph a Rational Function 6) Identify any points intersecting a horizontal or oblique asymptote. 𝑦 =𝑥+ 4 𝑎𝑛𝑑 𝑓 (𝑥 )= ( 𝑥+2)( 𝑥 +1) 𝑥 −1 𝑥 + 4 = (𝑥 +2 )( 𝑥 +1) 𝑥 − 1 ( 𝑥+ 4 )( 𝑥 −1)=( 𝑥+ 2)( 𝑥 +1) 𝑥 2 + 3 𝑥 − 4 = 𝑥2 +3 𝑥 +2 𝑙𝑜𝑠𝑡 𝑣𝑎𝑟𝑖𝑎𝑏𝑙𝑒 𝑛𝑜𝑝𝑜𝑖𝑛𝑡𝑠𝑜𝑓 𝑖𝑛𝑡𝑒𝑟𝑠𝑒𝑐𝑡𝑖𝑜𝑛𝑜𝑛 h 𝑡 𝑒𝑎𝑠𝑦𝑚𝑝𝑡𝑜𝑡𝑒
  • 63.
    The Graph ofa Rational Function General Steps to Graph a Rational Function 𝑓 (𝑥)= (𝑥+2)(𝑥+1) (𝑥 −1) 7) Use test points between the zeros and vertical asymptotes to locate the graph above or below the x-axis 𝑓 (− 4)= (−)(−) (−) =− 𝑓 (−1.5)=¿¿ 𝑓 (− 4)=𝑏𝑒𝑙𝑜𝑤 𝑓 (0)=¿¿ 𝑓 (0)=𝑏𝑒𝑙𝑜𝑤 𝑓 (3)=¿¿ 𝑓 (3)=𝑎𝑏𝑜𝑣𝑒 𝑎𝑏𝑜𝑣𝑒 𝑏𝑒𝑙𝑜𝑤 𝑎𝑏𝑜𝑣𝑒 -2 1 -1 𝑓 (−1.5)=𝑎𝑏𝑜𝑣𝑒 𝑏𝑒𝑙𝑜𝑤
  • 64.
    The Graph ofa Rational Function General Steps to Graph a Rational Function 𝑓 (𝑥 )= (𝑥+2)(𝑥 +1) (𝑥 −1) 𝑥 → 1− 8) Analyze the behavior of the graph on each side of an asymptote 𝑓 (𝑥)→¿¿ 𝑓 (𝑥)→−∞ 𝑥 → 1 +¿¿ 𝑓 (𝑥)→¿¿ 𝑓 (𝑥 ) → ∞ 1
  • 65.
    The Graph ofa Rational Function 9) Sketch the graph
  • 66.
    Review: STEPS forGRAPHING HOLES ___________________________________________ ___________________________________________ EX _________________________________________ EX _________________________________________ Discontinuous part of the graph where the line jumps over. Represented by a little open circle. ) 5 x )( 3 x ( ) 3 x ( y     ) 2 x ( x ) 2 x ( x y 2    Hole @ x = 3 Hole @ x = 2 No hole at x = 0
  • 67.
    VERTICAL ASYMPTOTES ___________________________________________ ___________________________________________ EX _________________________________________ EX_________________________________________ Discontinuous part of the graph where the line cannot cross over. Represented by a dotted line called an asymptote. ) 2 x ( ) 5 x ( y    ) 5 x )( 2 x ( x x y    VA @ x = 2 Hole @ x =0 VA @ x = 2, -5 Review: STEPS for GRAPHING
  • 68.
    HORIZONTAL ASYMPTOTES n =degree of numerator d = degree of denominator _______________________________________________ _______________________________________________ _______________________________________________ Case 1 n > d ) 2 x ( 7 x 5 y 2    No HA Case 2 n < d 1 x 3 x y 3    HA @ y = 0 Case 1 n = d ) 2 x )( 2 x ( 5 1 x 4 y 2     HA is the ratio of coefficients HA @ y = 4 / 5 Review: STEPS for GRAPHING
  • 69.
    Finding holes andasymptotes VA: x=-1, -5 HA: y=0 (power of the denominator is greater than the numerator) Holes: none VA: none (graph is the same as y=x-1 once the (x-2)s cancel HA: none (degree of the numerator is greater than the denominator) Hole: x=2
  • 70.
    Let’s try some VA:x=3 HA: none (power of the numerator is greater than the denominator) Holes: x=2 VA: x=-5,0 ( cancel the (x-3)s HA: y=0 (degree of the denominator is greater than the numerator) Hole: x=3 Find the vertical, horizontal asymptotes and any holes
  • 71.
    GRAPHING y = x/ (x – 3) 1) HOLES? no holes since nothing cancels 2) VERTICAL ASYMPTOTES? Yes ! VA @ x =3 4) T-CHART X Y = x/(x – 3) 4 Y = 4 2 Y = -2 3) HORIZONTAL ASYMPTOTES? Yes ! HA @ y =1 0 5 Y = 0 Y = 5/2
  • 72.
    GRAPHING 1) HOLES? 2) VERTICALASYMPTOTES? 3) HORIZONTAL ASYMPTOTES? 4) The graph - What cancels? Graph the function y=x with a hole at x=-1 hole @ x = -1 None! None!
  • 73.
    GRAPHING 1) HOLES? 2) VERTICALASYMPTOTES? 4) T-CHART X 6 Y = 1/2 -3 Y = -5/8 3) HORIZONTAL ASYMPTOTES? 1 2 Y = 1/12 Y = 0 ) 5 x )( 2 x ( x ) 2 x ( x y     ) 5 x )( 2 x ( ) 2 x ( y     ) 5 x )( 2 x ( ) 2 x ( y     3 Y = -1 / 10 WAIT – What about the Horizontal Asymptote here? hole @ x = 0 Yes ! VA @ x =-2 , 5 Yes ! HA @ y =0 (Power of the denominator is greater than the numerator)
  • 74.
    Remember, Horizontal Asymptotes only describe theends of the function (left and right). What happens in the middle is ‘fair game’. T-CHART X -1 Y = 1/2 4 Y = -1/3 2 Y = 0 ) 5 x )( 2 x ( ) 2 x ( y     To find out what the graph looks like between the vertical asymptotes, go to a T Chart and plug in values close to the asymptotes. Left Right Middle
  • 75.
    Let’s try one: Sketchthe Graph 1) HOLES? 2) VERTICAL ASYMPTOTES? 4) T-CHART X 0 Y = 0 -1 Y = 1/4 3) HORIZONTAL ASYMPTOTES? -2 2 Y = .22 Y=-2 3 Y = -3/4 none Yes ! VA @ x = 1 Yes ! HA @ y =0 (Power of the denominator is greater than the numerator)
  • 76.
    Problems Find the verticalasymptotes, horizontal asymptotes, slant asymptotes and holes for each of the following functions.   2 2 2 15 7 10 x x f x x x      Vertical: x = -2 Horizontal : y = 1 Slant: none Hole: at x = - 5   2 2 5 7 3 x x g x x     Vertical: x = 3 Horizontal : none Slant: y = 2x +11 Hole: none
  • 77.
    MANUEL S. ENVERGAUNIVERSITY FOUNDATION An Autonomous University BASIC EDUCATION DEPARTMENT APPLICATION On a manila paper, paste/draw some small pictures of objects such that they are positioned at different coordinates. Then, draw circles that contain these pictures. Using the pictures and the circles drawn on the grid, formulate problems involving the equation of the circle and then solve them.
  • 78.
    MANUEL S. ENVERGAUNIVERSITY FOUNDATION An Autonomous University BASIC EDUCATION DEPARTMENT CLOSURE “The ability to simplify means to eliminate the unnecessary so that the necessary may speak.” Hans Hofmann – early 20th century teacher and painter
  • 79.
    MANUEL S. ENVERGAUNIVERSITY FOUNDATION An Autonomous University BASIC EDUCATION DEPARTMENT