
More Related Content
What's hot
What's hot (20)
Viewers also liked
Viewers also liked (19)
Similar to Aaj ka trend 15.11.16
Similar to Aaj ka trend 15.11.16 (20)
Recently uploaded
Recently uploaded (20)
Aaj ka trend 15.11.16
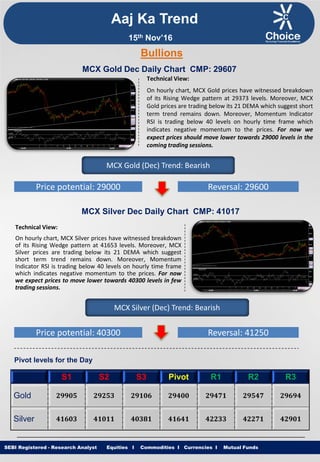
- 1. Equities I Commodities I Currencies I Mutual Funds Aaj Ka Trend Technical View: On hourly chart, MCX Gold prices have witnessed breakdown of its Rising Wedge pattern at 29373 levels. Moreover, MCX Gold prices are trading below its 21 DEMA which suggest short term trend remains down. Moreover, Momentum Indicator RSI is trading below 40 levels on hourly time frame which indicates negative momentum to the prices. For now we expect prices should move lower towards 29000 levels in the coming trading sessions. SEBI Registered - Research Analyst Equities I Commodities I Currencies I Mutual Funds Bullions MCX Gold Dec Daily Chart CMP: 29607 MCX Gold (Dec) Trend: Bearish Price potential: 29000 Reversal: 29600 MCX Silver Dec Daily Chart CMP: 41017 Technical View: On hourly chart, MCX Silver prices have witnessed breakdown of its Rising Wedge pattern at 41653 levels. Moreover, MCX Silver prices are trading below its 21 DEMA which suggest short term trend remains down. Moreover, Momentum Indicator RSI is trading below 40 levels on hourly time frame which indicates negative momentum to the prices. For now we expect prices to move lower towards 40300 levels in few trading sessions. MCX Silver (Dec) Trend: Bearish Price potential: 40300 Reversal: 41250 Pivot levels for the Day S1 S2 S3 Pivot R1 R2 R3 Gold 29905 29253 29106 29400 29471 29547 29694 Silver 41603 41011 40381 41641 42233 42271 42901 15th Nov’16
- 2. Equities I Commodities I Currencies I Mutual Funds Technical View: On daily chart, MCX Copper price has given breakout of its ascending triangle pattern at 337.10 levels on daily chart. Moreover, prices have breached its horizontal trend line resistance on daily chart. Furthermore, MCX Copper is trading above its 100 DEMA on daily time frame. Moreover, momentum indicator MACD has shown positive crossover on daily chart which is bullish sign. For now we expect prices to move higher towards 386 levels in coming trading sessions. SEBI Registered - Research Analyst Equities I Commodities I Currencies I Mutual Funds MCX Copper Nov Daily Chart CMP: 378.30 MCX Copper (Nov) Trend: Bullish Price potential: 386 Reversal: 370 MCX Crude Oil Nov. Daily Chart CMP: 2911 Technical View: MCX Crude oil price has shown breakdown of its Consolidation pattern at 2902 levels on hourly chart. MCX Crude Oil is trading in a Lower Low pattern on hourly chart. In addition, Counter has witnessed breakdown of its Rising Channel pattern in NYMEX at $44.35 levels on daily chart. Moreover, Momentum indicator MACD is trading below its signal line on daily chart which suggest the negative movement in the prices. For now we expect prices to move lower 2815 towards levels in coming trading sessions. MCX Crude Oil (Nov) Trend: Bearish Price potential: 2815 Reversal: 2940 Pivot levels for the Day S1 S2 S3 Pivot R1 R2 R3 Copper 373.1 371.6 364.9 378.2 379.8 384.9 391.5 Crude 2922 2891 2854 2928 2959 2965 3002 Base Metal Energy Aaj Ka Trend 15th Nov’16
- 3. Equities I Commodities I Currencies I Mutual FundsSEBI Registered - Research Analyst Equities I Commodities I Currencies I Mutual Funds Other Base Metals & Energy S1 S2 S3 Pivot R1 R2 R3 Trend Copper 373.1 371.6 364.9 378.2 379.8 384.9 391.5 Aluminum 117.1 116.7 115.4 118.0 118.4 119.3 120.6 Lead 142.9 142.3 139.3 145.3 145.9 148.3 151.3 Nickel 751.5 745.2 732.5 757.9 764.2 770.6 783.3 Zinc 166.5 165.7 160.4 170.9 171.7 176.2 181.4 Natural Gas 177.2 175.6 169.0 182.2 183.8 188.8 195.4 Fundamental News: Gold prices gained in Asia on Monday ahead of key regional data sets and as investors continued to see demand potential spurred by expected infrastructure spending plans by president-elect Donald Trump with the Republican part in control of both house of the U.S. Congress. Gold prices fell in Asia on Monday after China data mildly disappointed and investors infrastructure spending plans by president-elect Donald Trump with the Republican part in control of both house of the U.S. Congress. Gold prices fell to a more than five-month low on Monday, extending four straight sessions of losses as market players continued to dump the yellow metal in wake of Donald Trump’s victory in the U.S. presidential election. Crude oil prices reversed course and fell in Asia on Monday as industrial output and retail sales data from China came in a tad weaker than expected. Oil prices sank to a three-month low on Monday, extending two straight sessions of losses amid growing concerns over a global supply glut. Oil fell over 1% Monday as the dollar jumped and as the global supply glut persists. Oil fell to its lowest in three months on Monday, as the prospect of another year of oversupply and weak prices overshadowed chances that OPEC will reach a deal to cut output. Copper prices rallied on Monday, adding to gains after posting its strongest weekly rise since 1980 amid growing optimism surrounding the effects of a Donald Trump presidency on the U.S. economy. Aaj Ka Trend 15th Nov’16
- 4. Equities I Commodities I Currencies I Mutual FundsSEBI Registered - Research Analyst Equities I Commodities I Currencies I Mutual Funds International Market Commodity Closing Price Gold 1226.05 Silver 17.04 Crude Oil 44.17 Brent Crude Oil 45.20 Natural Gas 2.769 COMEX/NYMEX/ICE ( Precious Metals & Energy) Currency & Commodity Index Currency (Spot) Current Price USD / INR 66.62 Dollar Index 99.89 EUR / USD 1.0753 CRB Index* 180.25 Closing as on 14.11.16 *Closing as on 14.11.16 LME (Base Metals) ( $ per tones) Commodity Closing Price Copper 5559 Aluminum 1735 Zinc 2607 Lead 2195 Nickel 11260 SHFE (Base Metals) (Yuan per tones) Commodity Closing Price Copper 45440 Aluminum 14165 Zinc 21895 Lead 18655 Closing as on 14.11.16 Closing as on 14.11.16 LME INVENTORY DATA Aaj Ka Trend 04-Nov-16 07-Nov-16 08-Nov-16 10-Nov-16 14-Nov-16 Aluminium -1876 -5276 -5076 -4125 -6300 Copper -5602 -6602 -6774 -9025 -4100 Lead -224 -226 -74 -325 -150 Nickel 611 -545 -194 192 0 Zinc -1026 -299 -476 -775 -800 15th Nov’16
- 5. Equities I Commodities I Currencies I Mutual Funds This is solely for information of clients of Choice Broking and does not construe to be an investment advice. It is also not intended as an offer or solicitation for the purchase and sale of any financial instruments. Any action taken by you on the basis of the information contained herein is your responsibility alone and Choice Broking its subsidiaries or its employees or associates will not be liable in any manner for the consequences of such action taken by you. We have exercised due diligence in checking the correctness and authenticity of the information contained in this recommendation, but Choice Broking or any of its subsidiaries or associates or employees shall not be in any way responsible for any loss or damage that may arise to any person from any inadvertent error in the information contained in this recommendation or any action taken on basis of this information. Technical analysis studies market psychology, price patterns and volume levels. It is used to forecast future price and market movements. Technical analysis is complementary to fundamental analysis and news sources. The recommendations issued herewith might be contrary to recommendations issued by Choice Broking in the company research undertaken as the recommendations stated in this report is derived purely from technical analysis. Choice Broking has based this document on information obtained from sources it believes to be reliable but which it has not independently verified; Choice Broking makes no guarantee, representation or warranty and accepts no responsibility or liability as to its accuracy or completeness. The opinions contained within the report are based upon publicly available information at the time of publication and are subject to change without notice. The information and any disclosures provided herein are in summary form and have been prepared for informational purposes. The recommendations and suggested price levels are intended purely for trading purposes. The recommendations are valid for the day of the report however trading trends and volumes might vary substantially on an intraday basis and the recommendations may be subject to change. The information and any disclosures provided herein may be considered confidential. Any use, distribution, modification, copying, forwarding or disclosure by any person is strictly prohibited. The information and any disclosures provided herein do not constitute a solicitation or offer to purchase or sell any security or other financial product or instrument. The current performance may be unaudited. Past performance does not guarantee future returns. There can be no assurance that investments will achieve any targeted rates of return, and there is no guarantee against the loss of your entire investment. POTENTIAL CONFLICT OF INTEREST DISCLOSURE (as on date of report) Disclosure of interest statement – • Analyst interest of the stock /Instrument(s): - No. • Firm interest of the stock / Instrument (s): - No. Disclaimer Contact Us Amit Pathania Research Associate amit.pathania@choiceindia.com Rohan Patil Research Associate rohan.patil@choiceindia.com www.choicebroking.incustomercare@choiceindia.com SEBI Registered - Research Analyst Equities I Commodities I Currencies I Mutual Funds Aaj Ka Trend 15th Nov’16 Neeraj Yadav Research Advisor neeraj.yadav@choiceindia.com Anish Vyas Senior Research Associate anish.vyas@choiceindia.com Anish Vyas Digitally signed by Anish Vyas DN: cn=Anish Vyas, o=Choice Merchandise Broking Pvt. Ltd, ou=Sr. Research Associate, email=anish.vyas@choiceindia.com, c=IN Date: 2016.11.15 09:08:36 +05'30'