This document discusses key concepts related to business costs including:
1. It defines economic costs, accounting costs, and sunk costs.
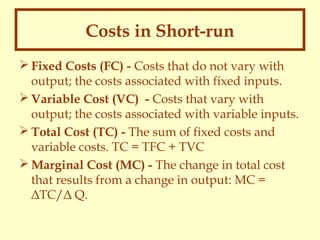
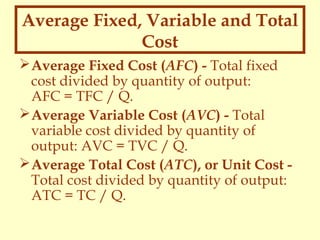
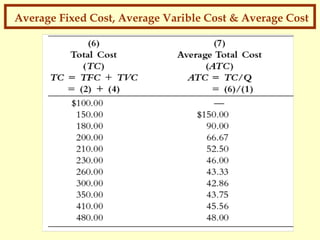
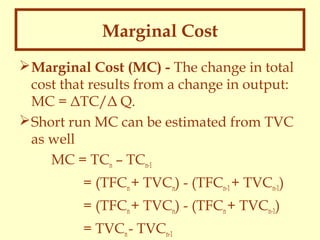
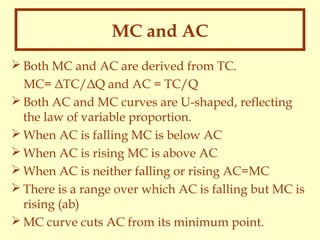
2. It explains the differences between short-run and long-run costs, and how total, average, and marginal costs are calculated in each time period.
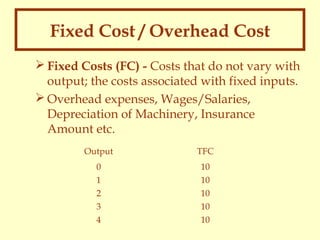
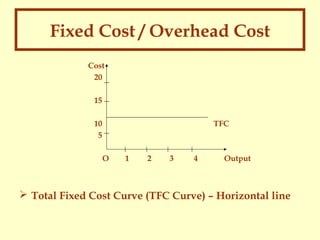
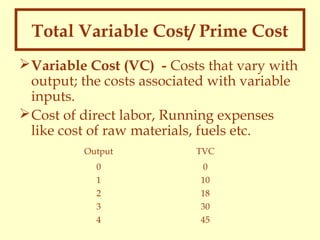
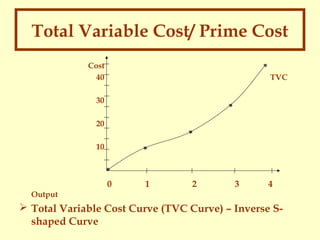
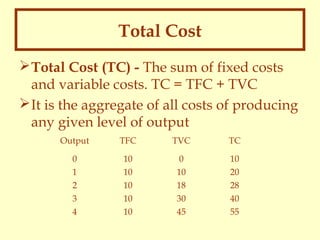
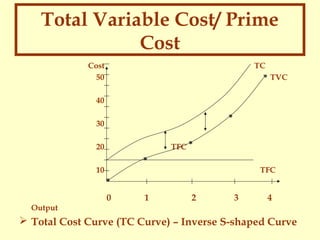
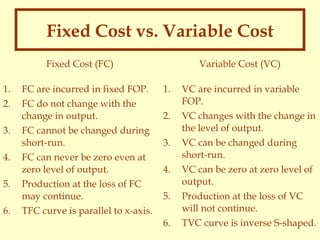
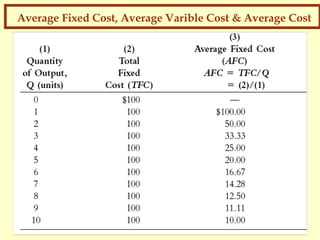
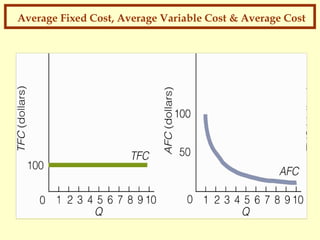
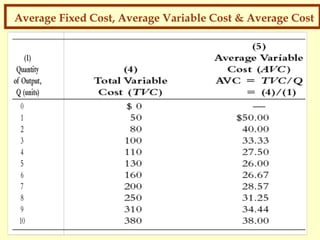
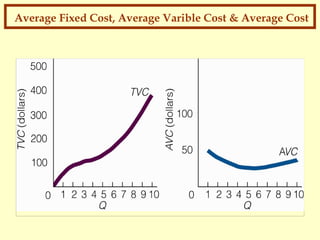
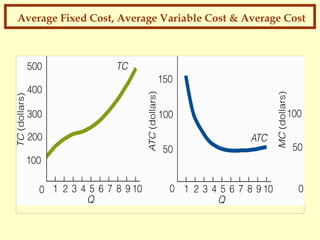
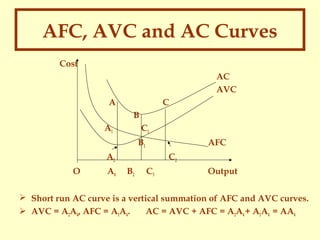
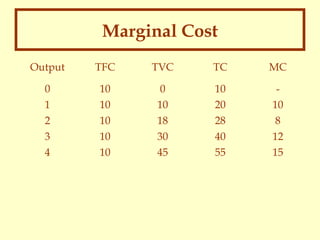
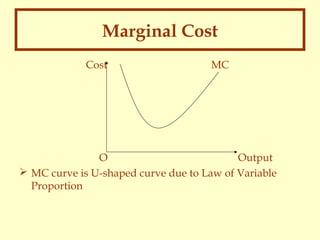
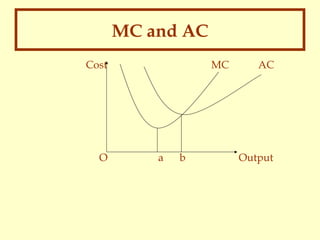
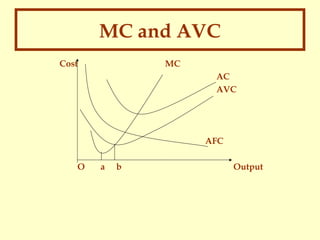
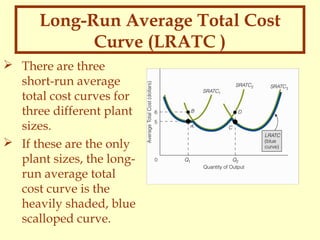
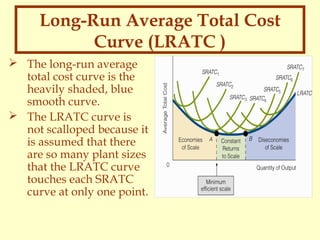
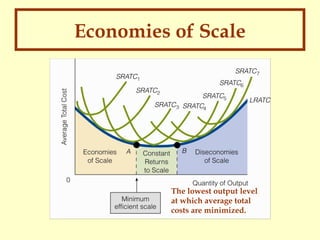
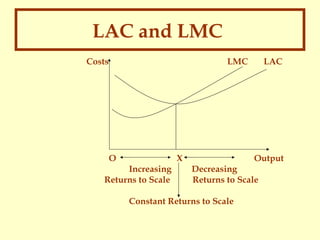
3. It provides examples of cost schedules and diagrams cost curves, discussing their characteristics and relationships.