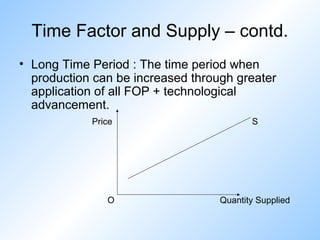
Theory of Supply
Supply refers to the quantity of the
commodity which the producer is
willing to sell at a particular price
during a particular time period.
Supply and Stock
Stock of a commodity is the total quantity
that is available in the market at a certain
time.
Supply is that part of the stock which a
seller is ready to sell at a certain price
during a certain time. Thus, supply is the
part of stock which is actually brought into
the market.
Supply and Quantity Supplied
• Supply – it refers to the whole set of
quantities of a commodity offered for sale
at different levels of prices at a point of
time.
• Quantity Supplied – it refers to a particular
amount of commodity offered for sale at a
particular price at a point of time.
Factors determining Supply & Supply Function

• Sx = f (Px, PZ, NF, T, PF, Ex , GP)
Sx = Supply of commodity X
Px = Price of commodity X
PZ= Price of related goods
NF = Number of Firms
T = Technological changes
PF = Price of factors of production
EX = Expected Future Price
GP = Government Policy
Supply and Prices of Related
Goods
• A fall in the price of a related good say Y, leads
to a rise in the quantity supplied of good X and
vice versa.
Supply and Number of Firms
• Increase in the number of firms in the
market implies increase in supply and vice
versa.
Supply and Technological Change
• Improvement in the technique of
production reduces cost of production.
This leads to increase in profit and hence
an increase in supply.
Supply and Price of Factors of
Production
• If the factor price reduces, cost of
production also reduces and supply
increases and vice versa.
Supply and Expected Future Price
• If the producer expects the price of the
commodity to increase in near future,
current supply of the commodity would
reduce and vice versa.
Supply and Government Policy
• Increase in Taxation tends to reduce the
supply while increase in Subsidy tends to
induce greater supply of the commodity.
Law of Supply
There is a direct relationship between the
price of a commodity and the quantity
supplied of that commodity.
Sx = f (Px), ceteris peribus
where,
Sx = quantity supplied of good X
Px = price of the good X

Price

Quantity
Assumptions of Law of Supply
* Price of related goods is constant
* Number of firms is constant.
* Technology remain unchanged.
* Price of factors of production remains
same.
* There is no change in the goal of the firm.
* Expected future price remains unchanged.
* Government policy is constant
Exceptions to the Law of Supply
• It does not apply strictly to agricultural
products whose supply is governed by
natural factors. Due to natural calamities
the supply of wheat will not increase
however high its price may soar.
• Goods of social distinction will remain
limited even if their price may rise.
• Sellers may be willing to sell more units of
perishable goods although their price may
be falling.
Supply Schedule and Supply Curve
Supply Schedule : It’s a tabular
representation showing the different
quantities of a good that the producers are
willing to sell at different levels of prices
during a given period of time.
Price
($ per Kg)

Quantity
Supplied of Good X

Ref
Pt

1

10

A

2

20

B

3

30

C

4

40

D
Supply Curve
The graphical representation of the
supply schedule is supply curve.
Individual Supply and Market Supply
• Individual Supply :It means quantity supplied of a good by
an individual producer at various prices
per time period.
• Market Supply :It is the aggregate of the quantities
supplied by all producers in the market
at different prices per time period.
Deriving a Market Supply Schedule
Deriving a Market Supply Curve
RECAP - Factors determining Supply & Supply
Function

• Sx = f (Px, PZ, NF, T, PF, Ex , GP)
Sx = Supply of commodity X
Px = Price of commodity X
PZ= Price of related goods
NF = Number of Firms
T = Technological changes
PF = Price of factors of production
EX = Expected Future Price
GP = Government Policy
Supply and Prices of Related Goods
Price

price
S

S1
S1

O

S

O
Quantity supplied

(a) Fall in the price of substitute

Quantity supplied

(b) Rise in the price of substitute
Supply and Technology
Price

price
S1

S
S

O

S1

O
Quantity supplied
with an unfavourable
change in technology

Quantity supplied
with an advancement
in technology
Supply and Price of Factors of Production
Price

price
S1

S
S

O

S1

O
Quantity supplied
with higher cost
of production

Quantity supplied
with lower cost
of production
Supply and Government Policy
Price

price
S1

S
S

O

S1

O
Quantity supplied
with an increase in
excise tax

Quantity supplied
with an increase in
subsidy
Change in Quantity Supplied (movement)
vs. Change in Supply (shift)
• Change in Quantity Supplied / Movement
along the supply curve
It is caused by the change in the price of
good other things remaining constant.
* Expansion of Supply : It refers to rise in
supply due to the fall in price of the good.
* Contraction of Supply : It refers to fall in
supply due to the rise in price of the good.
Contd.
Expansion of Supply
Price

Contraction of Supply
Price
S

S

P1

P

P

P1

O

O
Q

Q1

Quantity Supplied

Q1

Q

Quantity Supplied
Contd.

• Shift / Increase or Decrease in Supply
It is caused by changes in factors other than
price of the good like price of substitute goods;
change in technology; Change in cost of
production; change in government policy etc.
Increase in Supply
It refers to more supply at a given price. It is
indicated by the rightward shift in the supply
curve. It is due to
- decrease in the price of related
goods
- advanced technological change
- increase in the number of firms
- lower price of factors of production
- Expectation of fall in price in near future
- higher subsidies to the firms
Decrease in Supply
It refers to less supply at a given price. It is
indicated by the leftward shift in the supply
curve. It is due to
- increase in the price of related
goods
- Use of obsolete technology
- decrease in the number of firms
- higher price of factors of production
- Expectation of rise in price in near future
- higher taxes to the firms
Increase in Supply
Price
S

P

O

Q1
Q Qx
Quantity Supplied

S1
Decrease in Supply
Price
S1

P

O

Q
Q 1 Qx
Quantity Supplied

S
Time Factor and Supply
• Very Short Time Period/ Market Period : The time
period when production cannot be changed.
Price

O

S

Quantity Supplied
Time Factor and Supply – contd.
• Short Time Period : The time period when
production can be increased through greater
application of variable FOP.
Price

O

S

Quantity Supplied
Time Factor and Supply – contd.
• Long Time Period : The time period when
production can be increased through greater
application of all FOP + technological
advancement.
Price

O

S

Quantity Supplied
Difference in the Causes of Shift in the Supply Curve
Increase in Supply (Upward or
Rightward shift in Supply)

Decrease in Supply (Downward or
Leftward shift in Supply)

1. Improvement in technology of
production.

1. Technique of production being
obsolete.

2. Fall in the price of related goods.

2. Rise in the price of related goods.

3. Fall in price of factors of
production.

3. Rise in price of factors of
production.

4. Fall in excise tax.

4. Rise in excise tax.

5. Higher subsidy.

5. Lower or no subsidy.

6. Increase on number of firms.

6. Decrease on number of firms.

7. Expectation of fall in price in near
future.

7. Expectation of rise in price in near
future.
Difference between Increase in Supply and
Expansion of Supply
Increase in Supply
•It refers to shift in supply curve.
•There is a rightward shift in the supply
curve.
•It is due to:- decrease in the price of related goods
- advanced technological change
- increase in the number of firms
- lower price of factors of production
- Expectation of fall in price in near future
- higher subsidies to the firms

Expansion of Supply
•It refers to movement
along a supply curve.
•The producers move to
the right on the same
supply curve.
•It is due to the rise in the
price of the commodity.
Contd.

Increase in Supply

Expansion of Supply

•It is defined as a rise in supply at
the same price of a commodity.
•Graphical presentation:-

•It is defined as rise in supply due
to rise in price of the commodity.
• Graphical Presentation :-

Price

Price
P1

S

S1

S

P
P
O

Q

Q1
Quantity

•Numerical example:Px
Qx
5
5

90
100

O

Q

Q1
Quantity

•Numerical Example :Px
Qx
5
6

90
100
Difference between Decrease in Supply and
Contraction of Supply
Decrease in Supply
•It refers to shift in supply curve.
•There is a leftward shift in the supply
curve.
•It is due to:- increase in the price of related goods
- Use of obsolete technology
- decrease in the number of firms
- higher price of factors of production
- Expectation of rise in price in near
future
- higher taxes to the firms

Contraction of Supply
•It refers to movement
along a supply curve.
•The producers move to the
left on the same supply
curve.
•It is due to the fall in the
price of the commodity.
Contd.

Decrease in Supply

Contraction of Supply

•It is defined as a fall in supply at
the same price of a commodity.
•Graphical presentation:-

•It is defined as fall in supply due
to fall in price of the commodity.
• Graphical Presentation :-

Price

Price
P

S1

S

S

P
P1

O

Q1

O

Q

Q1

Quantity

Quantity

•Numerical example:Px
Qx
5
5

90
80

Q

•Numerical Example :Px
Qx
5
3

90
80

4 supply theory

  • 2.
    Theory of Supply Supplyrefers to the quantity of the commodity which the producer is willing to sell at a particular price during a particular time period.
  • 3.
    Supply and Stock Stockof a commodity is the total quantity that is available in the market at a certain time. Supply is that part of the stock which a seller is ready to sell at a certain price during a certain time. Thus, supply is the part of stock which is actually brought into the market.
  • 4.
    Supply and QuantitySupplied • Supply – it refers to the whole set of quantities of a commodity offered for sale at different levels of prices at a point of time. • Quantity Supplied – it refers to a particular amount of commodity offered for sale at a particular price at a point of time.
  • 5.
    Factors determining Supply& Supply Function • Sx = f (Px, PZ, NF, T, PF, Ex , GP) Sx = Supply of commodity X Px = Price of commodity X PZ= Price of related goods NF = Number of Firms T = Technological changes PF = Price of factors of production EX = Expected Future Price GP = Government Policy
  • 6.
    Supply and Pricesof Related Goods • A fall in the price of a related good say Y, leads to a rise in the quantity supplied of good X and vice versa.
  • 7.
    Supply and Numberof Firms • Increase in the number of firms in the market implies increase in supply and vice versa.
  • 8.
    Supply and TechnologicalChange • Improvement in the technique of production reduces cost of production. This leads to increase in profit and hence an increase in supply.
  • 9.
    Supply and Priceof Factors of Production • If the factor price reduces, cost of production also reduces and supply increases and vice versa.
  • 10.
    Supply and ExpectedFuture Price • If the producer expects the price of the commodity to increase in near future, current supply of the commodity would reduce and vice versa.
  • 11.
    Supply and GovernmentPolicy • Increase in Taxation tends to reduce the supply while increase in Subsidy tends to induce greater supply of the commodity.
  • 12.
    Law of Supply Thereis a direct relationship between the price of a commodity and the quantity supplied of that commodity. Sx = f (Px), ceteris peribus where, Sx = quantity supplied of good X Px = price of the good X Price Quantity
  • 13.
    Assumptions of Lawof Supply * Price of related goods is constant * Number of firms is constant. * Technology remain unchanged. * Price of factors of production remains same. * There is no change in the goal of the firm. * Expected future price remains unchanged. * Government policy is constant
  • 14.
    Exceptions to theLaw of Supply • It does not apply strictly to agricultural products whose supply is governed by natural factors. Due to natural calamities the supply of wheat will not increase however high its price may soar. • Goods of social distinction will remain limited even if their price may rise. • Sellers may be willing to sell more units of perishable goods although their price may be falling.
  • 15.
    Supply Schedule andSupply Curve Supply Schedule : It’s a tabular representation showing the different quantities of a good that the producers are willing to sell at different levels of prices during a given period of time. Price ($ per Kg) Quantity Supplied of Good X Ref Pt 1 10 A 2 20 B 3 30 C 4 40 D
  • 16.
    Supply Curve The graphicalrepresentation of the supply schedule is supply curve.
  • 17.
    Individual Supply andMarket Supply • Individual Supply :It means quantity supplied of a good by an individual producer at various prices per time period. • Market Supply :It is the aggregate of the quantities supplied by all producers in the market at different prices per time period.
  • 18.
    Deriving a MarketSupply Schedule
  • 19.
    Deriving a MarketSupply Curve
  • 21.
    RECAP - Factorsdetermining Supply & Supply Function • Sx = f (Px, PZ, NF, T, PF, Ex , GP) Sx = Supply of commodity X Px = Price of commodity X PZ= Price of related goods NF = Number of Firms T = Technological changes PF = Price of factors of production EX = Expected Future Price GP = Government Policy
  • 22.
    Supply and Pricesof Related Goods Price price S S1 S1 O S O Quantity supplied (a) Fall in the price of substitute Quantity supplied (b) Rise in the price of substitute
  • 23.
    Supply and Technology Price price S1 S S O S1 O Quantitysupplied with an unfavourable change in technology Quantity supplied with an advancement in technology
  • 24.
    Supply and Priceof Factors of Production Price price S1 S S O S1 O Quantity supplied with higher cost of production Quantity supplied with lower cost of production
  • 25.
    Supply and GovernmentPolicy Price price S1 S S O S1 O Quantity supplied with an increase in excise tax Quantity supplied with an increase in subsidy
  • 26.
    Change in QuantitySupplied (movement) vs. Change in Supply (shift) • Change in Quantity Supplied / Movement along the supply curve It is caused by the change in the price of good other things remaining constant. * Expansion of Supply : It refers to rise in supply due to the fall in price of the good. * Contraction of Supply : It refers to fall in supply due to the rise in price of the good.
  • 27.
    Contd. Expansion of Supply Price Contractionof Supply Price S S P1 P P P1 O O Q Q1 Quantity Supplied Q1 Q Quantity Supplied
  • 28.
    Contd. • Shift /Increase or Decrease in Supply It is caused by changes in factors other than price of the good like price of substitute goods; change in technology; Change in cost of production; change in government policy etc.
  • 29.
    Increase in Supply Itrefers to more supply at a given price. It is indicated by the rightward shift in the supply curve. It is due to - decrease in the price of related goods - advanced technological change - increase in the number of firms - lower price of factors of production - Expectation of fall in price in near future - higher subsidies to the firms
  • 30.
    Decrease in Supply Itrefers to less supply at a given price. It is indicated by the leftward shift in the supply curve. It is due to - increase in the price of related goods - Use of obsolete technology - decrease in the number of firms - higher price of factors of production - Expectation of rise in price in near future - higher taxes to the firms
  • 31.
    Increase in Supply Price S P O Q1 QQx Quantity Supplied S1
  • 32.
    Decrease in Supply Price S1 P O Q Q1 Qx Quantity Supplied S
  • 33.
    Time Factor andSupply • Very Short Time Period/ Market Period : The time period when production cannot be changed. Price O S Quantity Supplied
  • 34.
    Time Factor andSupply – contd. • Short Time Period : The time period when production can be increased through greater application of variable FOP. Price O S Quantity Supplied
  • 35.
    Time Factor andSupply – contd. • Long Time Period : The time period when production can be increased through greater application of all FOP + technological advancement. Price O S Quantity Supplied
  • 36.
    Difference in theCauses of Shift in the Supply Curve Increase in Supply (Upward or Rightward shift in Supply) Decrease in Supply (Downward or Leftward shift in Supply) 1. Improvement in technology of production. 1. Technique of production being obsolete. 2. Fall in the price of related goods. 2. Rise in the price of related goods. 3. Fall in price of factors of production. 3. Rise in price of factors of production. 4. Fall in excise tax. 4. Rise in excise tax. 5. Higher subsidy. 5. Lower or no subsidy. 6. Increase on number of firms. 6. Decrease on number of firms. 7. Expectation of fall in price in near future. 7. Expectation of rise in price in near future.
  • 37.
    Difference between Increasein Supply and Expansion of Supply Increase in Supply •It refers to shift in supply curve. •There is a rightward shift in the supply curve. •It is due to:- decrease in the price of related goods - advanced technological change - increase in the number of firms - lower price of factors of production - Expectation of fall in price in near future - higher subsidies to the firms Expansion of Supply •It refers to movement along a supply curve. •The producers move to the right on the same supply curve. •It is due to the rise in the price of the commodity.
  • 38.
    Contd. Increase in Supply Expansionof Supply •It is defined as a rise in supply at the same price of a commodity. •Graphical presentation:- •It is defined as rise in supply due to rise in price of the commodity. • Graphical Presentation :- Price Price P1 S S1 S P P O Q Q1 Quantity •Numerical example:Px Qx 5 5 90 100 O Q Q1 Quantity •Numerical Example :Px Qx 5 6 90 100
  • 39.
    Difference between Decreasein Supply and Contraction of Supply Decrease in Supply •It refers to shift in supply curve. •There is a leftward shift in the supply curve. •It is due to:- increase in the price of related goods - Use of obsolete technology - decrease in the number of firms - higher price of factors of production - Expectation of rise in price in near future - higher taxes to the firms Contraction of Supply •It refers to movement along a supply curve. •The producers move to the left on the same supply curve. •It is due to the fall in the price of the commodity.
  • 40.
    Contd. Decrease in Supply Contractionof Supply •It is defined as a fall in supply at the same price of a commodity. •Graphical presentation:- •It is defined as fall in supply due to fall in price of the commodity. • Graphical Presentation :- Price Price P S1 S S P P1 O Q1 O Q Q1 Quantity Quantity •Numerical example:Px Qx 5 5 90 80 Q •Numerical Example :Px Qx 5 3 90 80