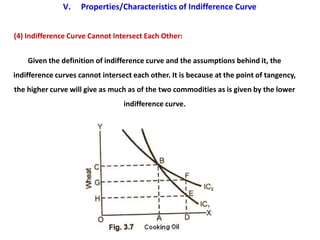
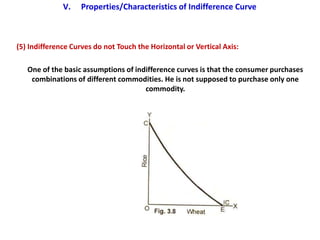
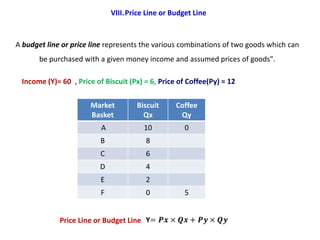
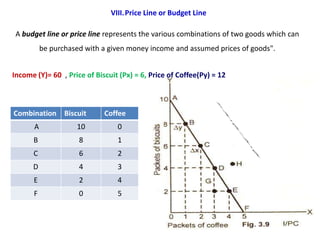
SEMINAR Presentation


Ordinal Utility analysis or Indifference Curve Approach

                 BA Economics Programme

                      Thesmiyath P
                    Muhammed Fasil P.K.
                         Savad P
                       Hafizudeeen


       SAFI Institute of Advanced Study, Vazhayoor
I.    Introduction to Utility analysis

II.   Cardinal Utility approach and Ordinal Utility l approach

III. Ordinal Utility analysis and its assumptions

IV. Meaning of Indifference curve

V.    Indifference Map                                           Contents
VI. ginal Rate of Substitution - MRS xy

VII. Properties of Indifference Curve

VIII. MarPrinciples of Diminishing Marginal Substitution

IX. Budget Line or Price Line

X.    Slop of Price Line

XI. Changes in Budget Line or Price Line

XII. Superiority of IC Analysis and Cardinal Utility Analysis

XIII. Conclusion
I.   Introduction to Utility analysis


   Meaning of Utility - The power of a commodity that satisfy the wants of
    consumer - want satisfying power


       • Introduced by Jermy Bentham
       •   Measurement ‘Utils’
       • Subjective entity
II. Cardinal Utility approach and Ordinal Utility l approach

                                        Utility Analysis


Cardinal Utility analysis                                               Ordinal Utility Analysis


      • Alfred Marshal                                     • J. R. Hicks & R.G.D. Allen
      • can be measured                                    •Cannot be measured but compared
      • ‘Utils’                                               as rank
      • Law of Diminishing Marginal                        • Indifference Curve analysis
         Utility
      •Law of Equi-marginal Utility
      •Mashellian Analysis
III. Meaning of Ordinal Utility analysis
         and its assumptions
III. Meaning of Ordinal Utility analysis and its assumptions


Meaning of Ordinal Utility analysis


       • Ordinal means- Can be compare with each other- 1St , 2nd , 3rd etc.
       • Ordinal Utility analysis - Utility can compare but can not be measure.
       • Popularized by J.R. Hicks and R.G.D. Allen
       • Used the tool named Indifference Curve
       • Known as Indifference curve approach of utility analysis
Assumption of Ordinal Utility Analysis or Indifference Curve approach
III. Assumption of Cardinal Utility Analysis or Indifference Curve approach


1. Consumer is rational or Rationality :
Consumer’s Objective is maximization of utility, subject to Price and consumption
expenditure
2. Utility is ordinal:
Utility cannot be measured cardinally. It can be expressed ordinally can rank
according to the satisfaction or utility of each basket.
3. Consistence in choice :
if the consumer prefers combinations of A of good to the combinations B of goods,
he then remains consistent in his choice.
                          If A > B, then never become B > A
III. Assumption of Cardinal Utility Analysis or Indifference Curve approach


4. Consumer’s Preference is Transitive:
 A is preferred over combination B is preferred over C, then combination A is
preferred over combination A is preferred over C.
                               If A > B and B > C, then A > C
5. Diminishing Marginal Substitution of goods:
 In the Indifference Curve analysis, the principle of Diminishing Marginal Rate of
Substitution is assumed. That is Convexity of Indifference curve or Negative slop
of indifference
6. Dependent Utility:
      TU = f( q1 + q2 + q3 + . . . . . .+ qn)

7. A Large bundle of goods preferred to small bundle
IV. Meaning of Indifference Curve


• The Indifference curve was invented by F Y Edgeworth


An Indifference curve is the locus point of all those combination
of two commodity that yield same level of satisfaction or utility
                              to the consume
IV. Meaning of Indifference Curve


An Indifference curve is the locus point of all those combination of two
   commodity that yield same level of satisfaction or utility to the
                                     consumer

                     Various Combinations:
                                                            Utility
       Combination   Unit of Rice       Unit of Wheat

           a)        16 kg of Rice      2 kg of Wheat       100u

           b)        12 kg of Rice      5 kg of Wheat       100u

           c)        11 kg of Rice      7 kg of Wheat       100u

           d)        10 kg of Rice     10 kg of Wheat       100u

           e)        9 kg of Rice      15 kg of Wheat       100u
IV. Meaning of Indifference Curve


      Various Combinations:


                        Unit of   Utility
         Unit of Rice
                        Wheat


  a          16               2   100u


  b          12               5   100u


  c           11              7    100u


  d          10           10      100u


  e           9           15      100u


An Indifference curve is the locus point of all those combination of two commodity that yield same level of
                                            satisfaction or utility to the consumer
An Indifference Map

A graph showing a whole set of indifference curves is called an indifference map. An
indifference map, in other words, is comprised of a set of indifference curves. Each
  successive curve further from the original curve indicates a higher level of total
                                    satisfaction.
VI. Marginal Rate of Substitution of goods – MRS xy


 The concept of Marginal Rate Substitution (MRS) was introduced by Dr. J.R. Hicks and
    Prof. R.G.D. Allen to take the place of the concept of diminishing marginal utility.


    • The slop of indifference curve is known as Marginal Rate of Substitution MRS
    • The rate or ratio at which goods X and Y are to be exchanged is known as the
                           marginal rate of substitution (MRS).
• “The marginal rate of substitution of X for Y measures the number of units of Y that
     must be scarified for one unit of X gained so as to maintain a constant level of
                                        satisfaction”.


          MRS xy = Change in good X / Changes in good Y - MRS xy =
VI. Marginal Rate of Substitution of goods – MRS xy


• MRS : “The marginal rate of substitution of X for Y measures the number of units of Y
      that must be scarified for unit of X gained so as to maintain a constant level of
                                        satisfaction”.


           MRS xy = Change in good X / Changes in good Y - MRS xy =


    Combination    Apple X    Mango Y        Utility      Ratio         MRS
          A            1           15            100           -              -
          B            2           10            100          5:1             5
          C            3            6            100          4:1             4
          D            4            3            100          3:1             3
          E            5            1            100          2:1             2
VI. Marginal Rate of Substitution of goods – MRS xy

• MRS : “The marginal rate of substitution of X for Y measures the number of units of Y
    that must be scarified for one unit of X gained so as to maintain a constant level of
                                       satisfaction”.

MRS xy = Change in good Y / Changes in good X - MRS xy =
VI. Marginal Rate of Substitution of goods – MRS xy


• MRS : “The marginal rate of substitution of X for Y measures the number of units of Y
      that must be scarified for unit of X gained so as to maintain a constant level of
                                        satisfaction”.


           MRS xy = Change in good X / Changes in good Y - MRS xy =


         Combination Apple X         Mango Y      Ratio        MRS
                A             2          30
               B              4          20
               C              6          12
               D              8          6
                E             10         2
VI. Marginal Rate of Substitution of goods – MRS xy


• MRS : “The marginal rate of substitution of X for Y measures the number of units of Y
      that must be scarified for unit of X gained so as to maintain a constant level of
                                        satisfaction”.


           MRS xy = Change in good X / Changes in good Y - MRS xy =


         Combination Apple X         Mango Y      Ratio         MRS
                A             2          30               -           -
               B              4          20              10:2         5
               C              6          12              8:2          4
               D              8          6               6:2          3
                E            10          2               4:2          2
VII. Principles of Diminishing Marginal Rate of Substitution of goods – MRS xy


This behaviour showing falling MRS of good X for good Y and yet to remain at the same
     level of satisfaction is known as Diminishing Marginal Rate of Substitution.


                                      Combination Apple X        Mango Y      MRS
                                            A             1          15             -
                                            B             2          10             5
                                            C             3           6             4
                                            D             4           3             3
                                            E             5           1             2
V.    Properties/Characteristics of Indifference Curve


 (1) Indifference Curves are Negatively Sloped:


It slopes downward because as the consumer increases the consumption of X commodity, he
       has to give up certain units of Y commodity in order to maintain the same level of
                                           satisfaction.
V.   Properties/Characteristics of Indifference Curve


(2) Indifference Curve are Convex to the Origin:


  the consumer substitutes commodity X for
commodity Y, the marginal rate of substitution
  diminishes of X for Y along an indifference
                     curve.
   Principle of Diminishing Marginal Rate of
                  Substitution
V.   Properties/Characteristics of Indifference Curve


(3) Higher Indifference Curve Represents Higher Level

A higher indifference curve that lies above and to the right of another indifference
    curve represents a higher level of satisfaction and combination on a lower
                   indifference curve yields a lower satisfaction.
V.    Properties/Characteristics of Indifference Curve


(4) Indifference Curve Cannot Intersect Each Other:


    Given the definition of indifference curve and the assumptions behind it, the
indifference curves cannot intersect each other. It is because at the point of tangency,
the higher curve will give as much as of the two commodities as is given by the lower
                                  indifference curve.
V.    Properties/Characteristics of Indifference Curve


(5) Indifference Curves do not Touch the Horizontal or Vertical Axis:

   One of the basic assumptions of indifference curves is that the consumer purchases
    combinations of different commodities. He is not supposed to purchase only one
                                      commodity.
VIII.Price Line or Budget Line


A budget line or price line represents the various combinations of two goods which can
       be purchased with a given money income and assumed prices of goods".

 Income (Y)= 60 , Price of Biscuit (Px) = 6, Price of Coffee(Py) = 12

                      Market          Biscuit     Coffee
                      Basket            Qx         Qy
                          A              10          0
                          B              8
                          C              6
                         D               4
                          E              2
                          F              0           5


             Price Line or Budget Line
VIII.Price Line or Budget Line

 A budget line or price line represents the various combinations of two goods which can
           be purchased with a given money income and assumed prices of goods".


Income (Y)= 60 , Price of Biscuit (Px) = 6, Price of Coffee(Py) = 12


Combination Biscuit          Coffee
       A             10          0
      B               8          1
      C               6          2
      D               4          3
      E               2          4
      F               0          5
IX. Slop of Price Line or Budget Line


The slope of the budget line indicates how many packets of biscuits a purchaser
must give up to buy one more packet of coffee. For example, the slope at point B on
the budget line is ∆Y / ∆X
X. Changes or Shift in Price Line or Budget Line


 The price line is determined by the income of the consumer and the prices of goods in
 the market. If there is a change in the income of the consumer or in the prices of goods,
            the price line shifts in response to a exchange in these two factors.


(i) Income changes: When there is change in the income of the consumer, the prices of
goods remaining the same, the price line shifts from the original position. It shifts
upward or to the right hand side in a parallel position with the rise in income.


(ii) Price changes. If there is a change in the price of one good, the income of the consumer
and price of other good is held constant. When there is a fall in the price of one good say
commodity A, the consumer purchases more of that good than before. A price change
causes the budget line to rotate
X. Changes or Shift in Price Line or Budget Line


(i) Income changes: When there is change in the income of the consumer, the prices of
goods remaining the same, the price line shifts from the original position. It shifts
upward or to the right hand side in a parallel position with the rise in income.


                       Rise in income.


                                                                A fall in Income?????
X. Changes or Shift in Price Line or Budget Line


(ii) Price changes. If there is a change in the price of one good, the income of the
consumer and price of other good is held constant. When there is a fall in the price of one
good say commodity A, the consumer purchases more of that good than before. A price
change causes the budget line to rotate


                                                   What will happen to Price Line
                                                   • Price of commodity B fall?
                                                   • Price of Commodity B Rice ?
                                                   • Price of commodity A rice ?
XI. Conclusion
XI. Conclusion
Thanks

Cardinal utility analysis

  • 1.
    SEMINAR Presentation Ordinal Utilityanalysis or Indifference Curve Approach BA Economics Programme Thesmiyath P Muhammed Fasil P.K. Savad P Hafizudeeen SAFI Institute of Advanced Study, Vazhayoor
  • 2.
    I. Introduction to Utility analysis II. Cardinal Utility approach and Ordinal Utility l approach III. Ordinal Utility analysis and its assumptions IV. Meaning of Indifference curve V. Indifference Map Contents VI. ginal Rate of Substitution - MRS xy VII. Properties of Indifference Curve VIII. MarPrinciples of Diminishing Marginal Substitution IX. Budget Line or Price Line X. Slop of Price Line XI. Changes in Budget Line or Price Line XII. Superiority of IC Analysis and Cardinal Utility Analysis XIII. Conclusion
  • 3.
    I. Introduction to Utility analysis
  • 4.
    I. Introduction to Utility analysis  Meaning of Utility - The power of a commodity that satisfy the wants of consumer - want satisfying power • Introduced by Jermy Bentham • Measurement ‘Utils’ • Subjective entity
  • 5.
    II. Cardinal Utilityapproach and Ordinal Utility l approach
  • 6.
    II. Cardinal Utilityapproach and Ordinal Utility l approach Utility Analysis Cardinal Utility analysis Ordinal Utility Analysis • Alfred Marshal • J. R. Hicks & R.G.D. Allen • can be measured •Cannot be measured but compared • ‘Utils’ as rank • Law of Diminishing Marginal • Indifference Curve analysis Utility •Law of Equi-marginal Utility •Mashellian Analysis
  • 7.
    III. Meaning ofOrdinal Utility analysis and its assumptions
  • 8.
    III. Meaning ofOrdinal Utility analysis and its assumptions Meaning of Ordinal Utility analysis • Ordinal means- Can be compare with each other- 1St , 2nd , 3rd etc. • Ordinal Utility analysis - Utility can compare but can not be measure. • Popularized by J.R. Hicks and R.G.D. Allen • Used the tool named Indifference Curve • Known as Indifference curve approach of utility analysis
  • 9.
    Assumption of OrdinalUtility Analysis or Indifference Curve approach
  • 10.
    III. Assumption ofCardinal Utility Analysis or Indifference Curve approach 1. Consumer is rational or Rationality : Consumer’s Objective is maximization of utility, subject to Price and consumption expenditure 2. Utility is ordinal: Utility cannot be measured cardinally. It can be expressed ordinally can rank according to the satisfaction or utility of each basket. 3. Consistence in choice : if the consumer prefers combinations of A of good to the combinations B of goods, he then remains consistent in his choice. If A > B, then never become B > A
  • 11.
    III. Assumption ofCardinal Utility Analysis or Indifference Curve approach 4. Consumer’s Preference is Transitive: A is preferred over combination B is preferred over C, then combination A is preferred over combination A is preferred over C. If A > B and B > C, then A > C 5. Diminishing Marginal Substitution of goods: In the Indifference Curve analysis, the principle of Diminishing Marginal Rate of Substitution is assumed. That is Convexity of Indifference curve or Negative slop of indifference 6. Dependent Utility: TU = f( q1 + q2 + q3 + . . . . . .+ qn) 7. A Large bundle of goods preferred to small bundle
  • 12.
    IV. Meaning ofIndifference Curve
  • 13.
    IV. Meaning ofIndifference Curve • The Indifference curve was invented by F Y Edgeworth An Indifference curve is the locus point of all those combination of two commodity that yield same level of satisfaction or utility to the consume
  • 14.
    IV. Meaning ofIndifference Curve An Indifference curve is the locus point of all those combination of two commodity that yield same level of satisfaction or utility to the consumer Various Combinations: Utility Combination Unit of Rice Unit of Wheat a) 16 kg of Rice 2 kg of Wheat 100u b) 12 kg of Rice 5 kg of Wheat 100u c) 11 kg of Rice 7 kg of Wheat 100u d) 10 kg of Rice 10 kg of Wheat 100u e) 9 kg of Rice 15 kg of Wheat 100u
  • 15.
    IV. Meaning ofIndifference Curve Various Combinations: Unit of Utility Unit of Rice Wheat a 16 2 100u b 12 5 100u c 11 7 100u d 10 10 100u e 9 15 100u An Indifference curve is the locus point of all those combination of two commodity that yield same level of satisfaction or utility to the consumer
  • 16.
    An Indifference Map Agraph showing a whole set of indifference curves is called an indifference map. An indifference map, in other words, is comprised of a set of indifference curves. Each successive curve further from the original curve indicates a higher level of total satisfaction.
  • 17.
    VI. Marginal Rateof Substitution of goods – MRS xy
  • 18.
    VI. Marginal Rateof Substitution of goods – MRS xy The concept of Marginal Rate Substitution (MRS) was introduced by Dr. J.R. Hicks and Prof. R.G.D. Allen to take the place of the concept of diminishing marginal utility. • The slop of indifference curve is known as Marginal Rate of Substitution MRS • The rate or ratio at which goods X and Y are to be exchanged is known as the marginal rate of substitution (MRS). • “The marginal rate of substitution of X for Y measures the number of units of Y that must be scarified for one unit of X gained so as to maintain a constant level of satisfaction”. MRS xy = Change in good X / Changes in good Y - MRS xy =
  • 19.
    VI. Marginal Rateof Substitution of goods – MRS xy • MRS : “The marginal rate of substitution of X for Y measures the number of units of Y that must be scarified for unit of X gained so as to maintain a constant level of satisfaction”. MRS xy = Change in good X / Changes in good Y - MRS xy = Combination Apple X Mango Y Utility Ratio MRS A 1 15 100 - - B 2 10 100 5:1 5 C 3 6 100 4:1 4 D 4 3 100 3:1 3 E 5 1 100 2:1 2
  • 20.
    VI. Marginal Rateof Substitution of goods – MRS xy • MRS : “The marginal rate of substitution of X for Y measures the number of units of Y that must be scarified for one unit of X gained so as to maintain a constant level of satisfaction”. MRS xy = Change in good Y / Changes in good X - MRS xy =
  • 21.
    VI. Marginal Rateof Substitution of goods – MRS xy • MRS : “The marginal rate of substitution of X for Y measures the number of units of Y that must be scarified for unit of X gained so as to maintain a constant level of satisfaction”. MRS xy = Change in good X / Changes in good Y - MRS xy = Combination Apple X Mango Y Ratio MRS A 2 30 B 4 20 C 6 12 D 8 6 E 10 2
  • 22.
    VI. Marginal Rateof Substitution of goods – MRS xy • MRS : “The marginal rate of substitution of X for Y measures the number of units of Y that must be scarified for unit of X gained so as to maintain a constant level of satisfaction”. MRS xy = Change in good X / Changes in good Y - MRS xy = Combination Apple X Mango Y Ratio MRS A 2 30 - - B 4 20 10:2 5 C 6 12 8:2 4 D 8 6 6:2 3 E 10 2 4:2 2
  • 23.
    VII. Principles ofDiminishing Marginal Rate of Substitution of goods – MRS xy
  • 24.
    VII. Principles ofDiminishing Marginal Rate of Substitution of goods – MRS xy This behaviour showing falling MRS of good X for good Y and yet to remain at the same level of satisfaction is known as Diminishing Marginal Rate of Substitution. Combination Apple X Mango Y MRS A 1 15 - B 2 10 5 C 3 6 4 D 4 3 3 E 5 1 2
  • 25.
    V. Properties/Characteristics of Indifference Curve (1) Indifference Curves are Negatively Sloped: It slopes downward because as the consumer increases the consumption of X commodity, he has to give up certain units of Y commodity in order to maintain the same level of satisfaction.
  • 26.
    V. Properties/Characteristics of Indifference Curve (2) Indifference Curve are Convex to the Origin: the consumer substitutes commodity X for commodity Y, the marginal rate of substitution diminishes of X for Y along an indifference curve. Principle of Diminishing Marginal Rate of Substitution
  • 27.
    V. Properties/Characteristics of Indifference Curve
  • 28.
    V. Properties/Characteristics of Indifference Curve (3) Higher Indifference Curve Represents Higher Level A higher indifference curve that lies above and to the right of another indifference curve represents a higher level of satisfaction and combination on a lower indifference curve yields a lower satisfaction.
  • 29.
    V. Properties/Characteristics of Indifference Curve (4) Indifference Curve Cannot Intersect Each Other: Given the definition of indifference curve and the assumptions behind it, the indifference curves cannot intersect each other. It is because at the point of tangency, the higher curve will give as much as of the two commodities as is given by the lower indifference curve.
  • 30.
    V. Properties/Characteristics of Indifference Curve (5) Indifference Curves do not Touch the Horizontal or Vertical Axis: One of the basic assumptions of indifference curves is that the consumer purchases combinations of different commodities. He is not supposed to purchase only one commodity.
  • 31.
    VIII.Price Line orBudget Line
  • 32.
    VIII.Price Line orBudget Line A budget line or price line represents the various combinations of two goods which can be purchased with a given money income and assumed prices of goods". Income (Y)= 60 , Price of Biscuit (Px) = 6, Price of Coffee(Py) = 12 Market Biscuit Coffee Basket Qx Qy A 10 0 B 8 C 6 D 4 E 2 F 0 5 Price Line or Budget Line
  • 33.
    VIII.Price Line orBudget Line A budget line or price line represents the various combinations of two goods which can be purchased with a given money income and assumed prices of goods". Income (Y)= 60 , Price of Biscuit (Px) = 6, Price of Coffee(Py) = 12 Combination Biscuit Coffee A 10 0 B 8 1 C 6 2 D 4 3 E 2 4 F 0 5
  • 34.
    IX. Slop ofPrice Line or Budget Line
  • 35.
    IX. Slop ofPrice Line or Budget Line The slope of the budget line indicates how many packets of biscuits a purchaser must give up to buy one more packet of coffee. For example, the slope at point B on the budget line is ∆Y / ∆X
  • 36.
    X. Changes orShift in Price Line or Budget Line
  • 37.
    X. Changes orShift in Price Line or Budget Line The price line is determined by the income of the consumer and the prices of goods in the market. If there is a change in the income of the consumer or in the prices of goods, the price line shifts in response to a exchange in these two factors. (i) Income changes: When there is change in the income of the consumer, the prices of goods remaining the same, the price line shifts from the original position. It shifts upward or to the right hand side in a parallel position with the rise in income. (ii) Price changes. If there is a change in the price of one good, the income of the consumer and price of other good is held constant. When there is a fall in the price of one good say commodity A, the consumer purchases more of that good than before. A price change causes the budget line to rotate
  • 38.
    X. Changes orShift in Price Line or Budget Line (i) Income changes: When there is change in the income of the consumer, the prices of goods remaining the same, the price line shifts from the original position. It shifts upward or to the right hand side in a parallel position with the rise in income. Rise in income. A fall in Income?????
  • 39.
    X. Changes orShift in Price Line or Budget Line (ii) Price changes. If there is a change in the price of one good, the income of the consumer and price of other good is held constant. When there is a fall in the price of one good say commodity A, the consumer purchases more of that good than before. A price change causes the budget line to rotate What will happen to Price Line • Price of commodity B fall? • Price of Commodity B Rice ? • Price of commodity A rice ?
  • 40.
  • 41.
  • 42.