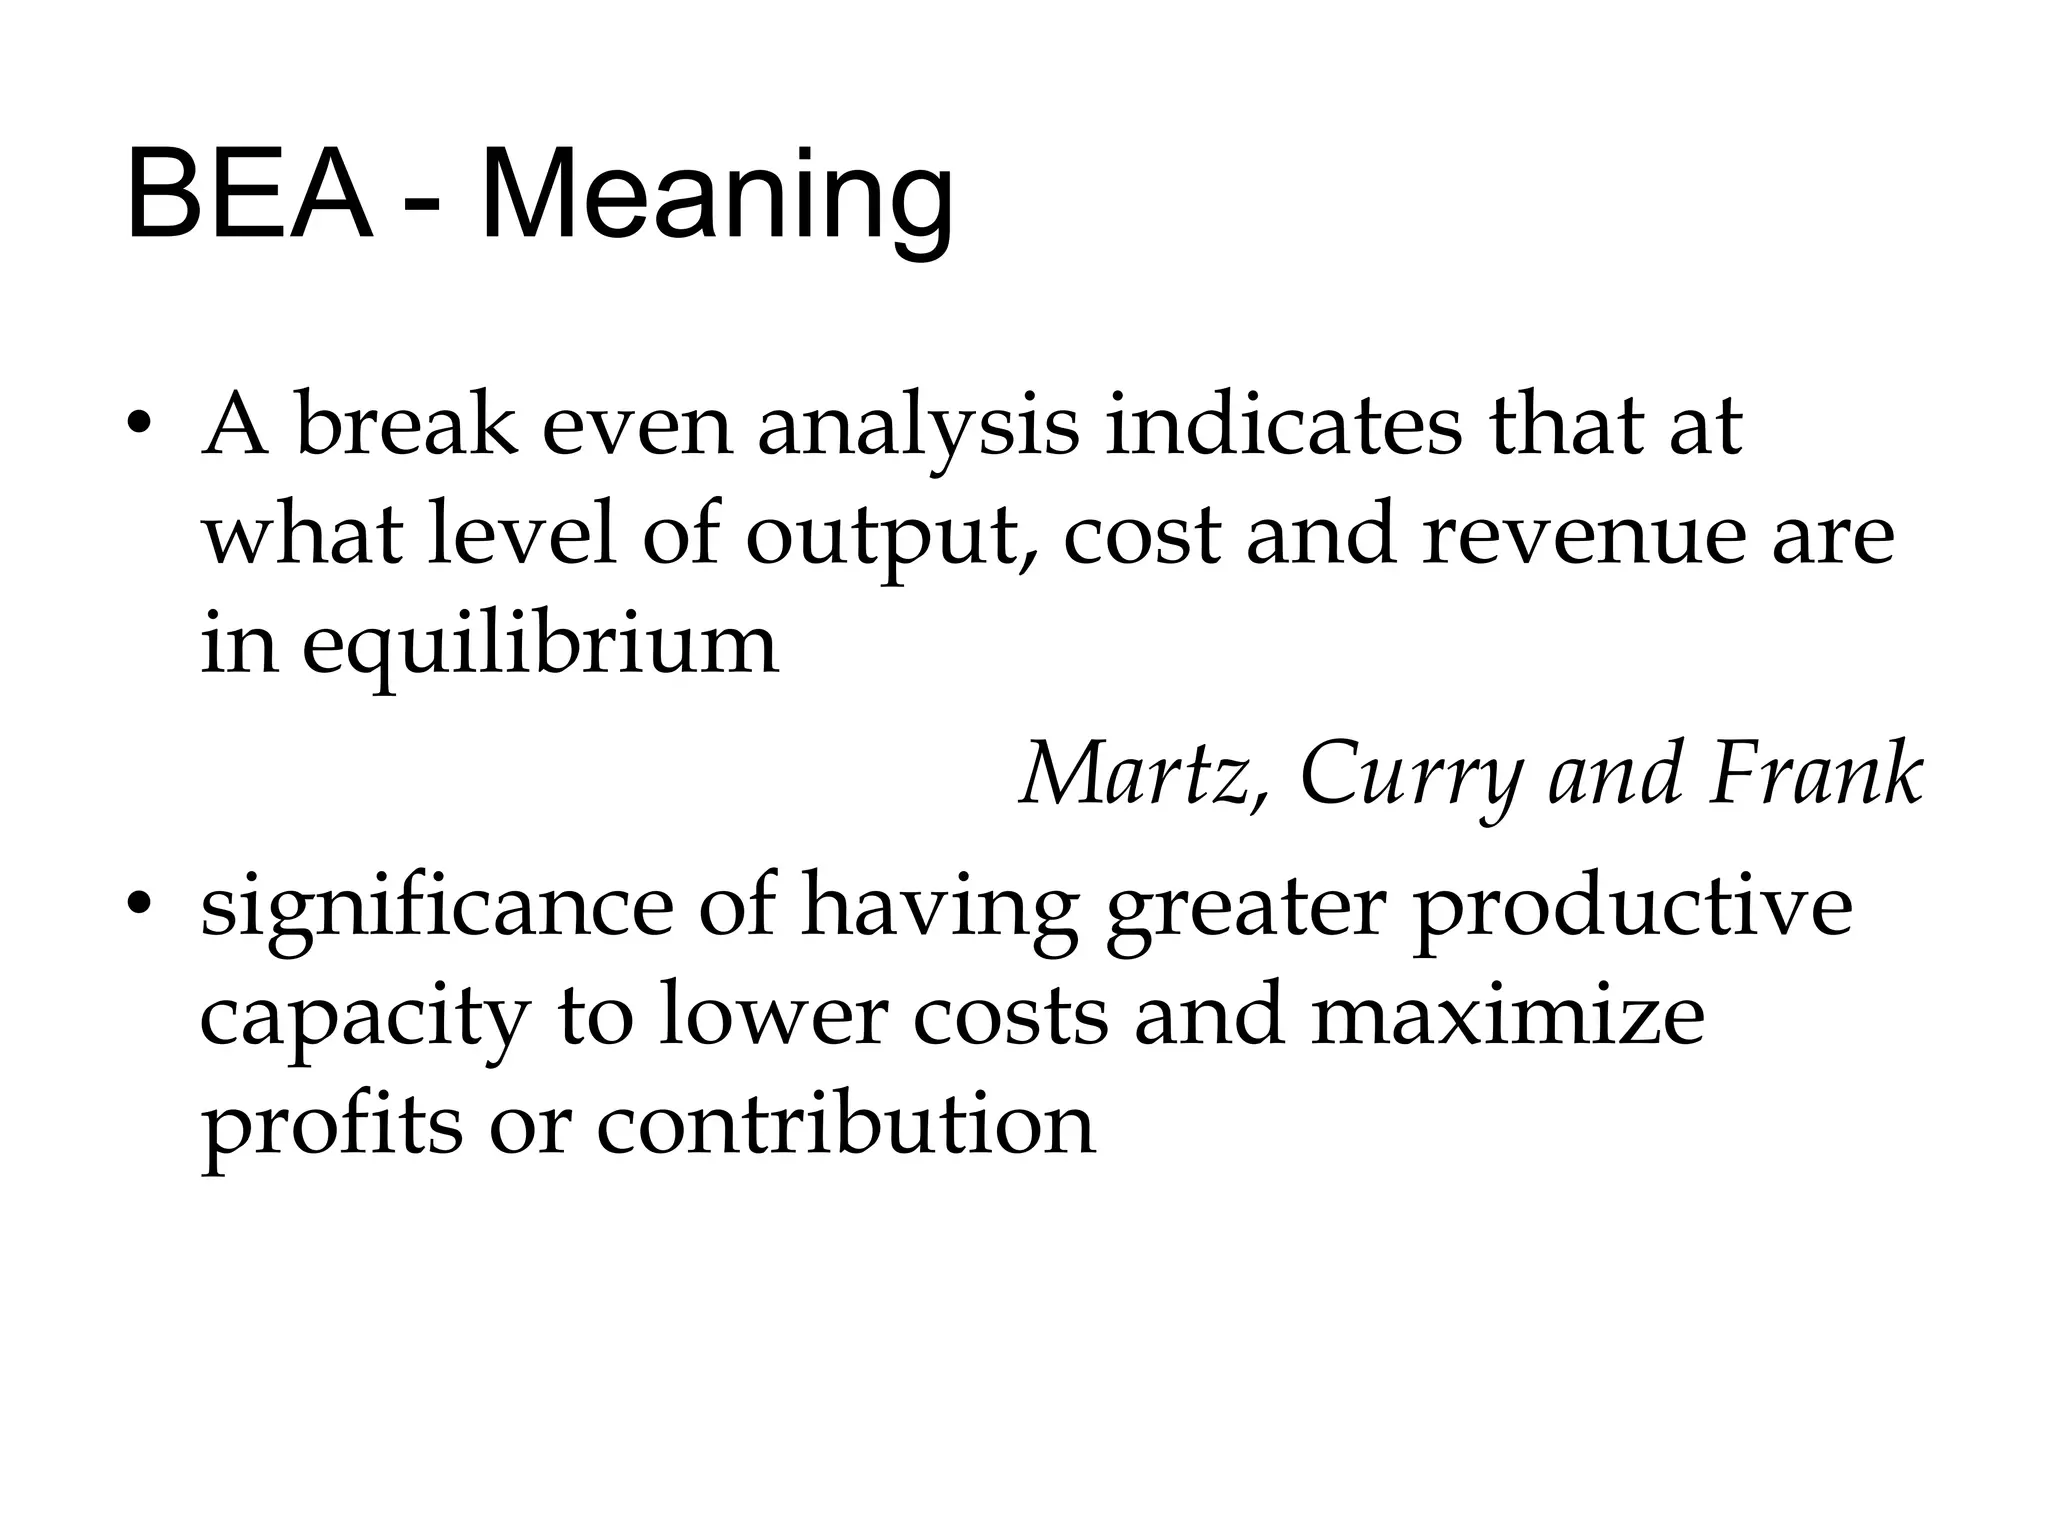
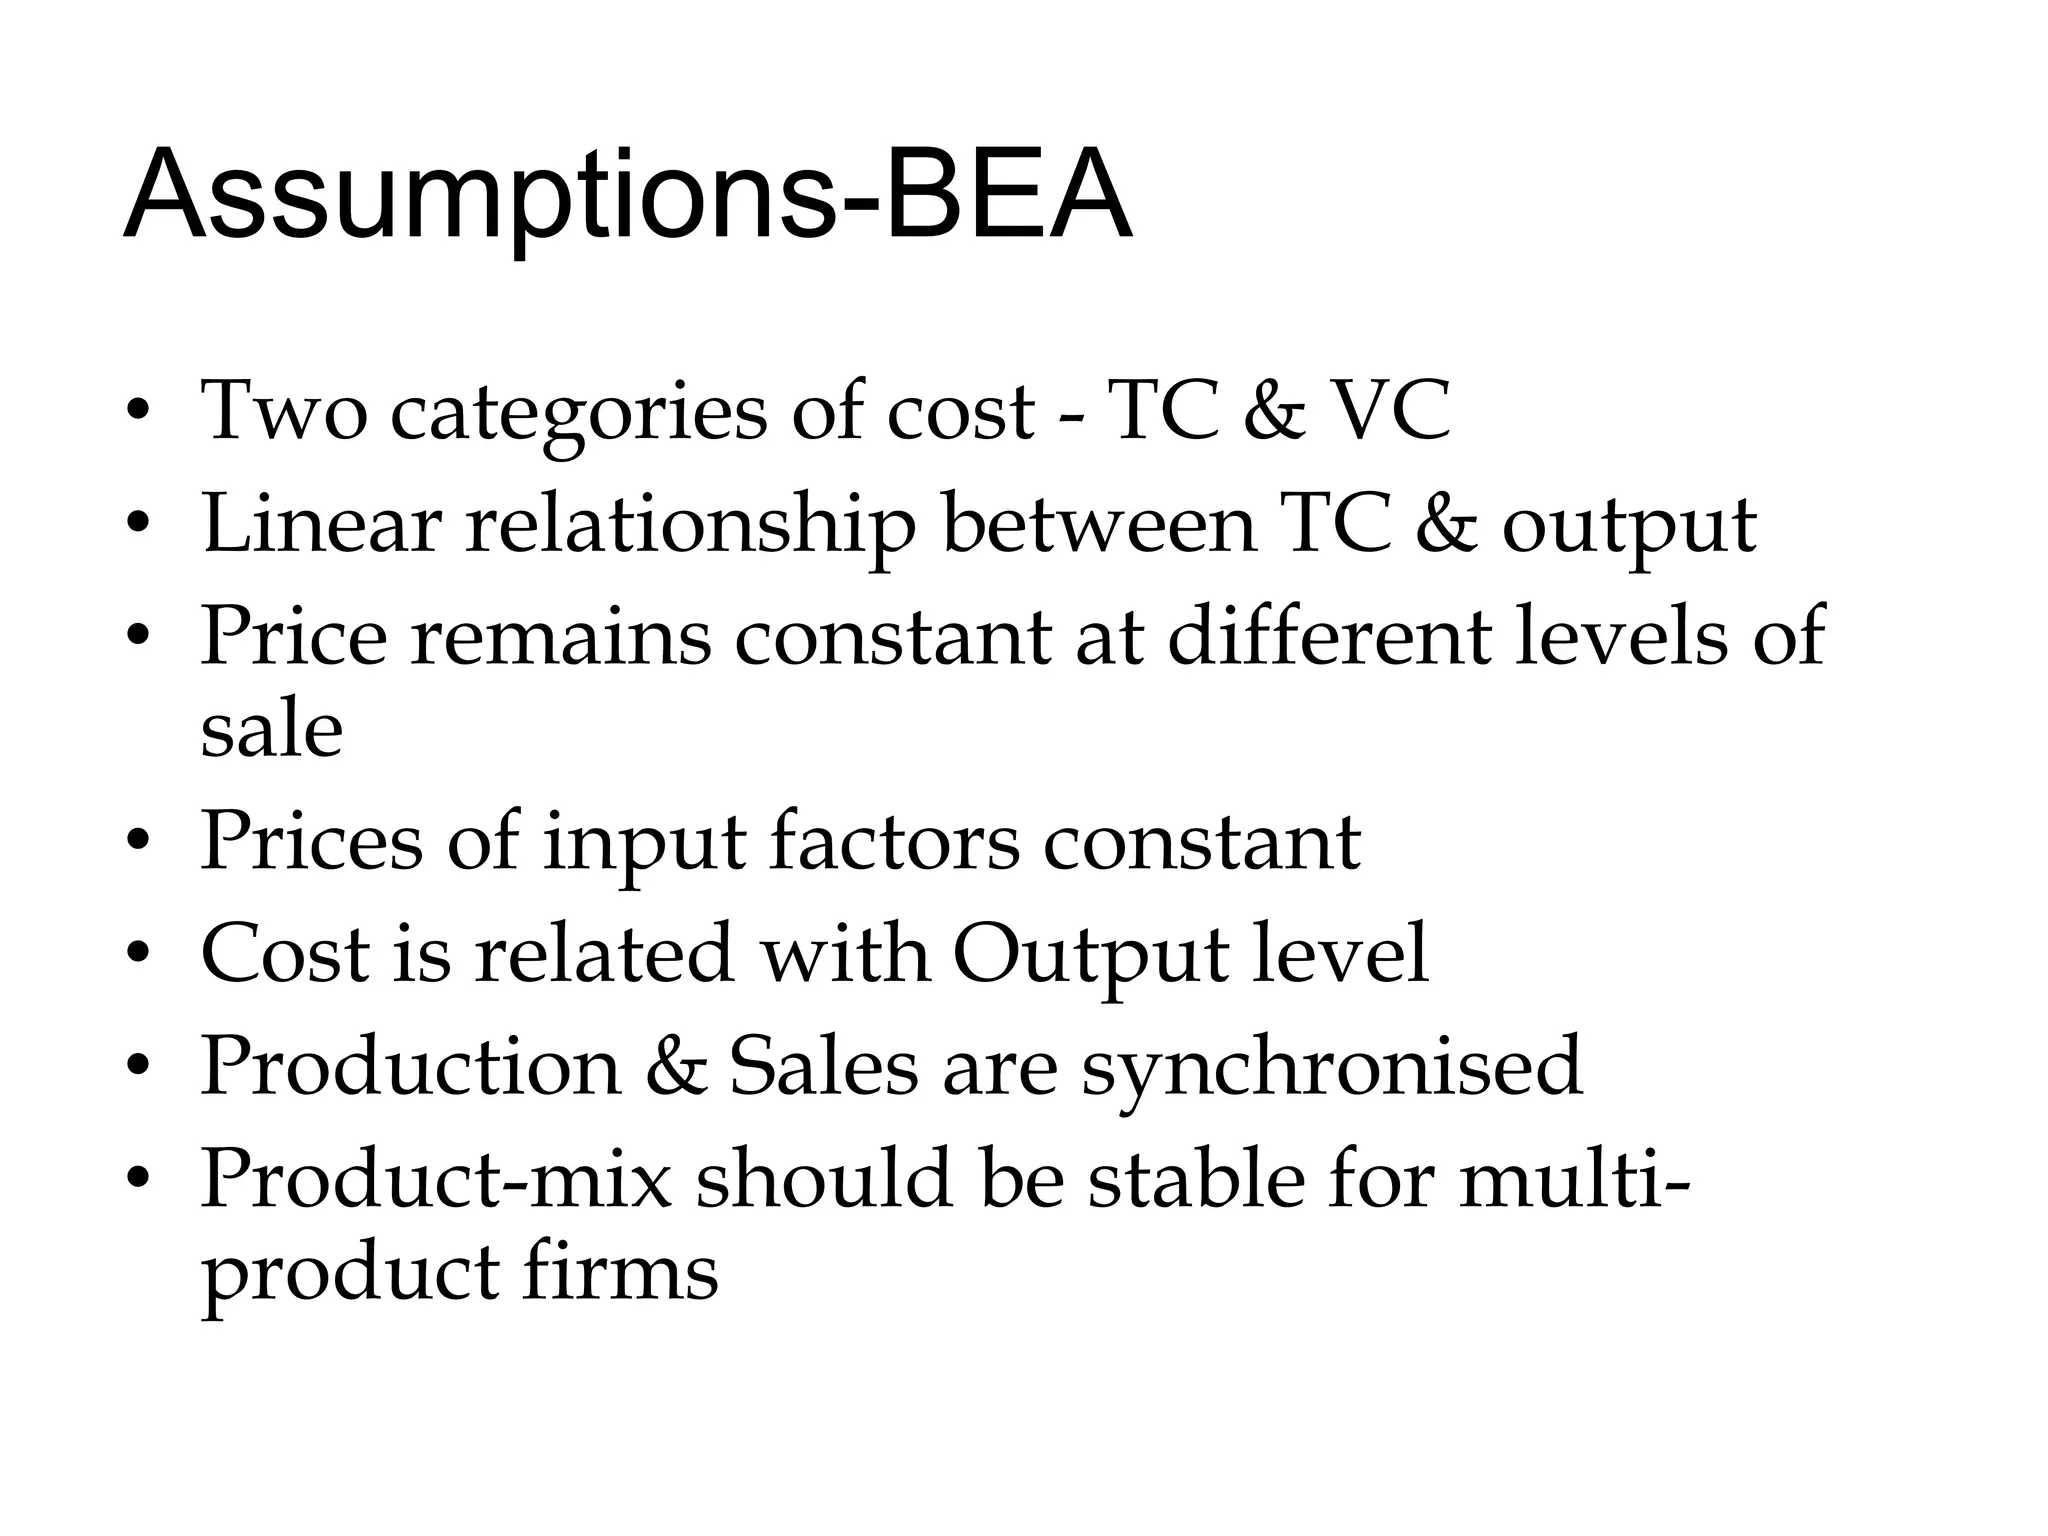
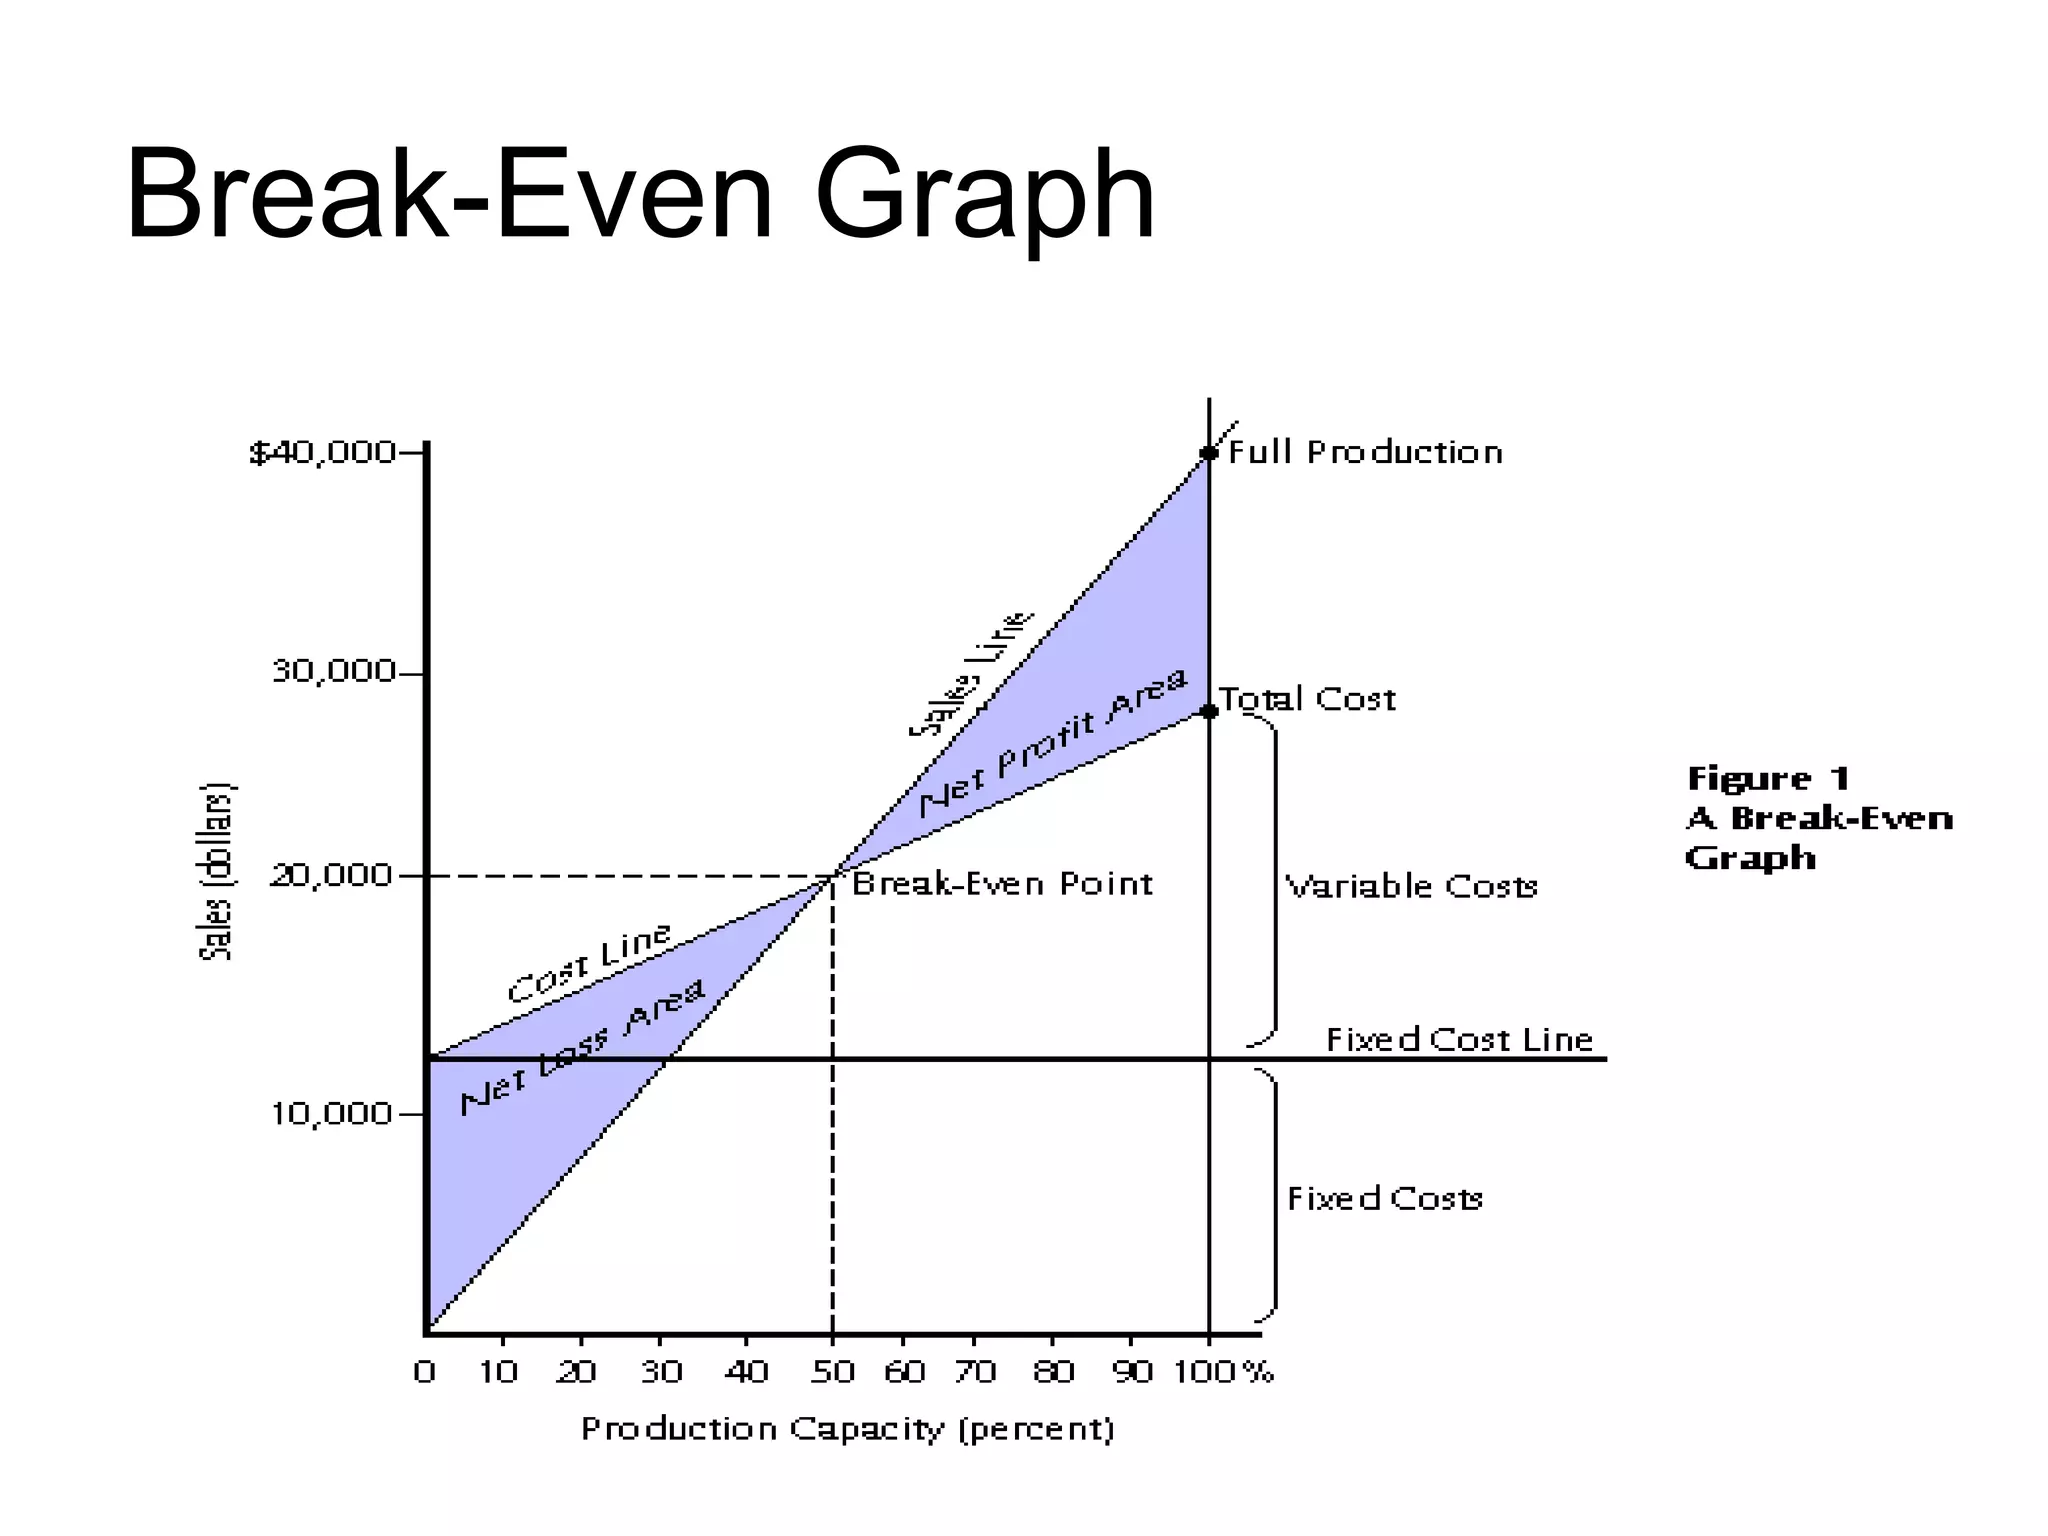
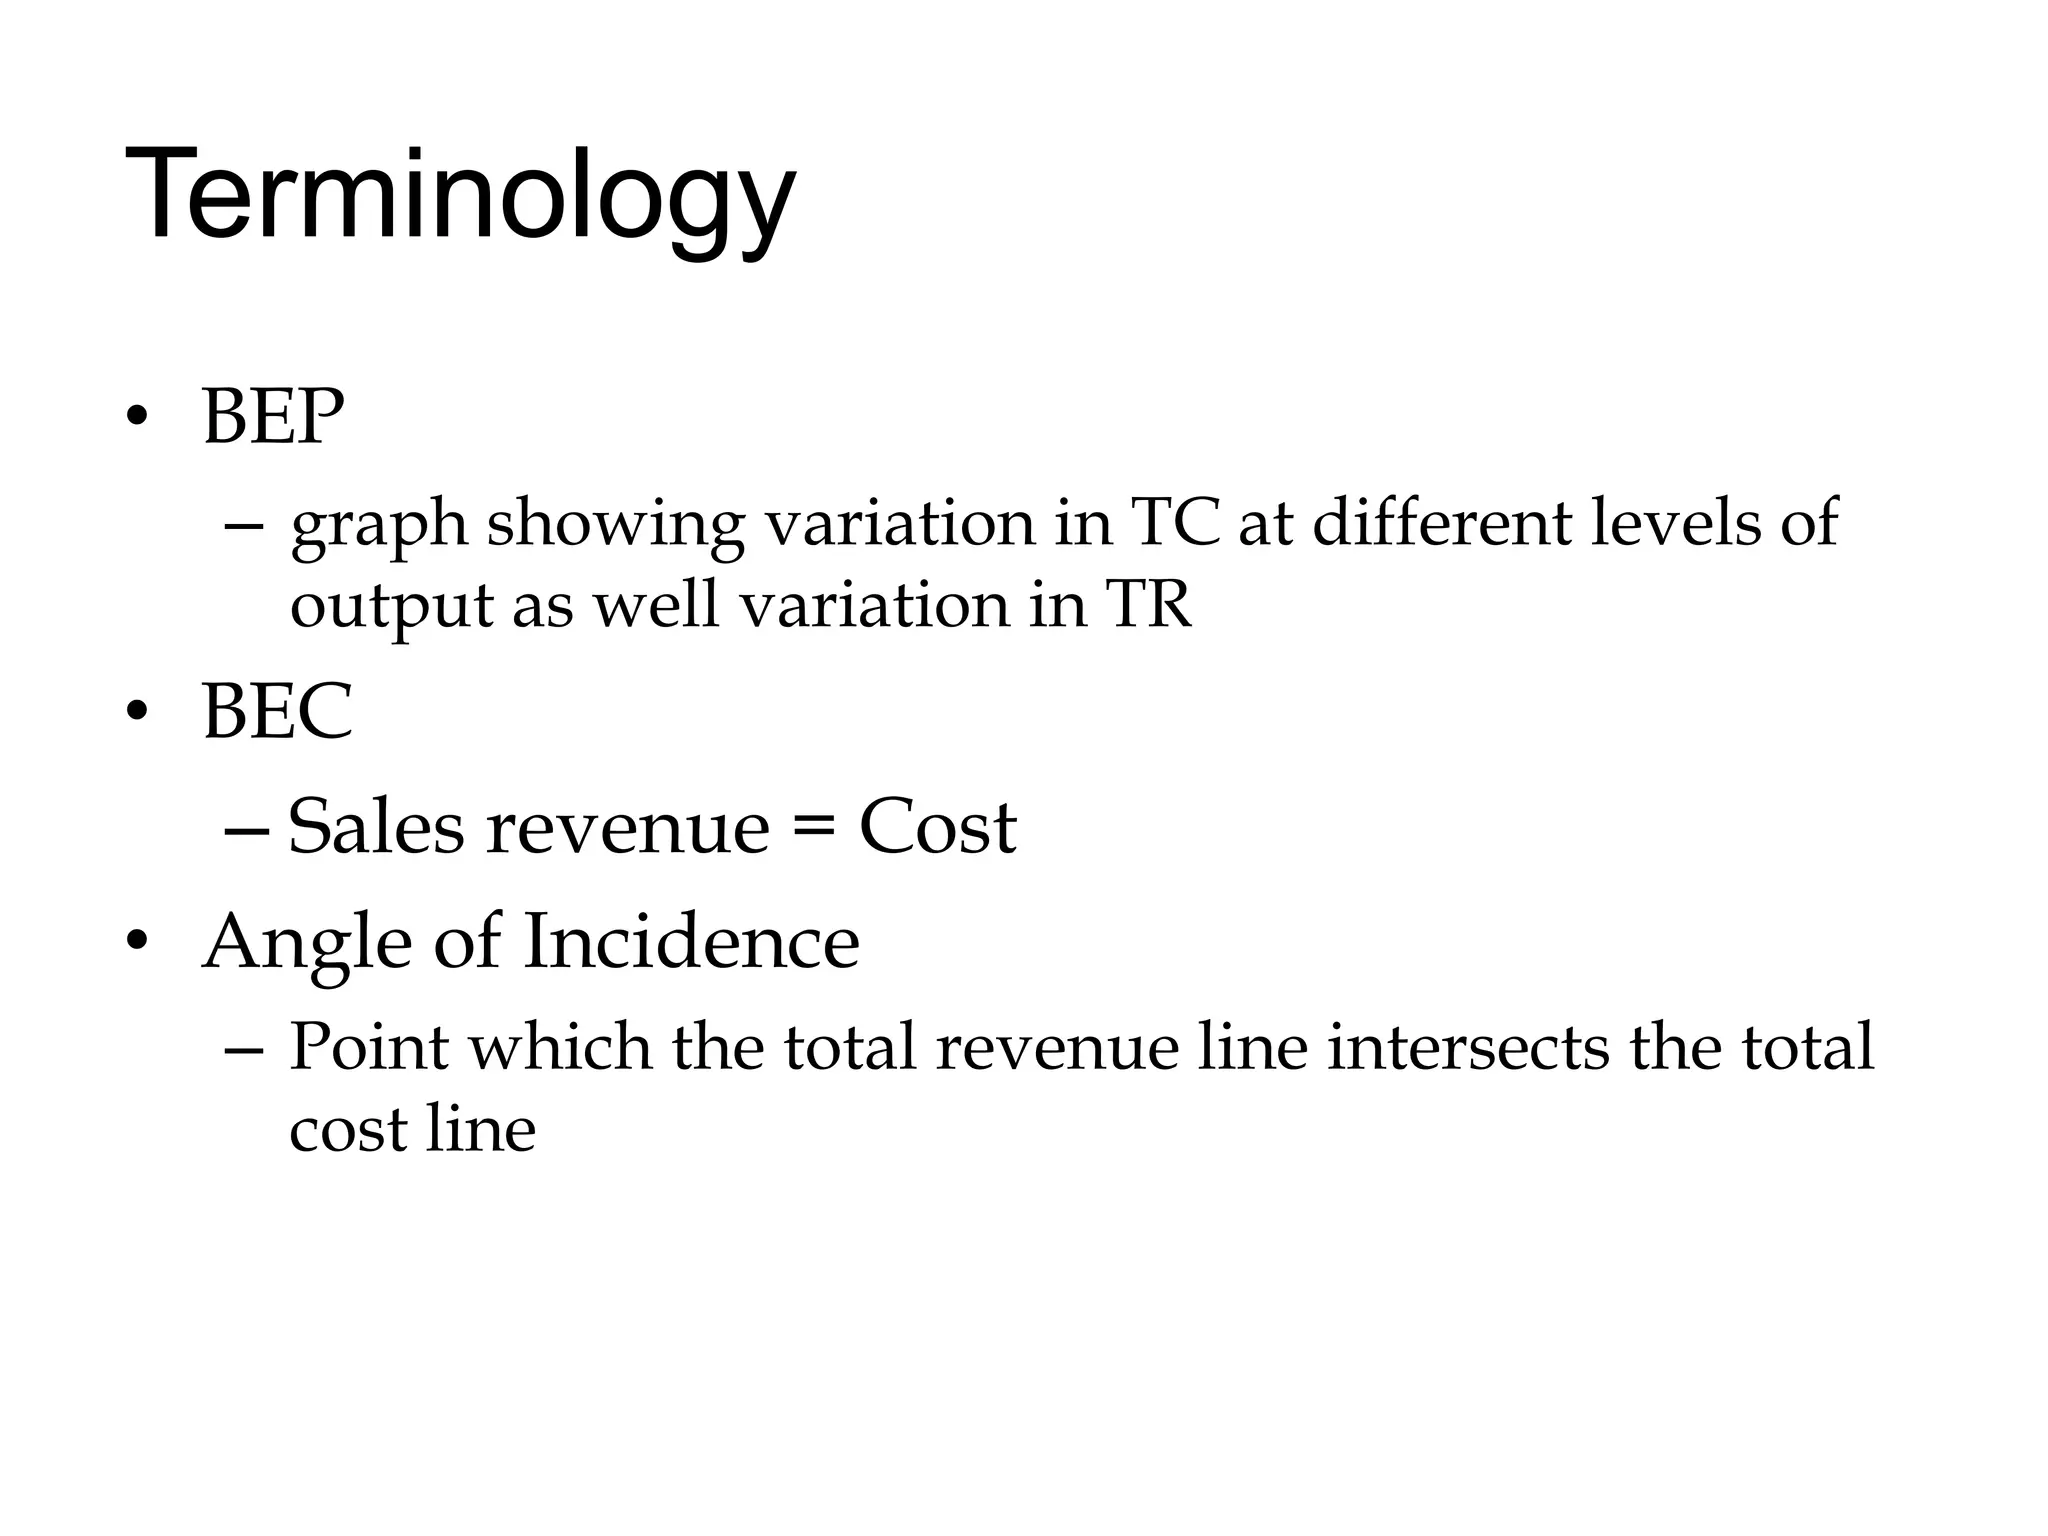
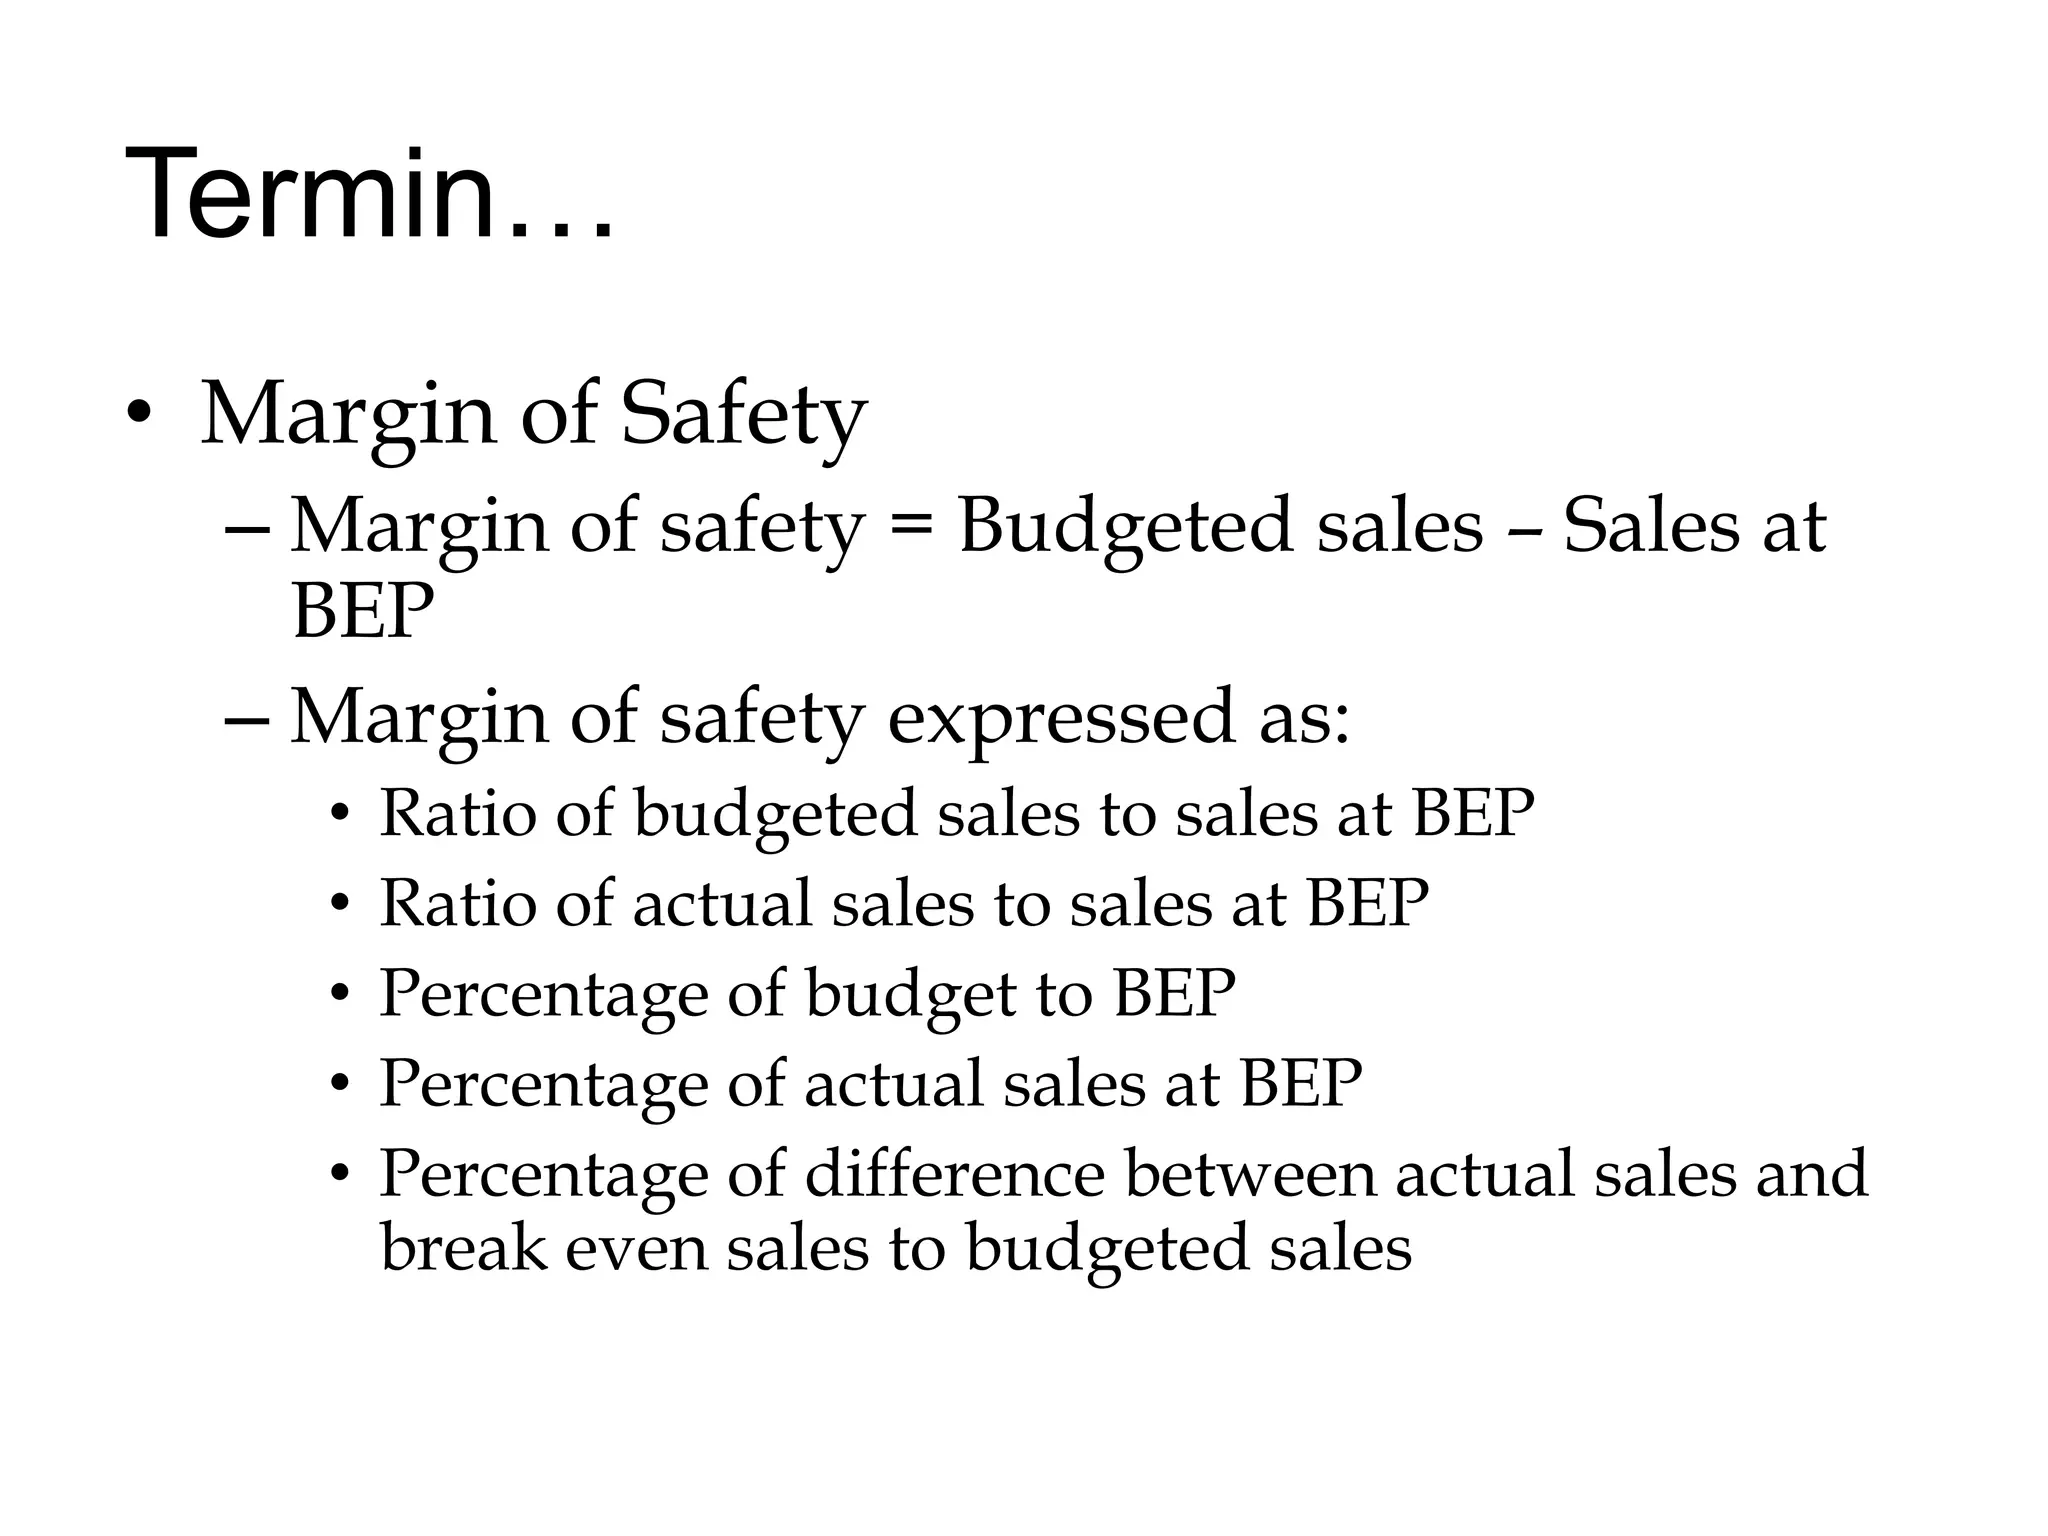
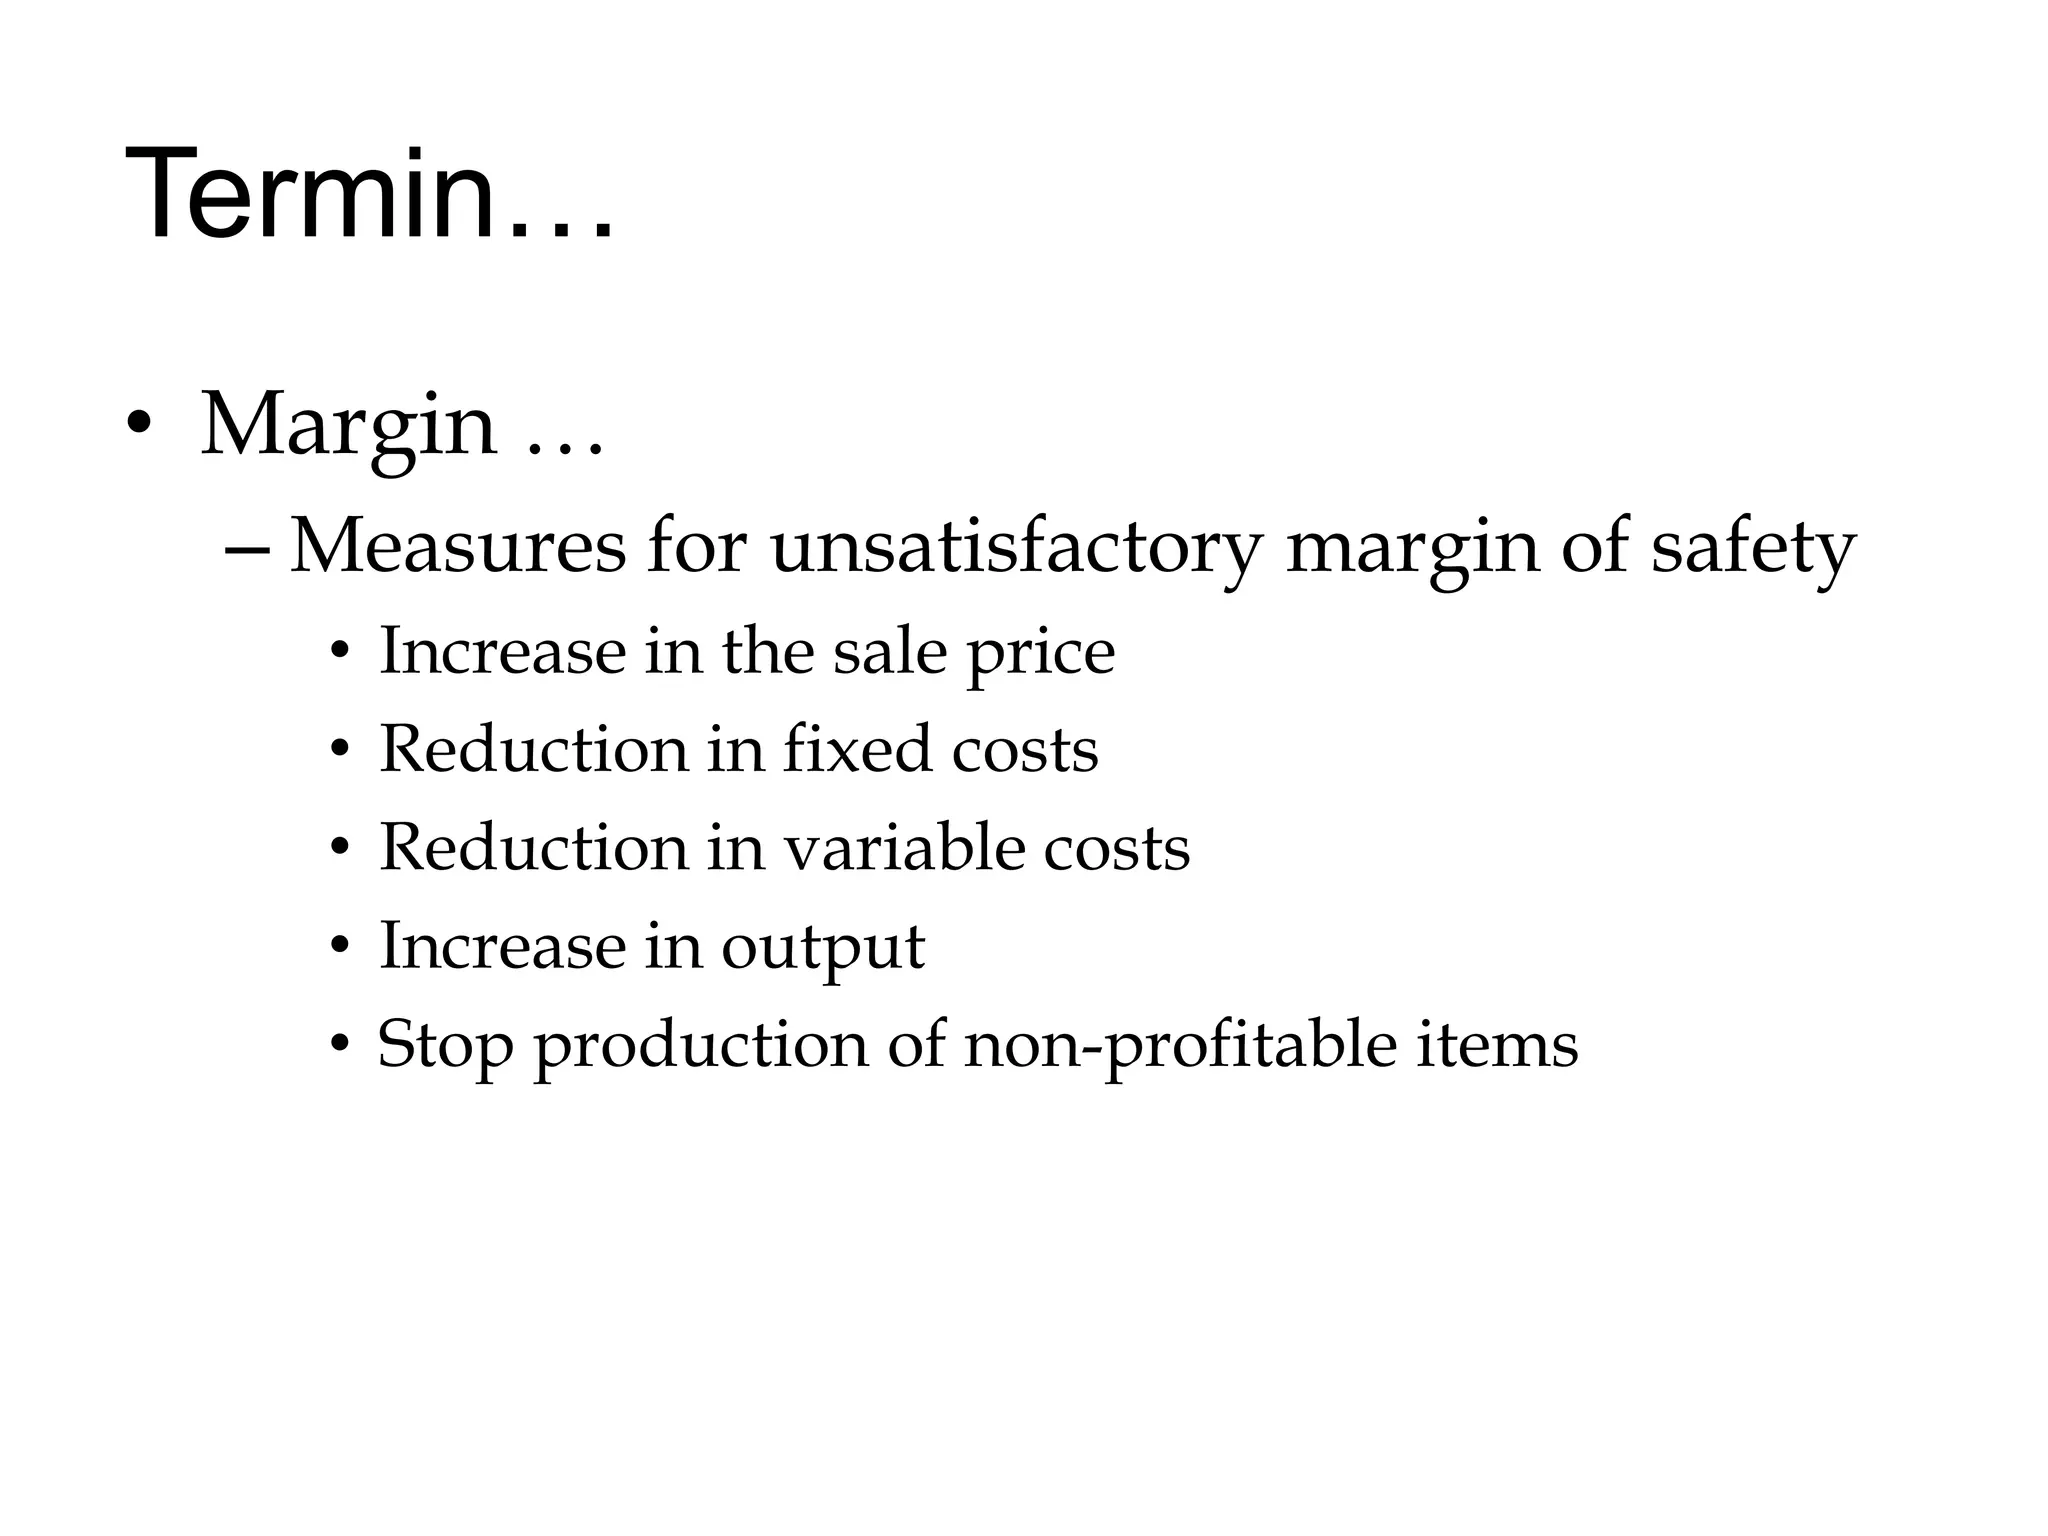
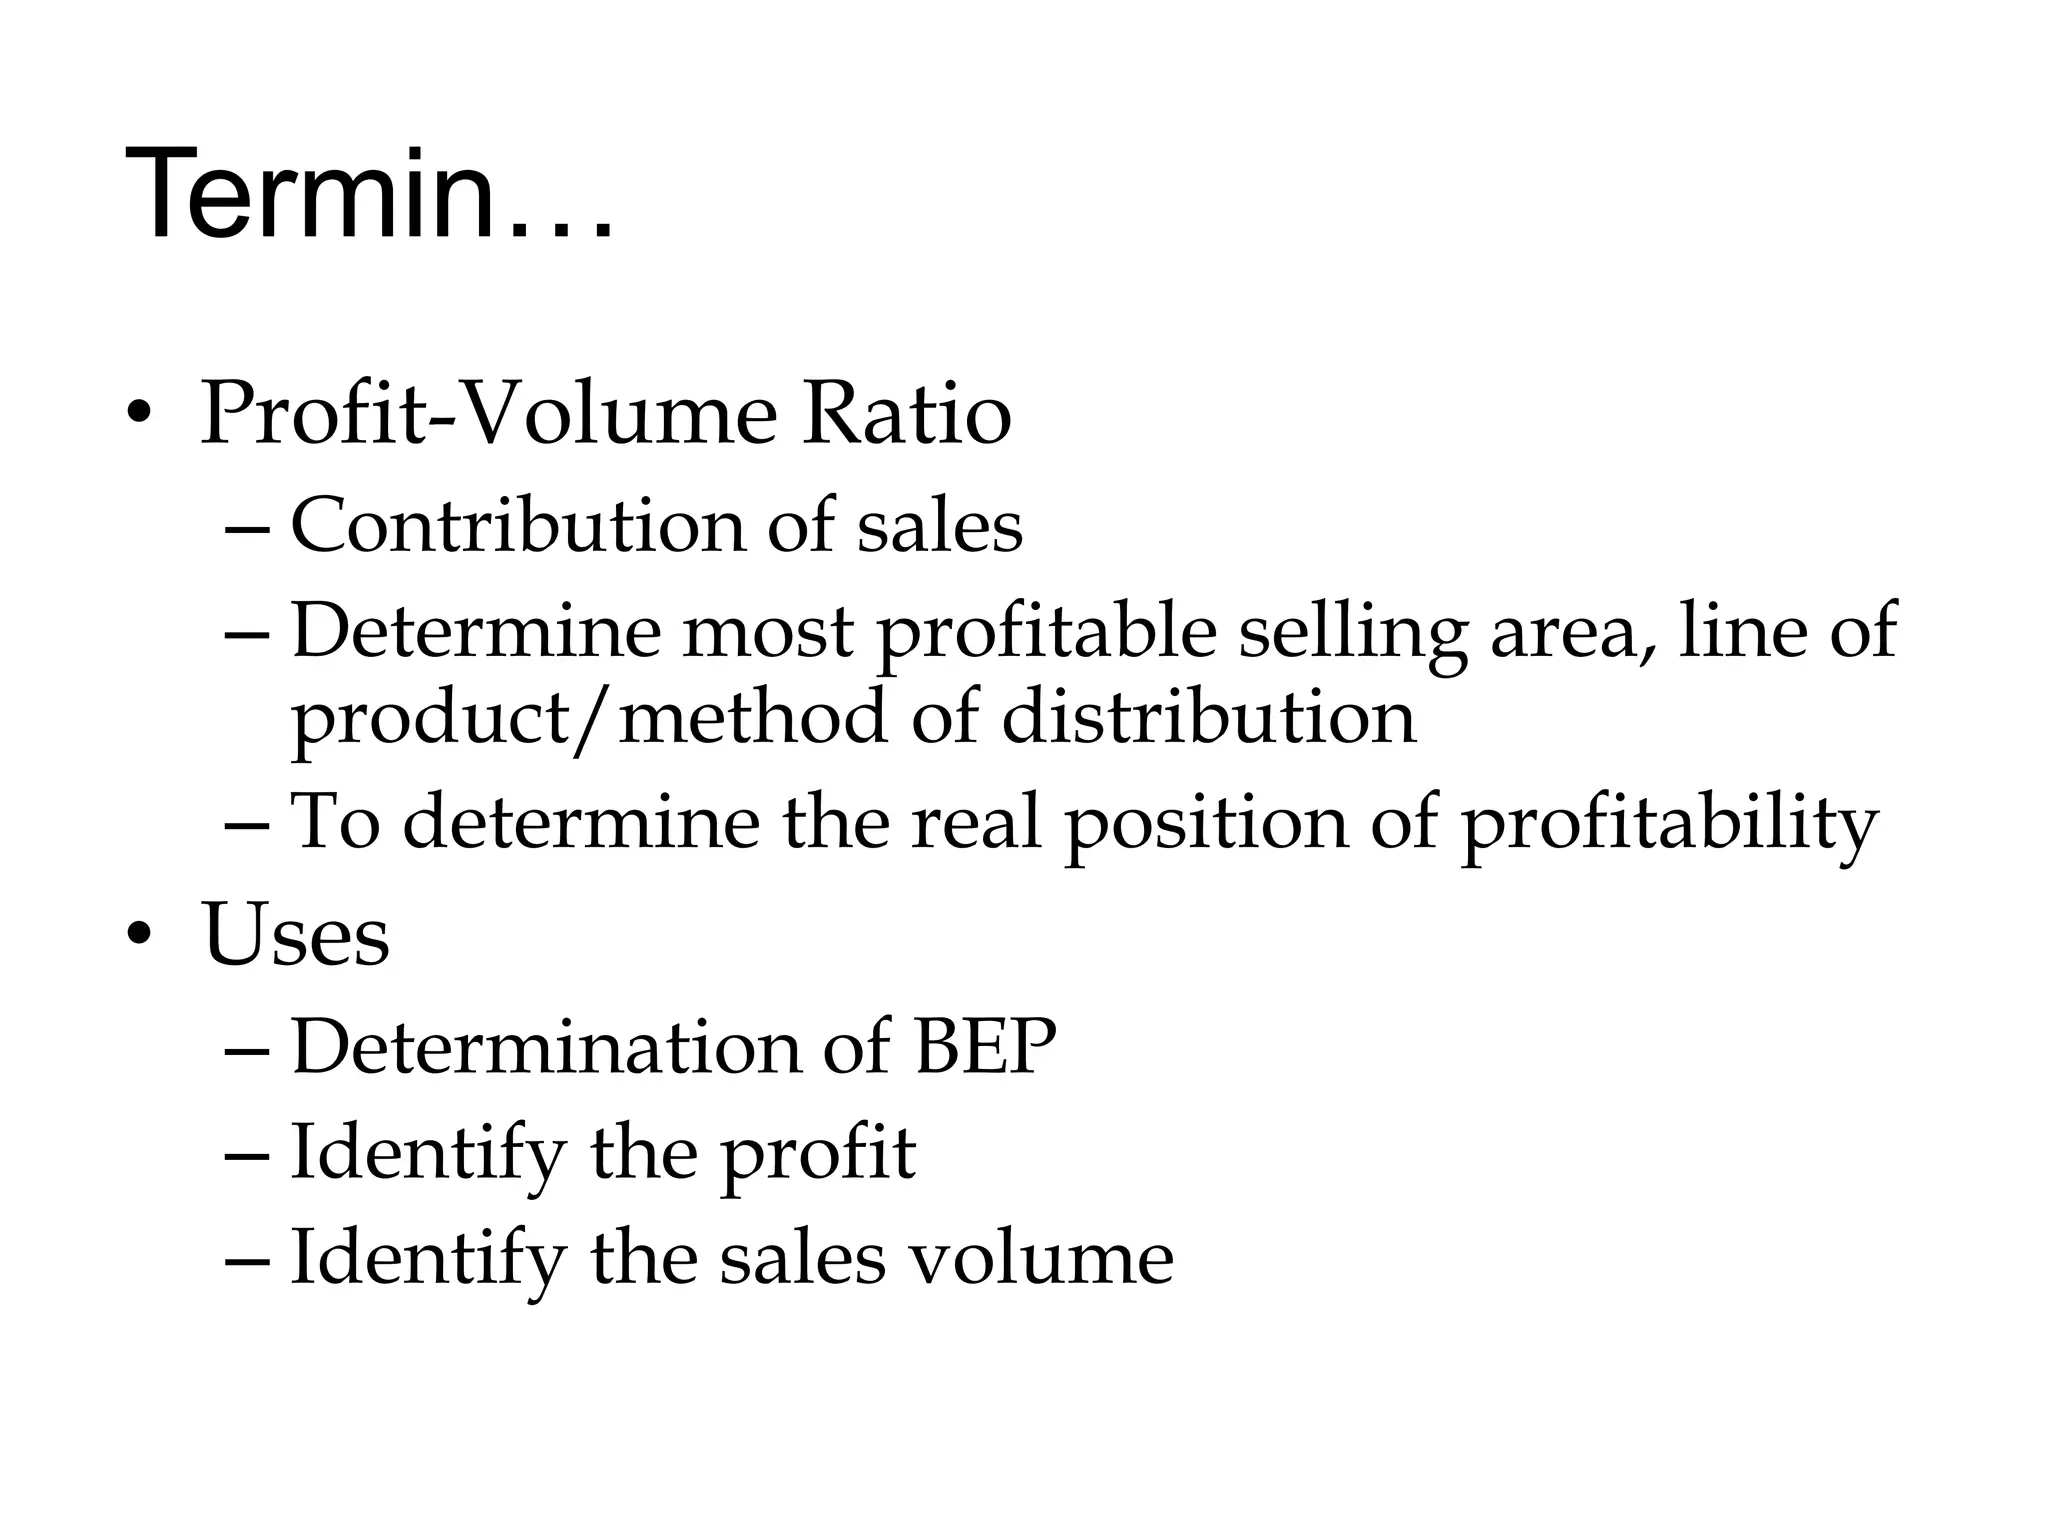
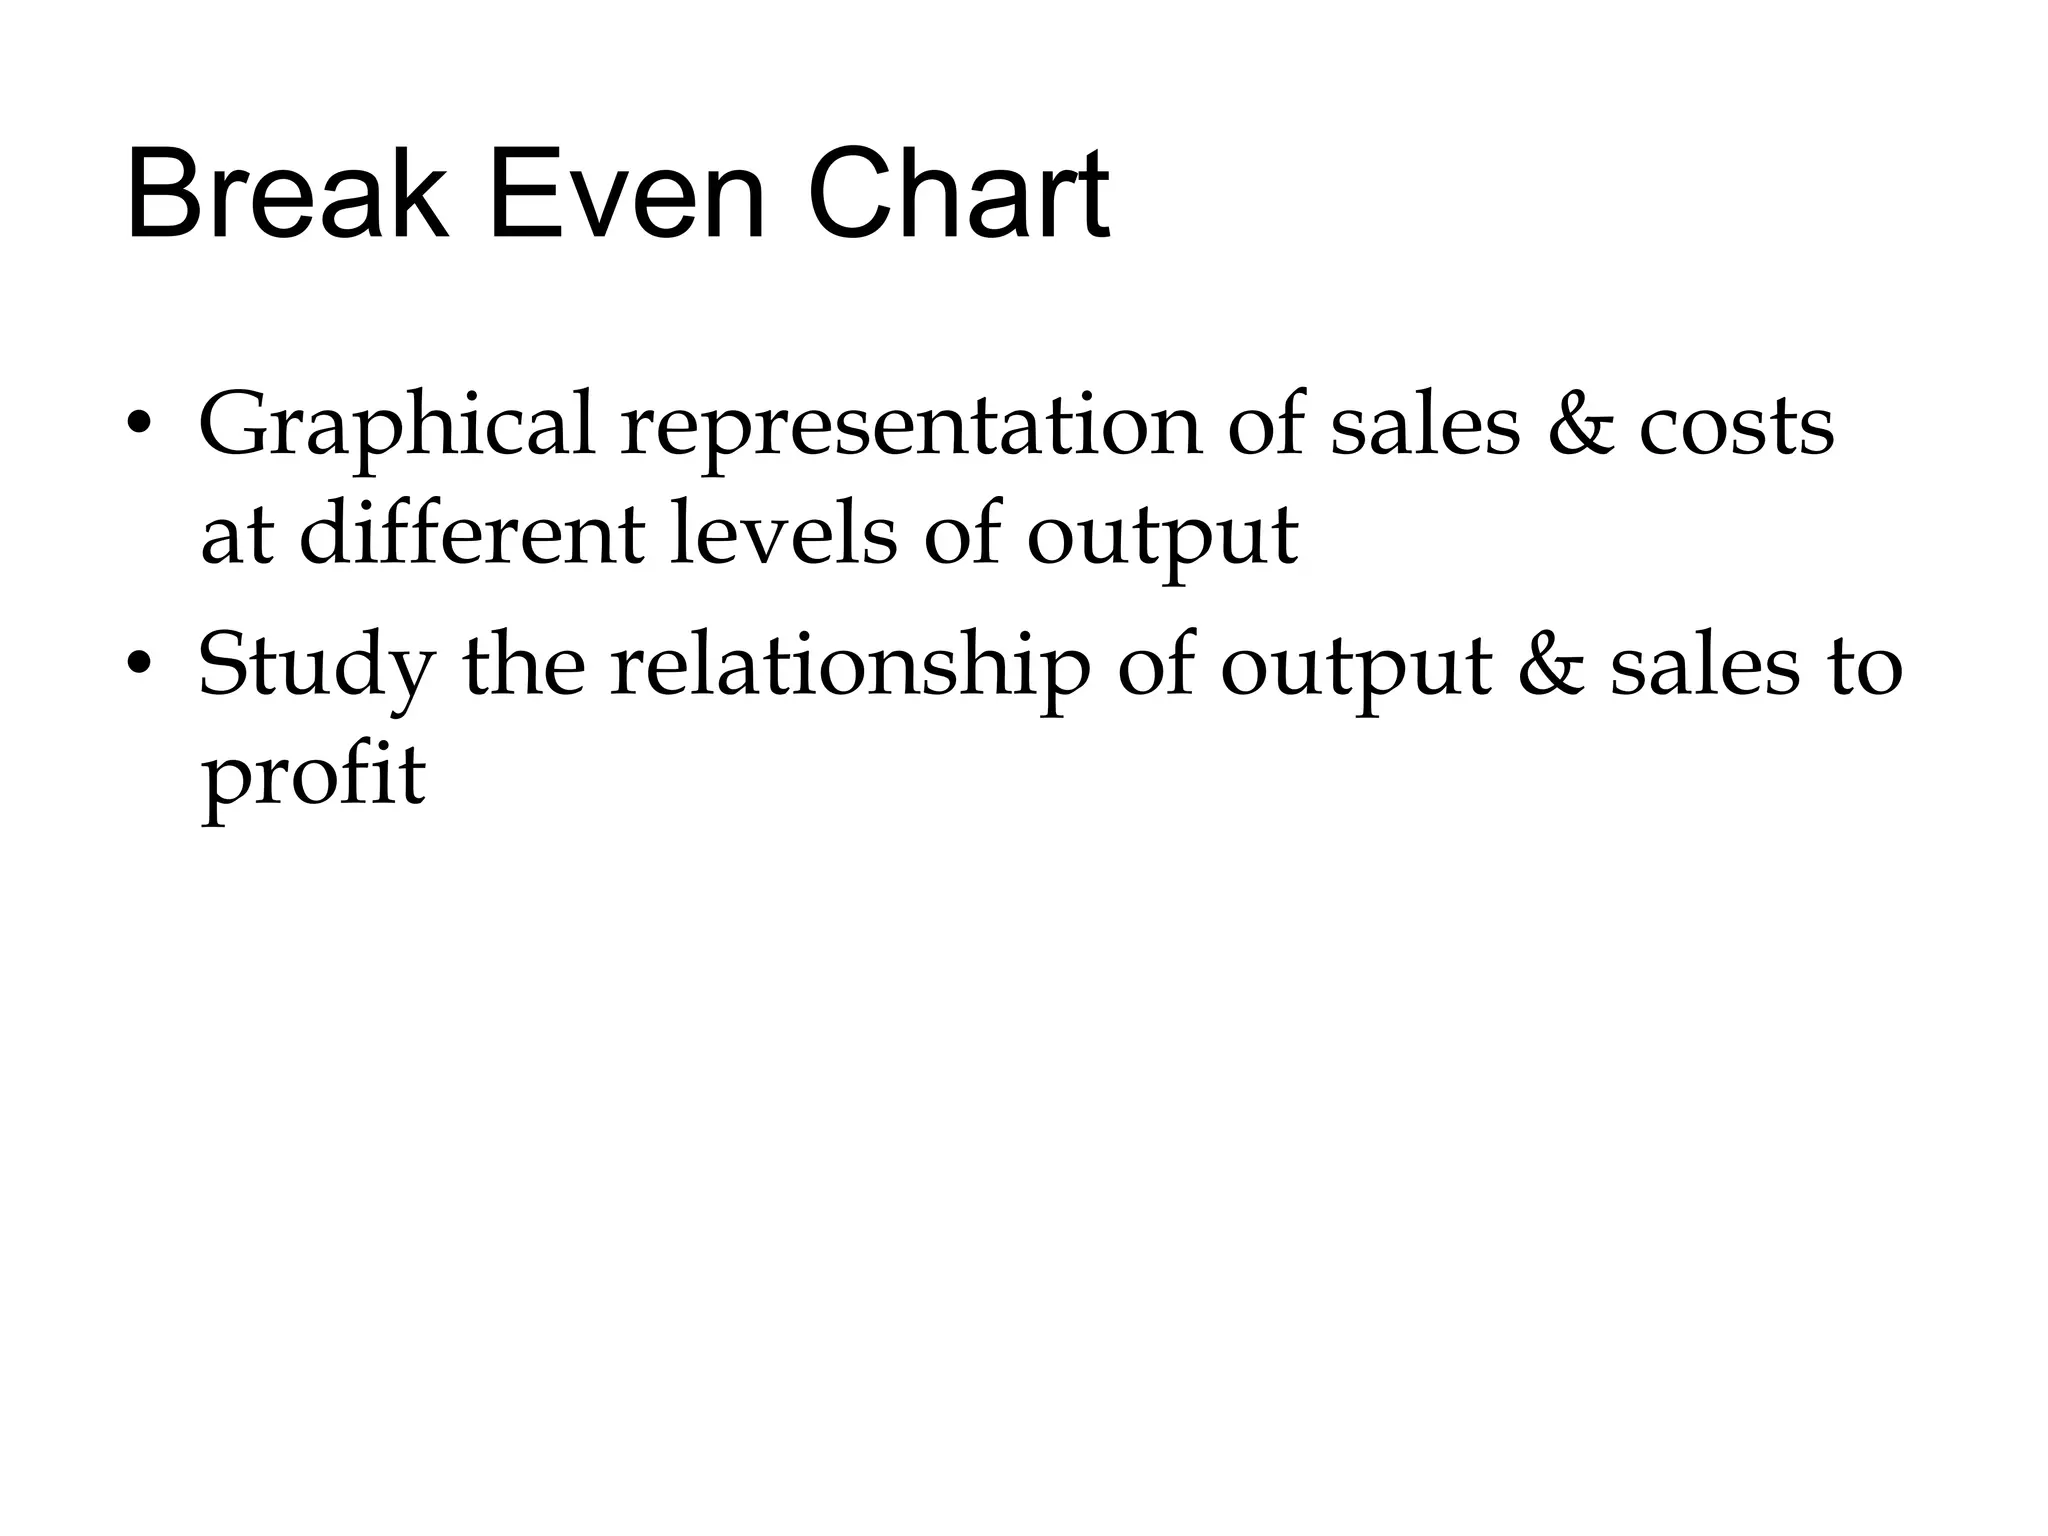
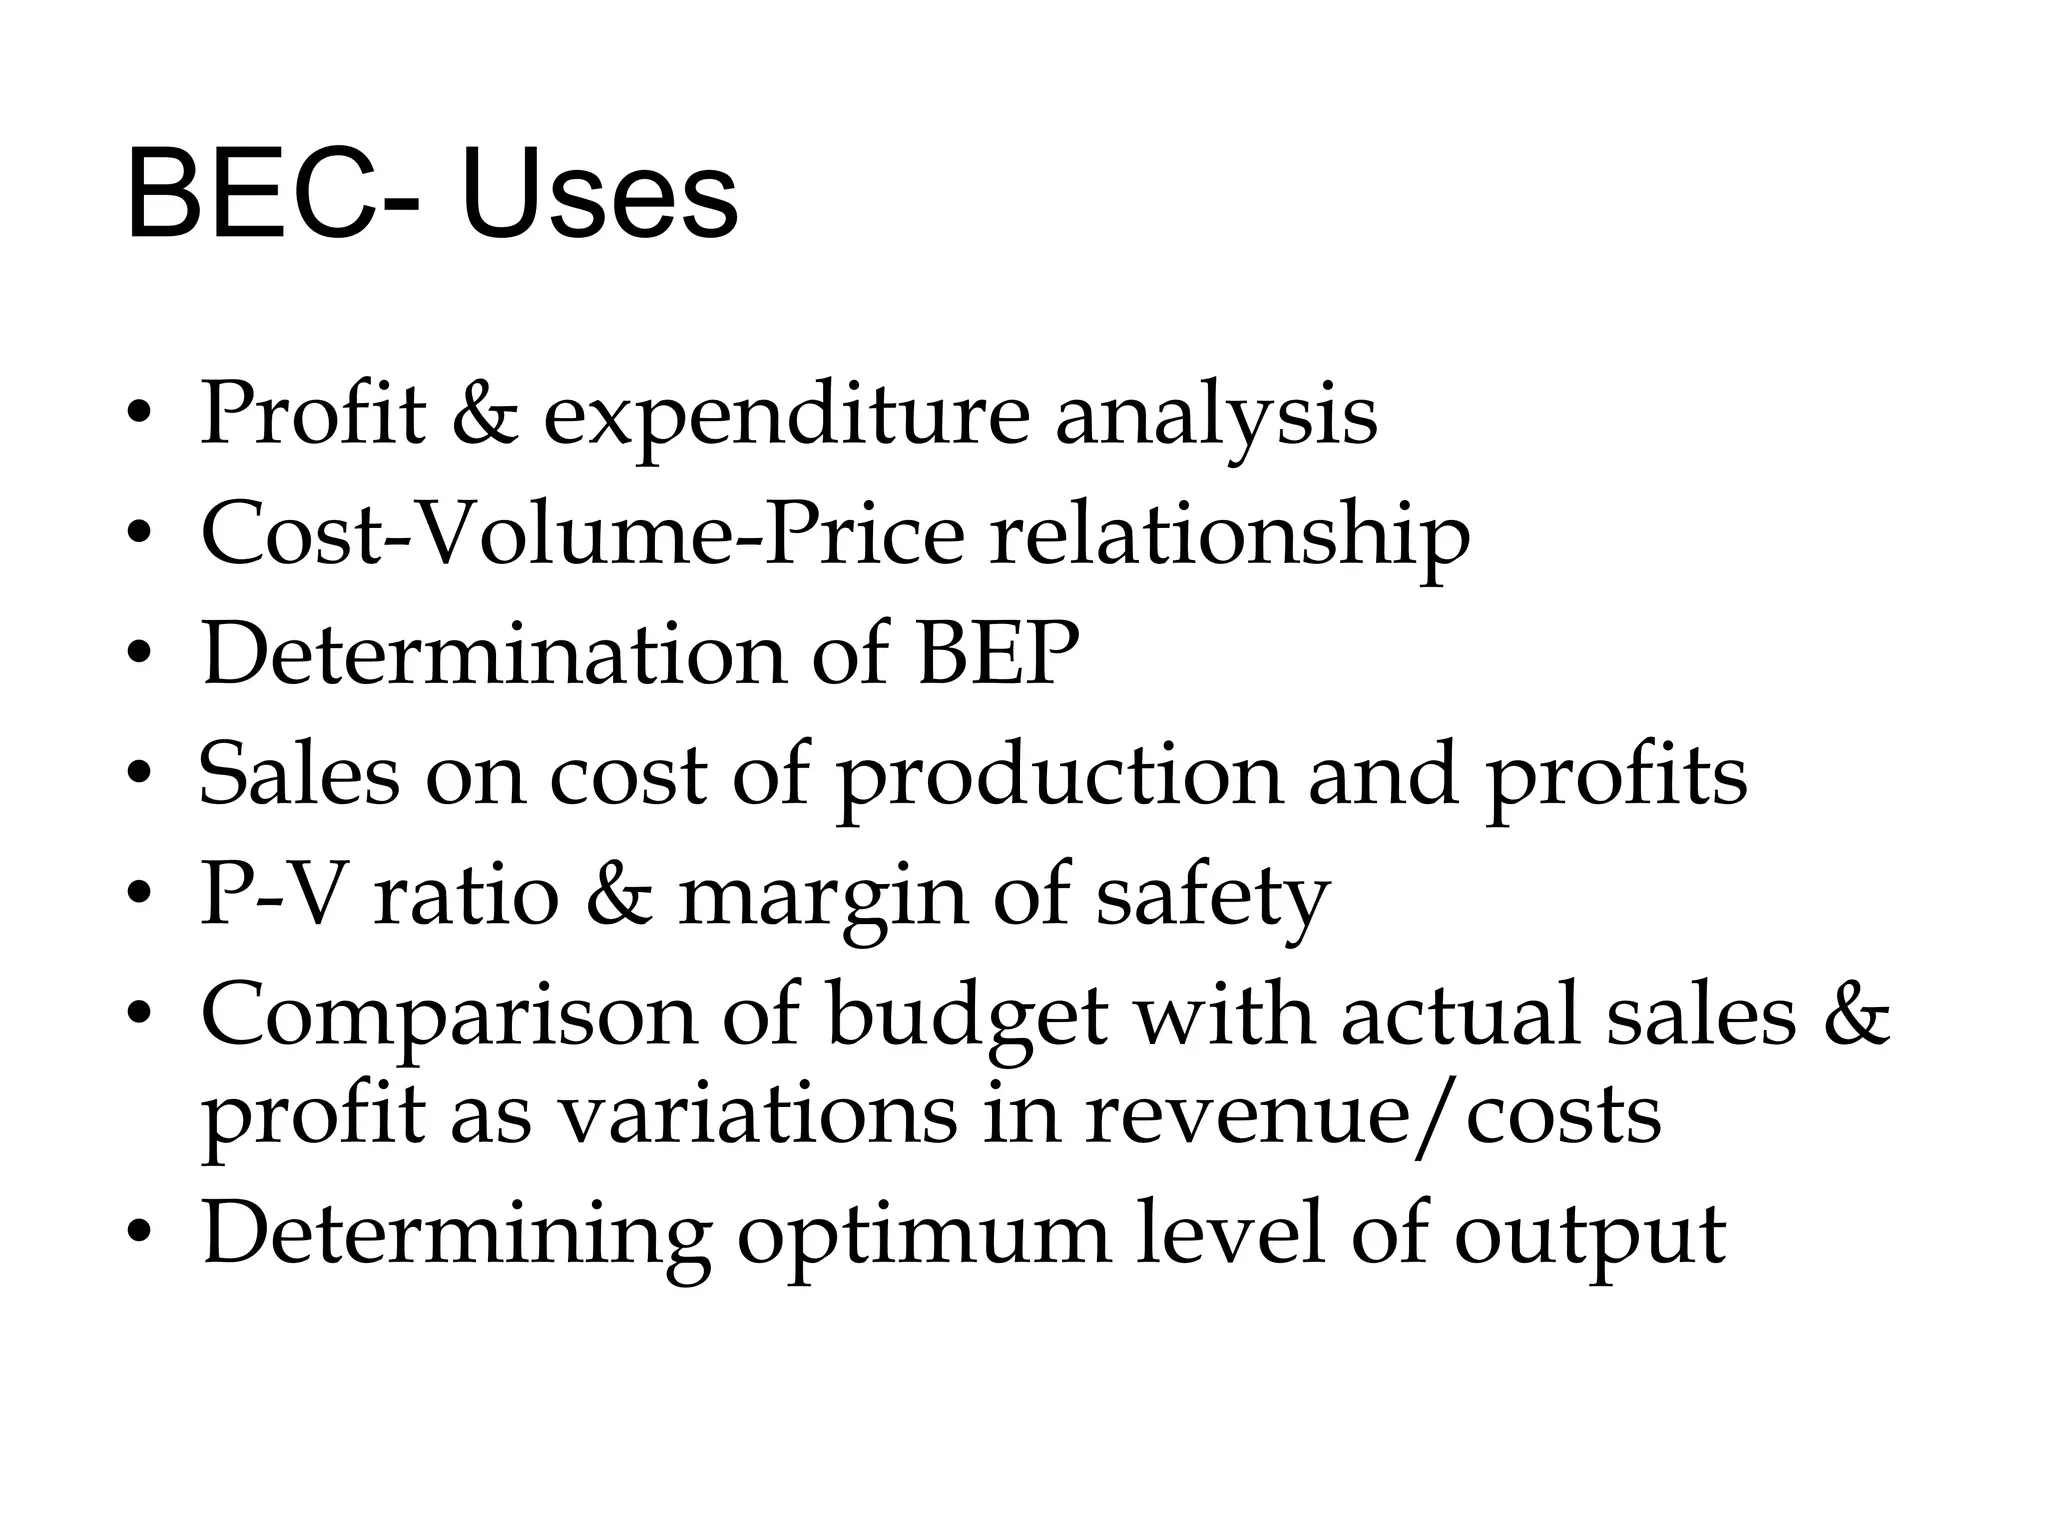
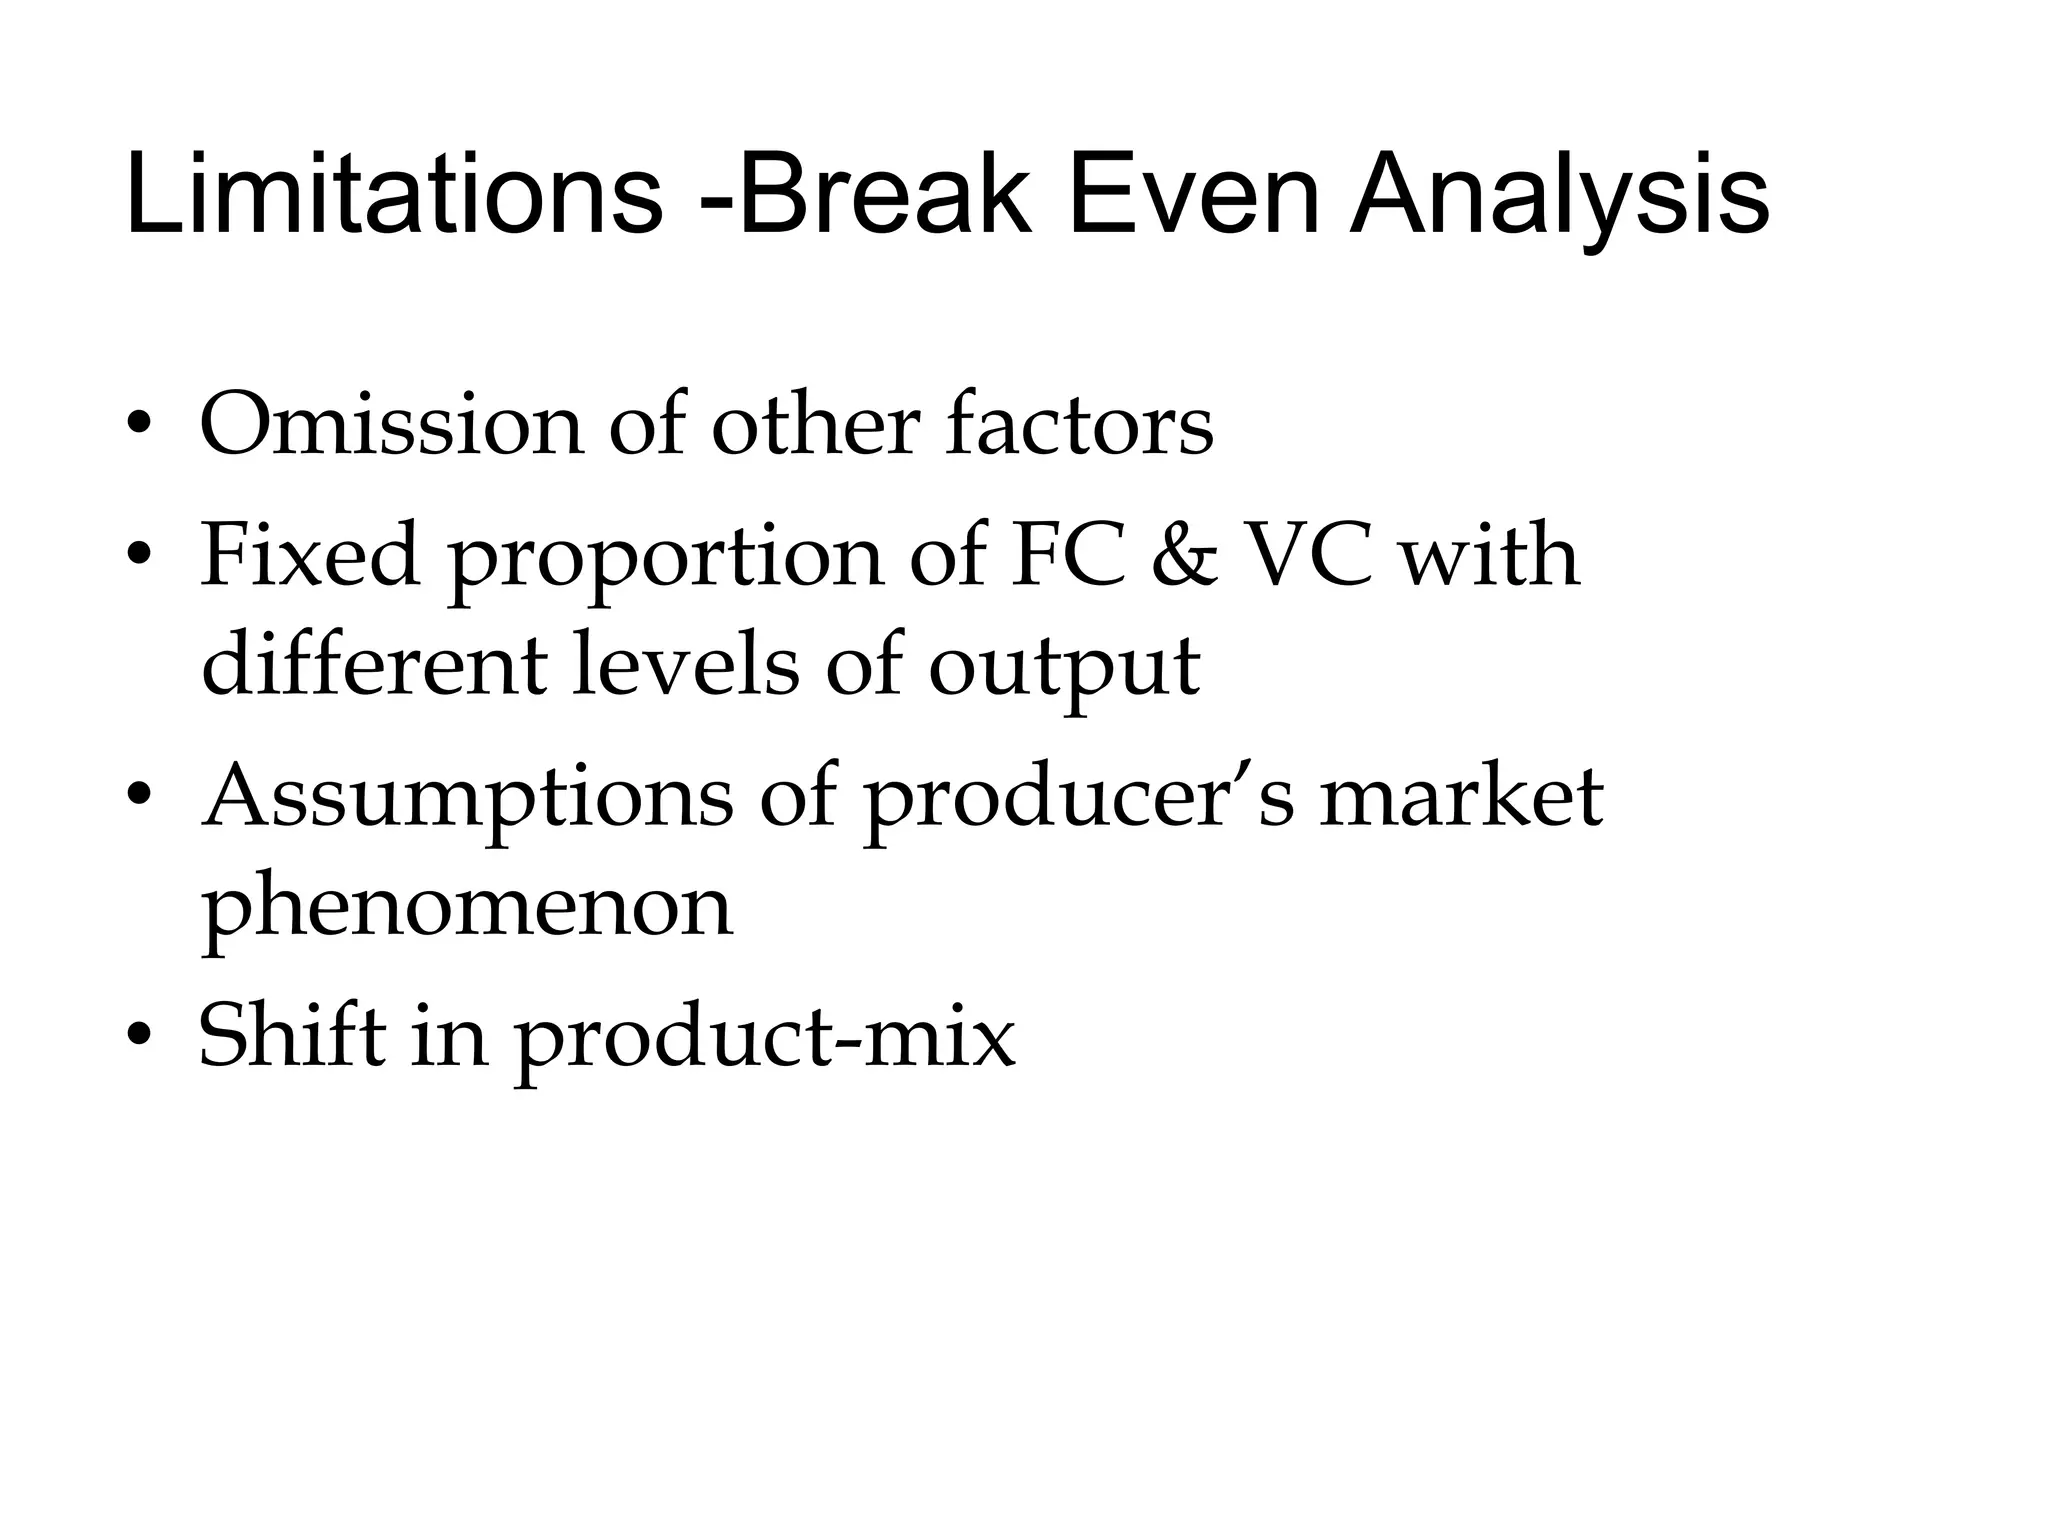
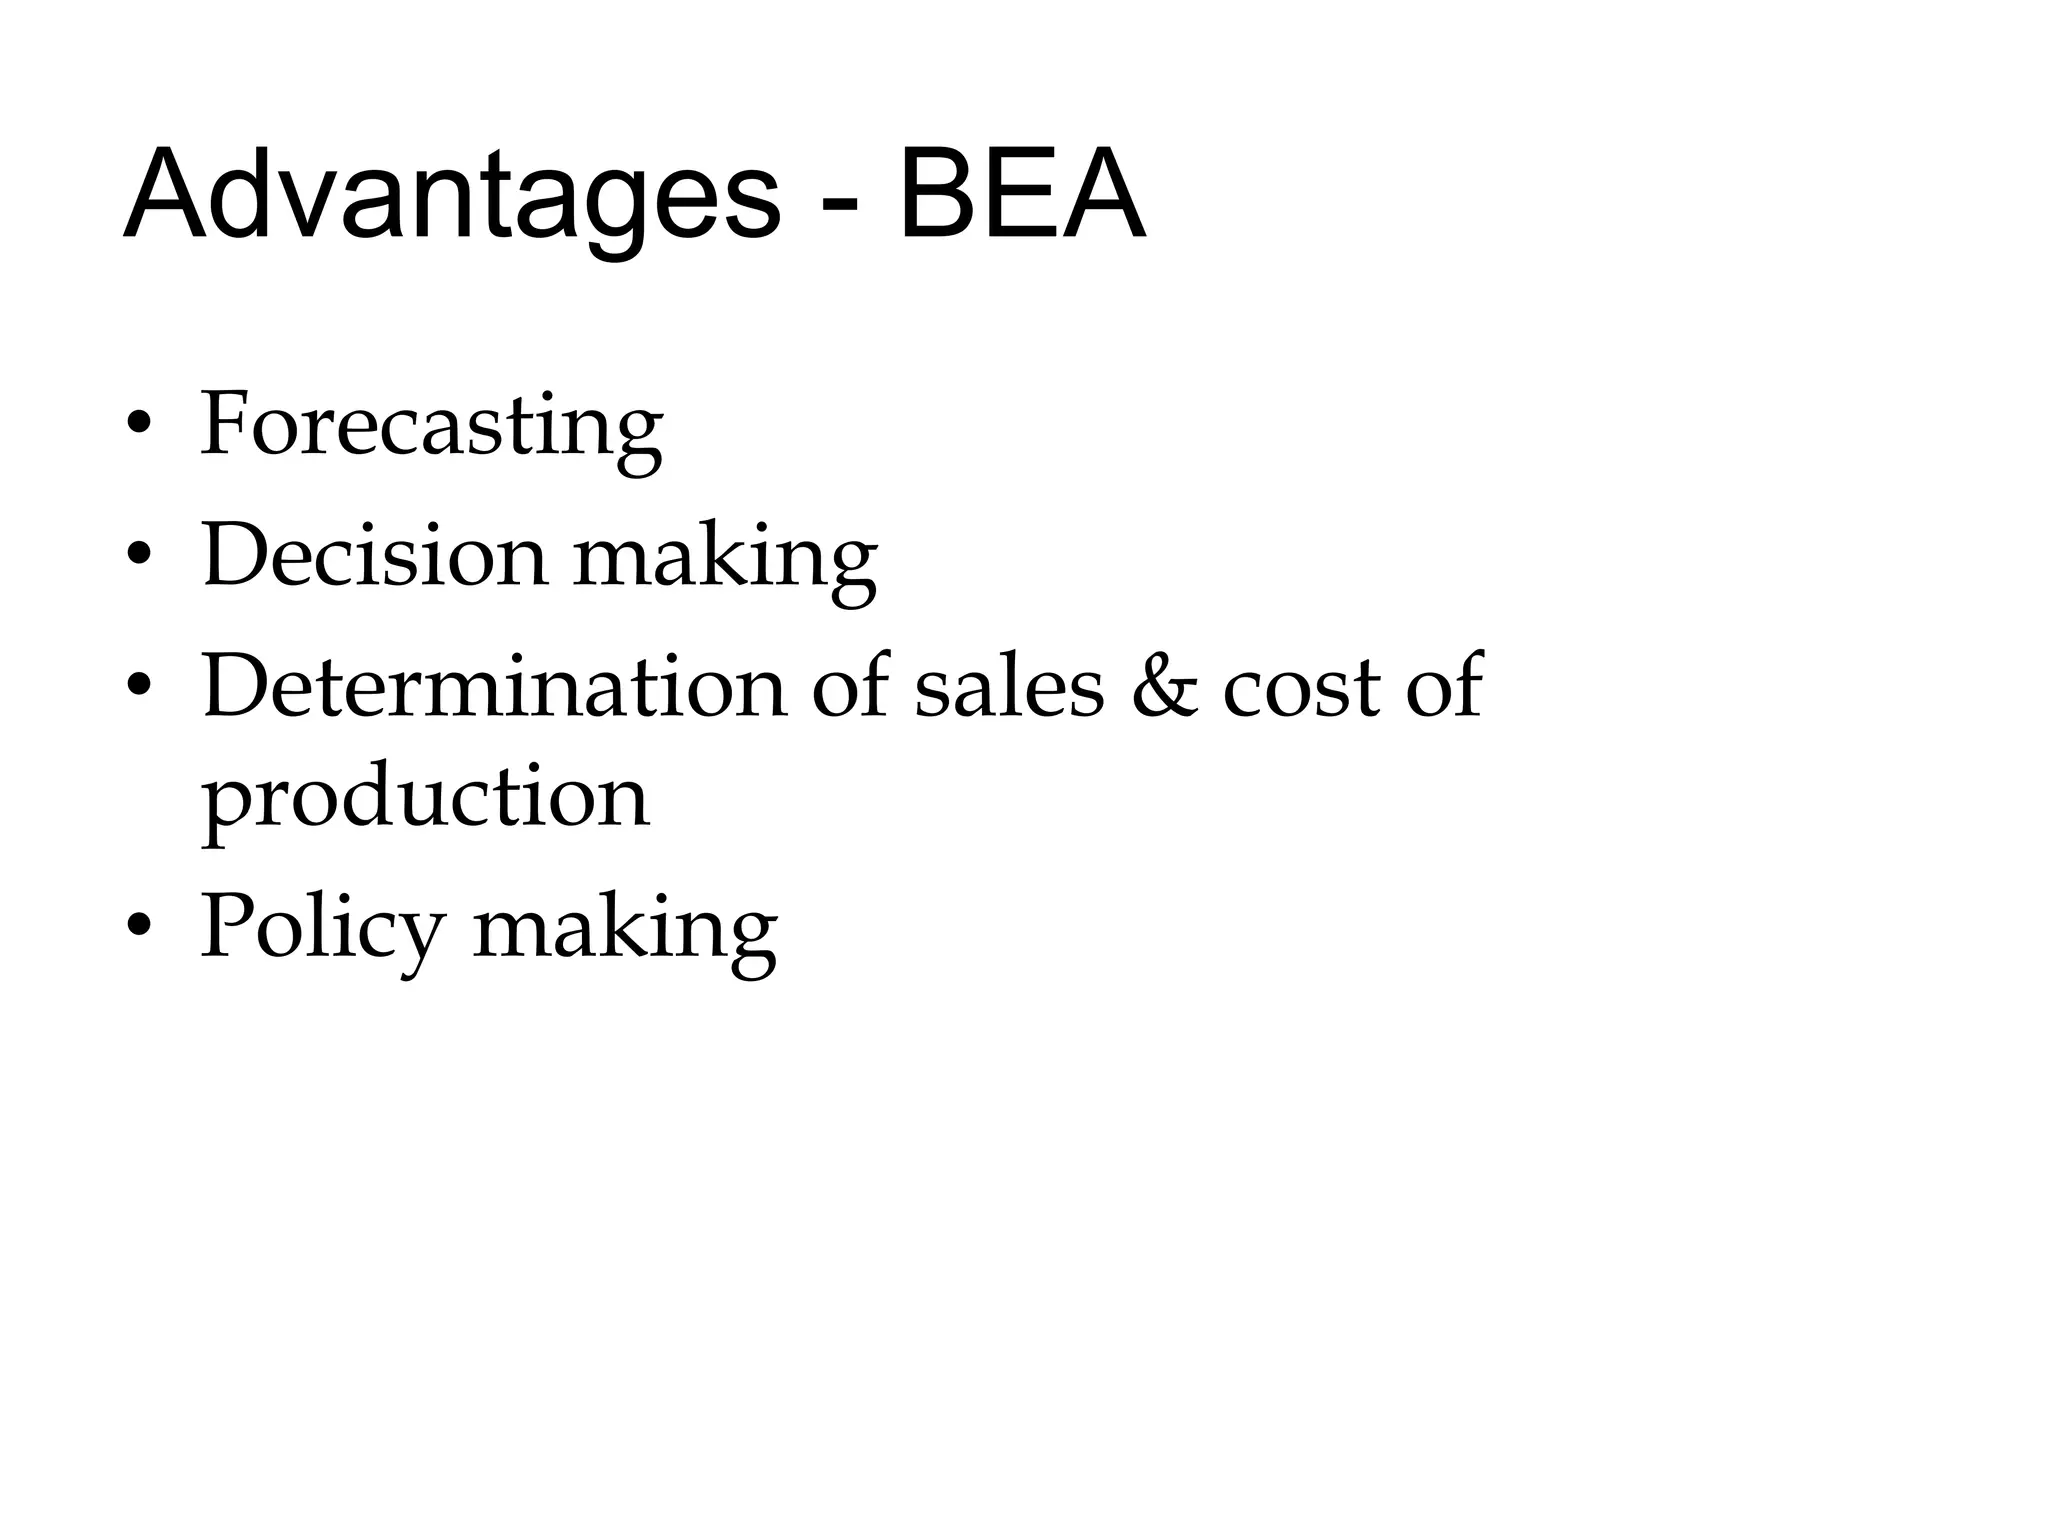
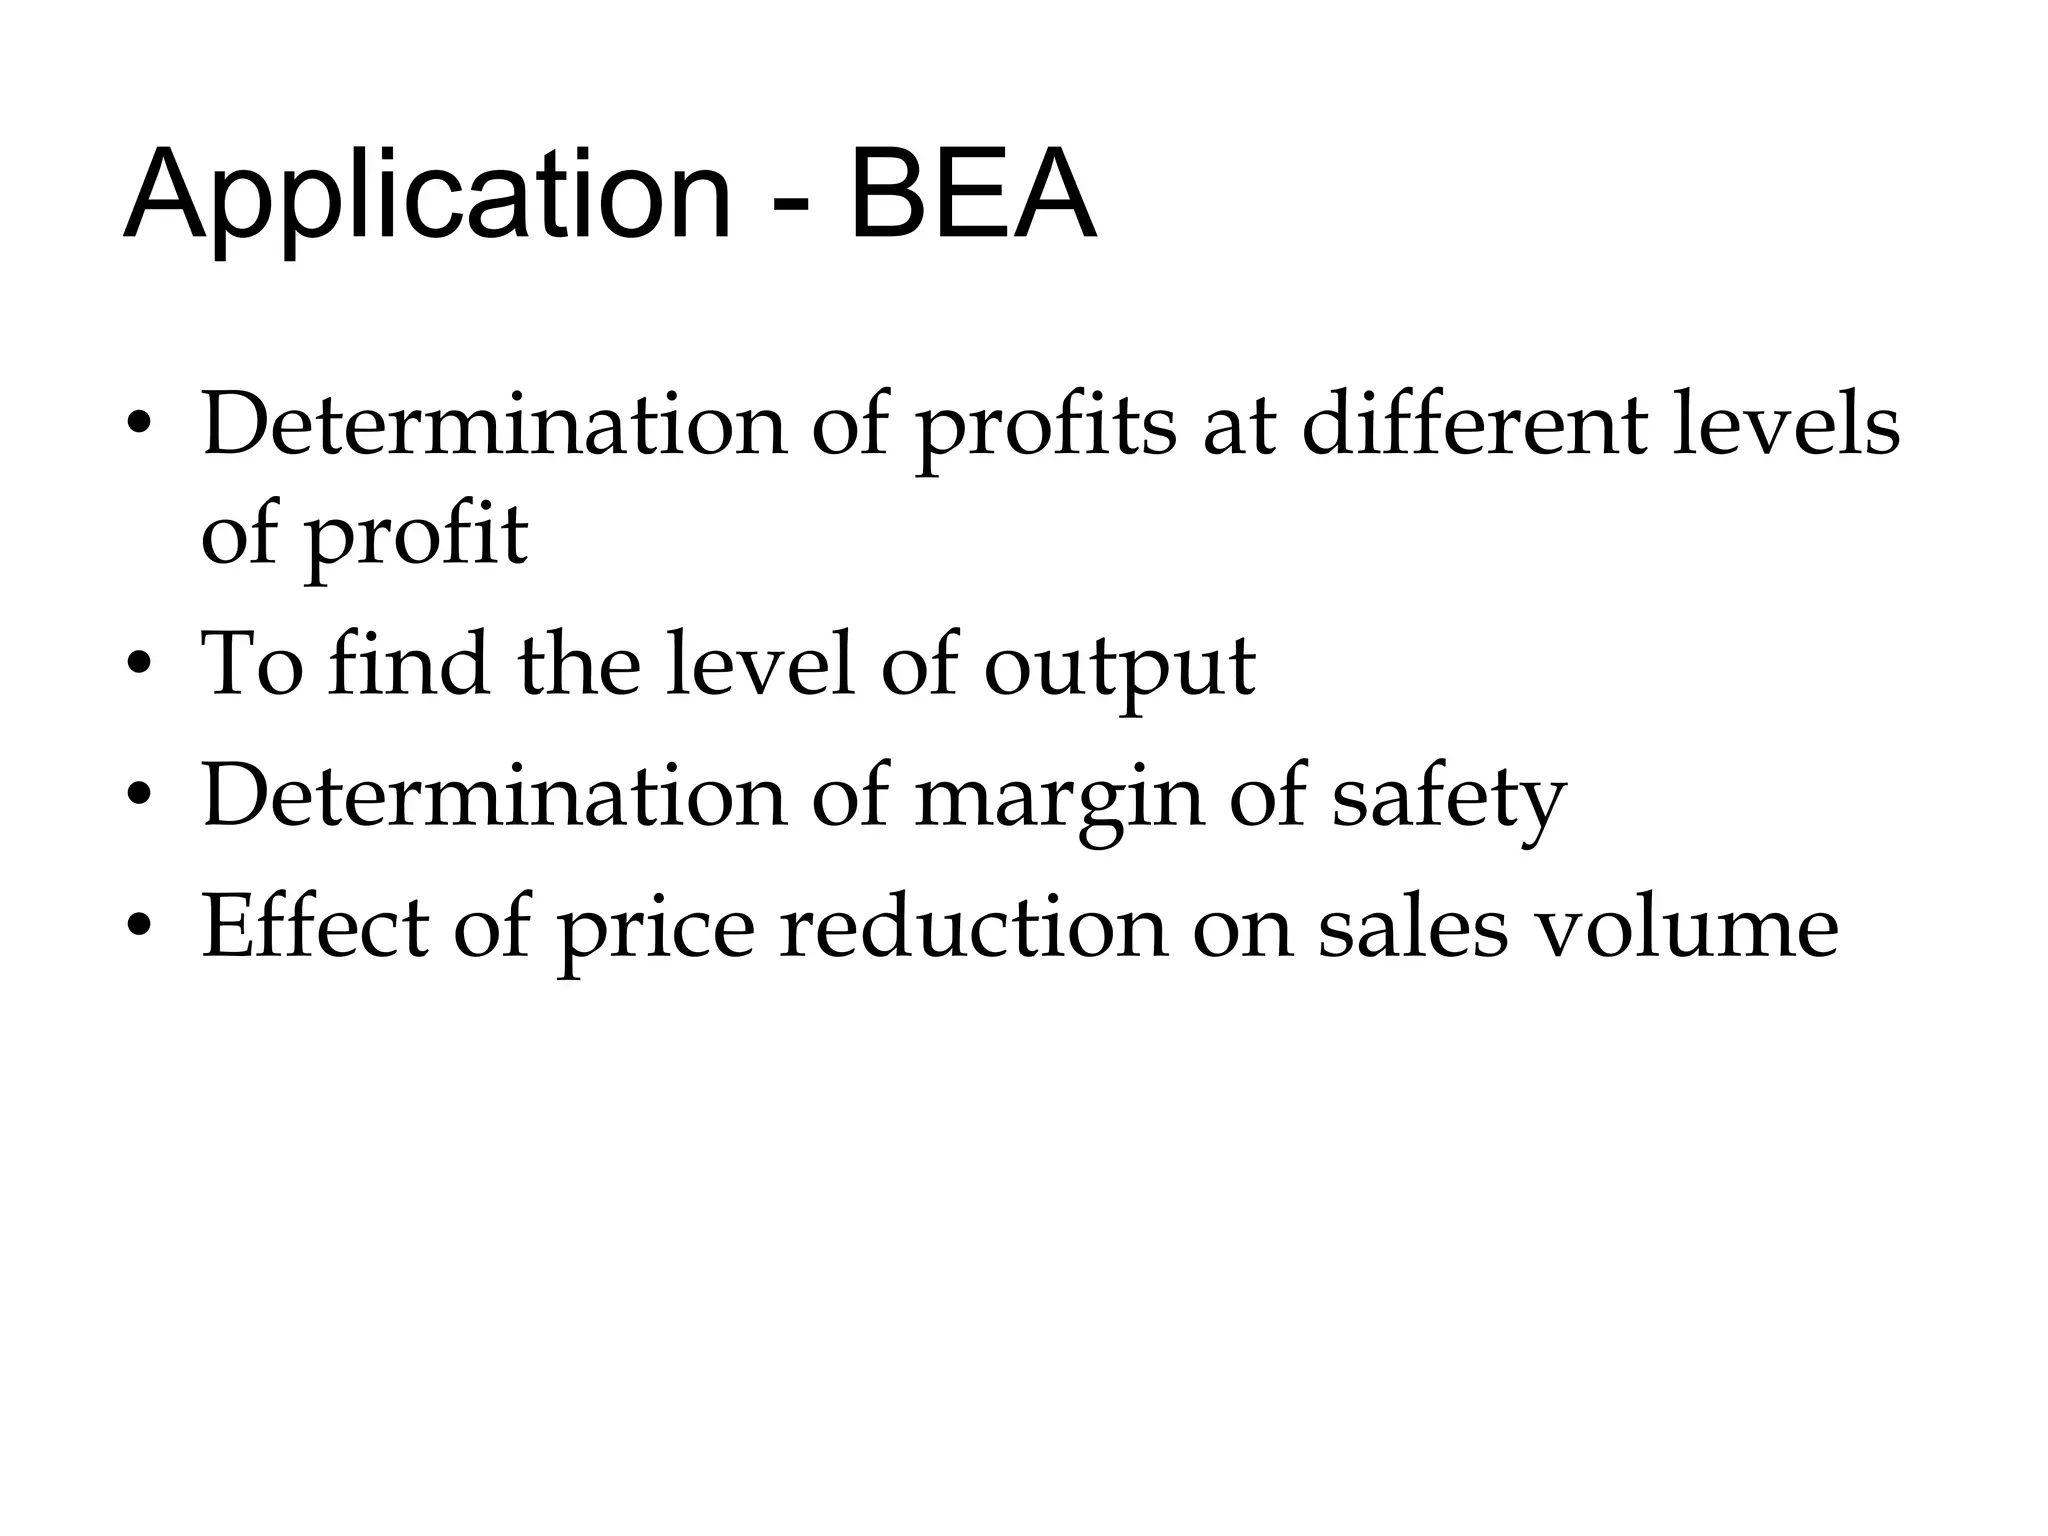
Break-even analysis determines the level of output where costs and revenues are equal. It makes assumptions like constant prices and linear cost relationships. The break-even point is where total revenue equals total cost. The margin of safety is the difference between actual/budgeted sales and break-even sales. The profit-volume ratio measures contribution and is used to determine the most profitable areas. Break-even analysis can be shown graphically and is used for profit and cost analysis, determining the break-even point, and setting production levels.
2. BEA - Meaning A break even analysis indicates that at what level of output, cost and revenue are in equilibrium Martz, Curry and Frank significance of having greater productive capacity to lower costs and maximize profits or contribution
3. Assumptions-BEA Two categories of cost - TC & VC Linear relationship between TC & output Price remains constant at different levels of sale Prices of input factors constant Cost is related with Output level Production & Sales are synchronised Product-mix should be stable for multi-product firms
5. Terminology BEP graph showing variation in TC at different levels of output as well variation in TR BEC Sales revenue = Cost Angle of Incidence Point which the total revenue line intersects the total cost line
6. Termin… Margin of Safety Margin of safety = Budgeted sales – Sales at BEP Margin of safety expressed as: Ratio of budgeted sales to sales at BEP Ratio of actual sales to sales at BEP Percentage of budget to BEP Percentage of actual sales at BEP Percentage of difference between actual sales and break even sales to budgeted sales
7. Termin… Margin … Measures for unsatisfactory margin of safety Increase in the sale price Reduction in fixed costs Reduction in variable costs Increase in output Stop production of non-profitable items
8. Termin… Profit-Volume Ratio Contribution of sales Determine most profitable selling area, line of product/method of distribution To determine the real position of profitability Uses Determination of BEP Identify the profit Identify the sales volume
9. Break Even Chart Graphical representation of sales & costs at different levels of output Study the relationship of output & sales to profit
10. BEC- Uses Profit & expenditure analysis Cost-Volume-Price relationship Determination of BEP Sales on cost of production and profits P-V ratio & margin of safety Comparison of budget with actual sales & profit as variations in revenue/costs Determining optimum level of output
11. Limitations -Break Even Analysis Omission of other factors Fixed proportion of FC & VC with different levels of output Assumptions of producer’s market phenomenon Shift in product-mix
12. Advantages - BEA Forecasting Decision making Determination of sales & cost of production Policy making
13. Application - BEA Determination of profits at different levels of profit To find the level of output Determination of margin of safety Effect of price reduction on sales volume