
Recommended
More Related Content
What's hot
What's hot (20)
Similar to ,Exit Exam Tutorial -Traffic Engineering.pdf
Similar to ,Exit Exam Tutorial -Traffic Engineering.pdf (20)
More from sandipanpaul16
More from sandipanpaul16 (20)
Recently uploaded
Recently uploaded (20)
,Exit Exam Tutorial -Traffic Engineering.pdf
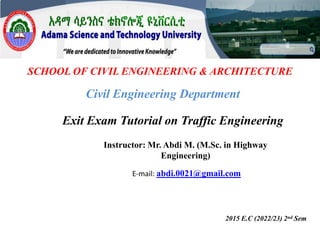
- 1. SCHOOL OF CIVIL ENGINEERING & ARCHITECTURE Exit Exam Tutorial on Traffic Engineering 2015 E.C (2022/23) 2nd Sem Civil Engineering Department Instructor: Mr. Abdi M. (M.Sc. in Highway Engineering) E-mail: abdi.0021@gmail.com
- 2. Part I: Traffic Engineering studies ➢ spot speed studies, volume studies, travel time and delay studies parking studies and road traffic safety. Part II: Fundamental Principles of Traffic flow : ➢Traffic flow elements, and flow-density relationships. Part III: Highway Capacity & Level of service, ➢Capacity of highways and intersections. Part VI: Traffic Operational Flow Analysis Part V: Traffic-control devices and systems: ➢ Traffic signs, pavement markings and islands, and traffic signals. 2 2 11/8/2022 Tutorial Class for Traffic Eng.
- 3. Test Blueprint for BSC in Civil Engineering 11/8/2022 3
- 4. Part I: Traffic Engineering studies 4 Short Notes on ➢ Spot speed studies ➢ Volume studies, ➢ Travel time and delay studies ➢ Parking studies and road traffic safety. Tutorial Questions on ➢ Traffic Engineering studies ASTU Department of Civil Engineering 2015 E.C
- 5. 2 INTRODUCTION The availability of highway transport has provided several advantages. But it also have problems like accident, parking difficulties, congestion and delay. Therefore to reduce the negative impact, it is a must to collect information. Traffic studies grouped into three main categories: Inventories: Provide a list of existing information. Such as:street width,parking space,transit routes,traffic regulations… Administrative studies: Use existing engineering records,available in govt agencies. Such as:result of surveys Dynamic studies: Involve the collection of data under operational condition. Such as:Speed,traffic volume,travel time and delay,parking and accidents. ASTU/Civil Engineering Department
- 6. 3 Spot speed studies Spot speed studies are conducted to estimate the distribution of speeds of vehicles in a stream of traffic at particular location of highway. Speed determined from a spot speed study used to: Establish speed zones Determine whether complaints about speeding are valid Establish passing and no-passing zone Design geometric alignment Analyze accident data Evaluate the effect of physical improvement Determine the effect of speed enforcement program and speed control measures. Determine speed trends ASTU/Civil Engineering Department
- 7. 4 Spot speed studies…cont. Location for spot speed studies: The location for spot speed studies depends on the anticipated use of the result Locations that represent different traffic condition Midblock of urban highways and straight Any location may be used for the solution of a specific traffic engineering problem The data should not be biased The drivers be unaware Time of day and Duration of spot speed studies: Time of the day:Depends on the purpose of the study Duration of the study: The minimum number of vehicle speeds required for statistical analysis is recorded. ASTU/Civil Engineering Department
- 8. 5 Spot speed studies…cont. Definition of some important terms: Average speed or Time Mean Speed: is the arithmetic mean of all observed vehicle speed. Where: u= average speed, ui=speed the ith vehicle, N=number of observation Median speed:is the speed at the middle value in series of spot speeds that are arranged in ascending order. Modal speed: is the speed value that occurs most frequently in a sample of spot speeds. ASTU/Civil Engineering Department
- 9. 6 Spot speed studies…cont. The ith-percentile spot speed: is the speed value below w/c i percent of the vehicles travel. Pace: is the range of speed usually at 10mph interval that has the greatest number of observations. Example: 30-40mph, 40-50mph and 50-60mph; the pace is 40- 50mph if the range has highest number. Space mean speed: is a measure of the speed of travel over a measured distance rather than at a single location Where: V=the space mean speed, n the number of vehicle, l=length of road length,ti=travel time for i vehicle. ASTU/Civil Engineering Department
- 10. 7 Spot speed studies…cont. Standard deviation of speed: is a measure of the spread of individual speed. where: S= Standard deviation, u=arithmetic mean, uj=speed for jth observation,N= number of observation Sample size for spot speed studies ASTU/Civil Engineering Department
- 11. 8 Spot speed studies…cont. Method for conducting Spot speed studies Generally divided into two main categories Manual andAutomatic These automatic devices can be grouped into three main categories: Road detectors Doppler-Principle mater Principles of electronics ASTU/Civil Engineering Department
- 12. 9 Spot speed studies…cont. Road detectors: Can be pneumatic road tube and induction loop. Used to collect both speed and volume data. Advantage:Reduce human errors Disadvantage: Expansive and When pneumatic tubes used the driver may notice it and results behavioral change Doppler-principle Meter: The difference b/n the frequency of the transmitted signal--- and that of the reflected signal…convert speed in mph.(Radar) Advantage:influence on driver is reduced if only it is out of the sight Electronic-principle detectors: Use electronic means and the information is used to determine the speed,volume,queues… Example:video image processing (Camera) ASTU/Civil Engineering Department
- 13. Volume studies Traffic volume studies are conducted to collect data on the number of vehicles/pedestrians that pass a point on a highway facility during a specified time period. Time varies from 15min to as much as year The data collected is putted in subclass: 10 Directional movement Occupancy rates Vehicle classification Pedestrian age AASTU/Civil Engineering Department
- 14. Volume studies…cont. Average Annual Daily Traffic (AADT) Is the average of 24hr counts collected every day of the year. Estimation of highway user revenues Development of freeway and major arterial street systems Average Daily Traffic (ADT) Is the average of 24hr count collected over a number of days greater than one but less than year. Measuring of current demand Evaluation of exiting traffic flow Peak HourVolume (PHV) Is the max no of vehicle that pass a point on a highway during 60min. Design of no of lane,intersection signalization Development of Parking regulation Vehicle classification (VC) 11 Recording volume with respect to type of vehicles: Passenger car,two axle trucks,or three axle trucks ASTU/Civil Engineering Department
- 15. 12 AASTU/Civil Engineering Department Volume studies…cont. Method of ConductingVolume Counts Manual Method:Involve one or more person counting Disadvantage: Labor intensive, subjected to human limitation, can’t be used for long counting period Automatic Method: Involve the laying surface detectors(pneumatic) or subsurface detectors (electronic contact) on the road.
- 16. Volume studies…cont. Type of volume Counts: Cordon count: When information is required on vehicle accumulation within an area. The area is known as Cordon area Example:Central business districts 13 Intersection of each street crossing the cordon line is counting station Information Used:Parking facility,updating and evaluating traffic operation techniques ASTU/Civil Engineering Department
- 17. 14 ASTU/Civil Engineering Department Volume studies…cont. Screen Line Counts: The study area is divided into large sections by running imaginary lines known as screen lines. The screen lines nay be natural or man made barriers Information used: Detect the variations in traffic volume and traffic flow due to the change in the land use Intersection Counts: Are taken to determine through movement and turning movement. Information used: Determining phase length and cycle time and design of channelization at intersection ReadingAssignment:Pedestrian and PeriodicVolume count.
- 18. Travel time and delay studies A travel time study determines the amount of time required to travel from one point to another on a given route The data's are used to identify problems then to improve overall flow of traffic on the route. Applications: 15 Efficiency of route or ability carry traffic Identification of locations with high delay and causes Performance of before and after the studies Determination of relative efficiency of route In trip assignment models Level of service of the route AASTU/Civil Engineering Department
- 19. Travel time and delay studies…cont. Definition of terms related to time & delay studies: 16 Travel time is the taken by a vehicles to traverse a given section of a highway Running time is the time a vehicle is actually in motion while traversing a given section of highway Delay is the time lost by a vehicle due to causes beyond the control of the driver. Operational delay is part of delay caused by the impedance of other traffic.( parking or unparking) Stopped-time delay is that part of delay w/c the vehicle is at rest. Fixed delay is part of delay caused by control devices such as traffic signals. Travel-time delay is the difference b/n the actual travel time and the time that will take if the vehicle travel at average speed. AASTU/Civil Engineering Department
- 20. Travel time and delay studies…cont. Methods for conductingTravel time and Delay studies Those using a test vehicle Those not required test vehicle Method required test vehicle: Floating car The test car is driven by observer along the test section so that the test car“floats”. The min number of test runs must be determined using T- distribution Average speedTechnique 17 Involves driving the test car along the length of the test section at a speed that, in the opinion of the driver, is the average speed of traffic stream AASTU/Civil Engineering Department
- 21. 18 ASTU/Civil Engineering Department Travel time and delay studies…cont. Moving vehicleTechnique The observer makes a round trip on a test section. The time it takes to travel from X-X toY-Y (Te) in min. The time it takes to travel fromY-Y to X-X(Tw) in min The number of vehicles traveling west in the opposite lane while the test car is traveling east (Ne) The number of vehicles that overtake the test car while it is traveling from Y-Y to X-X that is, traveling in the westbound direction (Ow) The number of vehicles that the test car passes while it is traveling from Y-Y to X-X that is, traveling in the westbound direction (Pw)
- 22. Travel time and delay studies…cont. Method Not requiringTest vehicle: License plate method Observers be positioned at beginning and end of the test section. Interviews 19 Is carried out by obtaining information from people who drive on the study site regarding their travel time,delays… ASTU/Civil Engineering Department
- 23. Parking Studies Types of parking facilities On street and off street On-street parking Facilities: Parking bays are provided alongside the curb on one or both sides of the street. Unrestricted parking: duration of parking is unlimited and parking is free Restricted parking: limited to specific times of the day for the max duration and may be free or not. Off-street Parking Facilities: 20 These facilities may be privately or publicly owned. Include surface lots and garages Self or attendant parking AASTU/Civil Engineering Department
- 24. Parking Studies…cont. Definition of ParkingTerms: 21 A space-hour: is a unit of parking that defines the use of single parking space for a period of 1hr. Parking volume: is the total number of vehicle that park in a study area during a specific length of time usually a day. Parking accumulation: is the number of parked vehicle in a study area at any specified time. The parking load: is the area under the accumulation curve b/n two specific times. Parking duration: is the length of time a vehicle is parked at a parking bay. Parking turnover:is the rate of use of a parking space. ASTU/Civil Engineering Department
- 25. Parking Studies…cont. Method of parking studies Parking studies involves: Inventory of existing parking facilities Collection of data parking:accumulation,turnover and duration. Identification of parking generators and Collecting information on parking demand. Analysis of parking Data Includes summarizing, coding and interpreting the data for decision-making process. 22 Number and duration for vehicles legally parked Number and duration for vehicles illegally parked Space-hours of demand for parking Supply of parking facilities. ASTU/Civil Engineering Department
- 26. Parking Studies…cont. Space-hours of demand: Where: 23 D=space vehicle-hours demand for a specific of time N=number of parking space available ti=mid parking duration of the ith class ni=number of vehicles parked for the ith duration ASTU/Civil Engineering Department
- 27. Parking Studies…cont. Space-hour of supply: Where: S=practical number of space-hour of supply for a specific period of time N=number of parking space available ti=total length of time in hours when the ith space can be legally parking on during the specific period f=efficiency factor Efficiency factor is used a correct for time lost in each turnover. Curb parking:78-96% 24 Surface lots & Garages:75-92% Average:Curb parking:90% and Surface lots:85% and Garages:80% ASTU/Civil Engineering Department
- 28. 25 ASTU/Civil Engineering Department Tutorial Questions Q1. Which of the following is not a category of Traffic Studies? a) Dynamic studies b) Inventories c) Economic studies d) Administrative studies Answer: c Explanation: Traffic Studies is categorized into three main categories- Inventories, Administrative studies, and Dynamic studies.
- 29. Tutorial Questions……..cont. Q2. What is the first stage in traffic engineering studies? a) Traffic volume studies b) Spot speed studies c) Speed and delay studies d) Origin and destination studies Answer: a Explanation: The first step in traffic engineering studies is traffic volume studies, which are carried out to understand the traffic characteristics.
- 30. Tutorial Questions……..cont. Q3. The number of vehicles crossing a section of road in a unit time at any selected period is called a) Traffic volume study b) Traffic flow c) Traffic origin d) Traffic destination • Answer: a Explanation: The number of vehicles crossing a section of road in a unit time at any selected period is called Traffic volume study. Its unit is vehicles/hr or vehicles/day.
- 31. Tutorial Questions……..cont. Q4. Which of the following method is more accurate for traffic analysis? a) Manual count b) Automatic count c) Average of manual and automatic d) Past records Answer: b Explanation: The automatic count is more accurate as it is done for 24 hours by machine; it is more reliable than manual counting.
- 32. Tutorial Questions……..cont. Q5. If the traffic volume count on a road is 150 and daily factor is 1.1 and seasonal factor is 1.2 then ADT is a) 196 b) 197 c) 198 d) 199 • Answer: c Explanation: ADT= Traffic volume*D.F*S.F =150*1.1*1.2 =198.
- 36. Tutorial Questions……..cont. Q7. _____ is a part of delay caused by control devices like traffic signal. a) Operational delay b) Stopped-time delay c) Fixed delay d) Travel time delay
- 38. Part II: Fundamental Principles of Traffic flow 38 Short Notes on ➢Traffic flow elements ➢Flow-density relationships ➢Fundamental diagram of traffic flow ➢Mathematical relationships describing traffic flow Tutorial Questions on ➢ Fundamental principles of traffic flow ASTU Department of Civil Engineering 2015 E.C
- 39. Fundamental Principle of Traffic Flow 2 Traffic flow theory is a tool that helps The transportation engineers to understand & express the properties of traffic flow To know vehicles interaction with each other & with roadways Evaluation of traffic flow helps for Evaluating the capacity of the existing roadways and Designing of new roadways Parameters associated with the highway effectiveness: The quantity of traffic The type of vehicles within the traffic stream The distribution of flow over a period of time (usually 24 hours) The average speed of the traffic stream The density of the traffic flow. ASTU/ Civil Engineering Dept. 39 11/8/2022
- 40. Trafficflow theory isa complex matter Cooperation between: 🞑 Vehicle 🞑 Road 🞑 Driver 6 Driver E very vehicle iscontrolled by a driver who makes individual choices how to control the vehicle The driver isthe main reason why traffic flow issuch a complex matter
- 41. Categories of Traffic Flow Uninterrupted flow:Occurs on facilities that have no fixed element such as traffic signal, external traffic stream w/c cause interruption to the flow. Freeways Multilane highways Interrupted flow:occurs on transportation facilities that have fixed elements causing periodic interruptions to the flow.Such as traffic signals,stop signs… 14 Signalized streets Unsignalized intersections with stop signs Pedestrian walkway ASTU/Civil Engineering Dept.41 11/8/2022
- 42. Traffic Stream Characteristics Traffic Flow and Water Flow ?
- 43. Traffic Stream Parameters • Macroscopic describe the traffic stream as a whole. Traffic stream may be described macroscopically by these parameters: – Volume or rate of flow – Speed – Density
- 44. Traffic Stream Parameters • Microscopic describe the behavior of individual vehicles or pairs of vehicles within the traffic stream. Traffic stream may be described microscopically by these parameters: - The speed of individual vehicles - Headway - Spacing
- 45. Traffic flow Elements 3 ASTU/ Civil Engineering Dept. Functional effectiveness of highway can be measured by its ability to accommodate as much traffic as possible, subjected to safety and environmental constraints. Fundamental parameters used to characterize flow of traffic in a roadway are: Flow rate Density Speed 45 11/8/2022
- 46. 4 Traffic flow Elements….cont Flow (q): number of vehicles passing a point in a road/lane in an interval of time (measure of quantity) q = n/t Expressed by vehicle/unit time Where; The traffic flow,q,a measure of the volume of traffic on a highway,is defined as The number of vehicles,n,passing some given point on the highway The time interval,t, ASTU/Civil Engineering Dept.46 11/8/2022
- 47. T rafficflow Ona two-lane roadwe consider: 🞑 total traffic in both directions 🞑 directional distribution (e.g 60/40) Onm ultilane roads: 🞑 each direction is considered individually At a junction: 🞑 trafficvolume isdefined asthe total number of vehicleswhichenter the junction 🞑 if the vehicles leaving the junction were included, all the vehicleswould have been 11
- 48. Heavy vehiclesandpassengercarunits(pcu) Theproportion of heavy vehicles is calculated as a percentage of the total traffic However,automaticclassifying systemsare usually using vehicle length instead of vehicle weight (it is easier to measure length than weight of moving vehicles) Heavy vehicles and passenger cars have very different characteristics For evaluation of traffic flow, the traffic volume should be convertedfromvehicles(veh) to passengercar units(pcu) Equivalent factors are used for each vehicle type, for example 1 passenger car = 1.0 pcu 1 motorcycle = 0.5 pcu 1 bus= 2.0 pcu 1 lorry = 2.5 pcu 1 2
- 49. Daily VolumeP arameters 1 3 Establish trends over time & usedfor general planning purposes 🞑 Averageannualdailytraffic(AADT)– numberof vehicles ina year divided by 365 🞑 Average annual weekday traffic(AAWT) – number of vehicles on weekdays in a year divided by number of weekdays (260) 🞑 Averagedailytraffic(ADT)– average 24-hr volume over a defined timeperiod lessthana year (commonlyfor each month) 🞑 Averageweekdaytraffic(AWT)– theaverage 24-hr weekday volumeover a defined time period lessthan
- 51. Hourly VolumeP arameters For design and operational purposes P eriod of maximumflow during “rush hours” P eakhour – single hour of the day with the highest hourly volume 🞑 Generally stated asdirectional volum e (each direction separately) 🞑 Highwaysand controlsare designed for peak hour for each direction of flow 1 5
- 52. 2/14/2019 PEAK-HOUR FACTOR Peak flow rates and hourly volumes produce the peak-hour factor (PHF), the ratio of total hourly volume to the peak flow rate within the hour, computed by Equation: * If 15-min periods are used, the PHF may be computed by Equation Where: PHF = peak- hour factor V = hourly volume (v/h) and V15 = volume during the peak 15 min of the peak hour(v/15 min). 57 52 11/8/2022
- 53. 5 Traffic flow Elements…cont. Density (k): Is defined as the number of vehicles (pedestrians) occupying a given length of a lane or roadway at a particular instant K = n/L Expressed by vehicle/km,vehicle/mile Where: the traffic density,k, the number of vehicles,n, occupying a length of roadway..L ASTU/Civil Engineering Dept.53 11/8/2022
- 54. 6 ASTU/Civil Engineering Dept. Traffic flow Elements…cont. Speed (u): Is the distance covered by vehicle in unit of time Due to vehicle- vehicle or vehicle – roadway interactions, vehicles will not have similar speed in a given traffic stream Average or mean speed is a significant variable for traffic flow analysis Different types of average values of speed are used to characterize a traffic stream. time mean speed space mean speed 54 11/8/2022
- 55. i n 7 ASTU/Civil Engineering Dept. Traffic flow Elements…cont. Time mean speed vehicles observed This is the arithmetic average of speeds of passing a point on a highway. Space Mean Speed vs = SMS is the average speed of vehicles measured at an instant of time over a specified stretch of road.SMS is the harmonic mean of all speeds. Used in traffic models,but harder to measure. L ti = = L t nL ti i 55 11/8/2022
- 56. qk = = = =u 8 Traffic flow Elements…cont. The three parameters u,k and q are directly related under stable traffic conditions as follows n n n l l t l t n t q=ku Equation (a) ASTU/Civil Engineering Dept. 56 11/8/2022
- 57. 9 Traffic flow Elements…cont. In addition to the above parameters,the following parameters are also important in the study of traffic flow Volume - the total number of vehicles that pass over a given point or section of a lane or roadway during a given time interval; volumes may be expressed in terms of annual,daily,hourly,or sub-hourly periods. Peak Hour Factor (PHF) –is the ratio of the hourly flow rate (q60) divided by the peak 15 minute rate of flow expressed as an hourly flow (q15) ASTU/Civil Engineering Dept.57 11/8/2022
- 58. 1 0 Traffic flow Elements…cont. Headway (h) – is the time that elapses between the arrival of the leading vehicle and the following vehicle at a designated test point. T=3 sec ASTU/Civil Engineering Dept. 58 11/8/2022
- 59. 1 1 Traffic flow Elements…cont. Spacing (s) – is the physical distance between the front bumper of the leading vehicle and the front bumper of the following vehicle Spacing(s) ASTU/Civil Engineering Dept. 59 11/8/2022
- 60. 1 2 ASTU/Civil Engineering Dept. Traffic flow Elements…cont. Clearance (c) – is the distance between the rear bumper of the leading vehicle & the front bumper of the following vehicle Is equivalent to the spacing minus the length of the leading vehicle Gap (g) – is the measure of the time that elapses between the departure of the first vehicle and the arrival of the second vehicle at the designated test point Clearance (m) or Gap (sec) 60 11/8/2022
- 61. Traffic flow Elements…cont. Clearance (m) or Gap (sec) Spacing (m) or headway (sec) cavg = gavg *vavg 1 3 Savg =havg*vavg ASTU/Civil Engineering Dept. gavg = havg − Lavg vavg 61 11/8/2022
- 62. 11/8/2022 62
- 63. 11/8/2022 63
- 64. Analysis of Speed, Flow and Density Relationship Speed- Density Relationship 15 Consider a single car traveling along a highway By definition density will tend to zero The speed at which the car can be driven is determined solely by the geometric design & layout of the road The speed @ which the density is near to zero (0) is defined as Free flow speed (uf). uf not hindered by the presence of other vehicles As more vehicles use the section of the highway,density increases & speed decreases from its maximum free flow value If the above condition persists,a point is reached where traffic will be brought to a stop.i.e.,u= 0,with the density at its maximum point as cars are jammed bumper to bumper,termed Jam Density (kj) ASTU/Civil Engineering Dept.64 11/8/2022
- 65. Analysis of Speed, Flow and Density Relationship…cont. The limiting values are When k=0,u=uf & when u=0,k=kj Different researchers [Greenshield,Greenberg,& Underwood] had developed different models [linear,logarithmic,& exponential] respectively 16 ASTU/Civil Engine ering Dept. 65 11/8/2022
- 66. Analysis of Speed, Flow and Density Relationship…cont. 17 ASTU/Civil Engineering Dept. Flow- Density Relationship Combining the relations for u & relations between flow, density,and speed gives 66 11/8/2022
- 67. Analysis of Speed, Flow and Density Relationship…cont. 18 ASTU/Civil Engineering Dept. In order to determine the density at which maximum flow occurs,differentiate eqn (c) w.r.t.k 67 11/8/2022
- 68. k = k j (1− q = k j (u − Analysis of Speed, Flow and Density Relationship…cont. 19 ASTU/Civil Engineering Dept. Speed-Flow Relationship Rearranging equ (b) for k and combining it with equ (a) gives u ) uf u2 ) uf 68 11/8/2022
- 69. Analysis of Speed, Flow and Density Relationship…cont. 20 ASTU/Civil Engineering Dept. In order to determine the speed at maximum flow occurs,differentiate eqn (e) w.r.t.u Combining eqn (d) & eqn (f) gives, 69 11/8/2022
- 70. 10/19/2019 40 Parameter Flow Speed Density symbol q v k Typical unit Veh/h Km/h Veh/lane-km Reciprocal Headway Travel time Spacing symbol h T S Typical unit Sec/veh Sec/km m/veh t1 2 2 Headway (h) = t2 – t1 S Headway:is the time interval b/n passage consecutive vehicle measured b/n corresponding point. Spacing:is distance b/n vehicles moving in the same lane measured b/n corresponding point. SUMMARY Three basic traffic stream parameter 70 11/8/2022
- 71. 10/19/2019 52 Low volumes High volumes Highest volumes q=ku Maximum density speeds speed or flow Highest speeds Low Medium density No TRAFFIC FLOW THEORY 71 11/8/2022
- 73. 11/8/2022 73
- 74. 11/8/2022 74
- 75. 11/8/2022 75
- 76. 11/8/2022 76
- 77. 11/8/2022 77
- 78. 25 ASTU/Civil Engineering Department Tutorial Questions Q1. Which of the following is not an application of traffic flow theory? a) to determine adequate lane lengths b) to study the interrelationships of traffic flow elements c) to determine PCU d) to determine the average delay at intersections and freeway ramp merging areas Answer: c Explanation: Determination of PCU is not an application of traffic flow theory. Determination of adequate lane lengths, study of the interrelationships of traffic flow elements, and estimation of delay at intersections are some of the applications of traffic flow theory.
- 79. Tutorial Questions……..cont. Q2. The number of vehicles travelling over a unit length of highway at an instant in time is _____ a) flow b) speed c) density d) acceleration Answer: c Explanation: The number of vehicles travelling over a unit length of highway at an instant in time is density. The unit of density is vehicle/m or vehicle/km. It is usually denoted by k.
- 80. Tutorial Questions……..cont. Q3. The harmonic mean of the speeds of vehicles passing a point on a roadway during an interval of time is known as ______ a) Density b) Flow c) Space mean speed d) Time mean speed Answer: c Explanation: Space mean speed is the harmonic mean of the speeds of vehicles passing a point on a roadway during an interval of time. It is the entire distance travelled by the vehicles divided by the total time required by these vehicles to travel that distance. Space mean speed is involved in flow- density relationships.
- 81. Tutorial Questions……..cont. Q4. On a road the free speed was 65 kmph and the space headway at jam density was 6.25 m. What is the maximum flow which could be expected on this road? A) 2600 vph B) 1625 vph C) 1300 vph D) 406 vph
- 83. Tutorial Questions……..cont. Q5. Assume a road section of 88m long . Four cars are timed through the section. Their times were: 1 , 1 , 2 , and 1.5 sec respectively. What is the TMS & SMS ? A) (47.5, 43.63 )mph B) (48.5, 44.6 )mph C) (57.5, 63.63 )mph D) (37.5, 53.63 )mph
- 84. Tutorial Questions……..cont. SOLUTION TMS: (88/1)+(88/1)+(88/2)+(88/1.5) or individual speeds of 60 mph, 60 mph, 30 mph, and 45 mph TMS = (60+60+30+40)/4 = 47.5 mph SMS: add up the travel times and divide by the number of vehicles. Then divide the length of the section by average time SMS = (4*88) / (1+1+2+1.5) = 43.63 mph vs = = = vs = = = nL ti i
- 85. Tutorial Questions……..cont. Q6. A volume of 1200 VPH is observed at an intersection approach. Find the peak flow rate within the hour for the 0.80 peak –hour factor. A) 4800 vph B) 1500vph C) 2800 vph D) 1200 vph
- 86. Tutorial Questions……..cont. Peak flow rate =1,200 v/0.8 = 1,500 v/h Answer is choice ‘A’
- 87. Tutorial Questions……..cont. Q7. On a road the average headway values was Average ḧ = 4.125 sec. What is the flow which could be expected on this road? A) 873 vph B) 980 vph C) 1073 vph D) 1283 vph
- 88. • Average ḧ = 4.125 sec. • Flow= 1/ḧ = 1/ 4.125= 0.242 v/sec=873 v/h. Tutorial Questions……..cont.
- 89. Tutorial Questions……..cont. Q8. Data obtained from aerial photography showed six vehicles on a 0.187Km long section of road. Traffic data collected at the same time indicated an average time headway of 4 sec. What is the space mean speed? A) 28.05km/hr B) 18.5km/hr C) 10.73 km/hr D) 12.83 km/hr
- 90. Given: h=4 sec/veh,L= 0.187km,n=6 Density (k):= n/L = 6/0.187 = 32.08 veh/km flow (q):= 1/h = ¼sec/veh = 0.25 veh/sec = 0.25*3600 = 900 veh/hr 10/19/2019 51 Space Mean SpeedVs:= q/k =900/32.08 = 28.05km/hr Answer Choice A 90 11/8/2022 Tutorial Questions……..cont.
- 91. Tutorial Questions……..cont. Q9. A study of freeway flow at a particular site has resulted in calibrated speed-density relationship as follow: -Which one of the following graph is the correct flow-density relationship?
- 92. 10/19/2019 58 Free flow speed? When the density (k) approaches to zero,the space mean speed of vehicle will become a free flow speed (uf) vs= 57.5*(1-0.008 k) = 57.5*(1-0.008 k) substituting the value of k = 0, uf = 57.5*(1-0.008*0) uf= 57.5 km/hour Jam concentration (kj)? when the space mean speed vs= 0,the density on the road will become jam density kj vs= 57.5*(1-0.008 k) 0 = 57.5*(1-0.008 kj) 1 - 0.008kj = 0 kj = 125 veh/km 92 11/8/2022 Tutorial Questions……..cont.
- 93. 10/19/2019 59 Relationships q-u? q = vs*k vs= 57.5*(1-0.008 k) Rearranging the above equation and k is vs/57.5 = 1-0.008k 1- vs/57.5=0.008K k = 125 - 0.46 vs , then q = vs*k = vs*(125 - 0.46vs) = 125 vs- 0.46 vs^2 93 11/8/2022 Tutorial Questions……..cont.
- 94. 10/19/2019 60 Relationships q-k? q = vs*k, vs=q/k vs= 57.5*(1-0.008 k), then q/k=57.5*(1-0.008k) q=57.5k -0.46k^2 Qmax capacity? q = 57.5k - 0.46k^2 d(q)/d(k)=0, 57.5-0.92k=0 km=62.5 qmax=1796 veh/hour 94 11/8/2022 Tutorial Questions……..cont.
- 95. Tutorial Questions……..cont. Q10. Consider the four points P, Q, R and S shown below in the Greenshields fundamental speed flow diagram. Denote their corresponding traffic densities by KP, KQ, KR and KS respectively. The correct order of these densities is