Downloaded 1,955 times
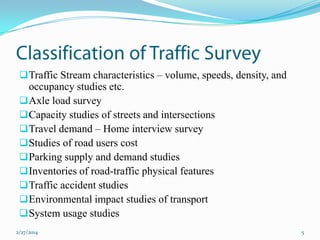
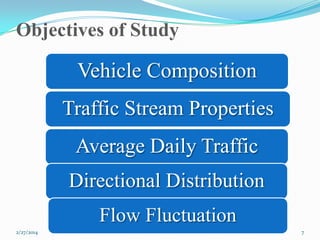

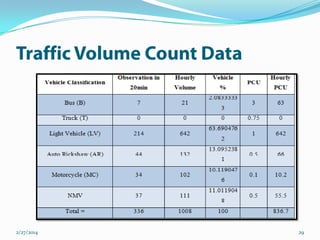
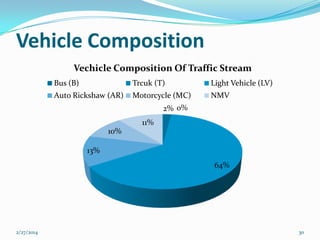
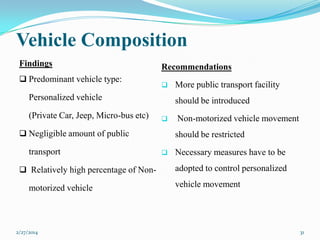
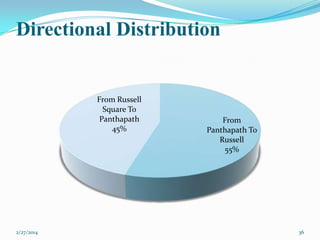

The document summarizes the results of a traffic survey conducted by a student group. It includes: 1) The objectives of studying vehicle composition, traffic stream properties, and directional distribution. 2) Findings from the survey such as the predominant vehicle type being personal vehicles and the directional distribution showing more traffic from Panthapath to Russell Square. 3) Limitations of the study related to resources and time constraints.


