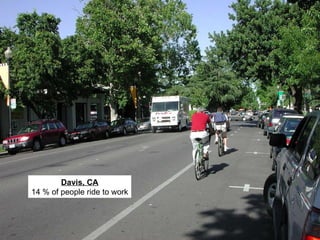
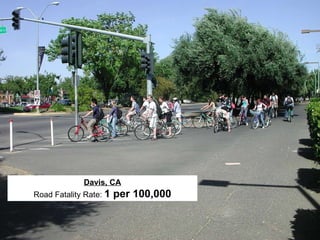
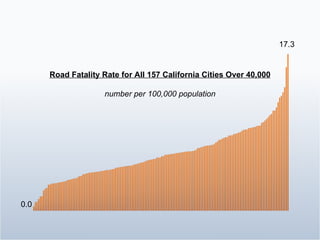
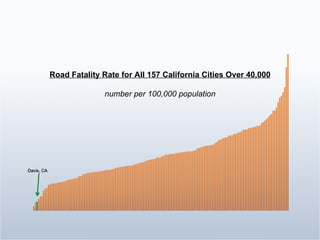
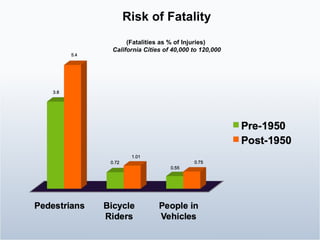
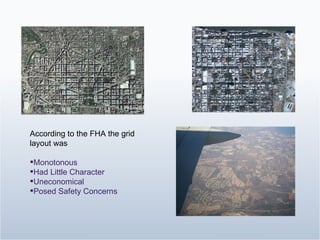
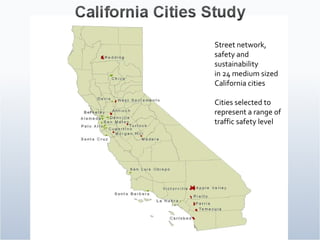
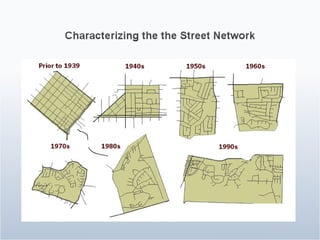
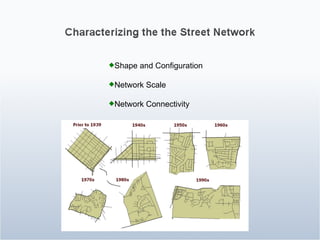
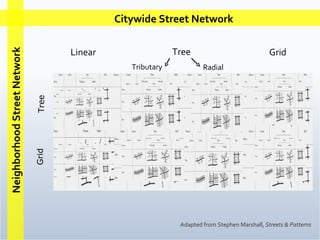
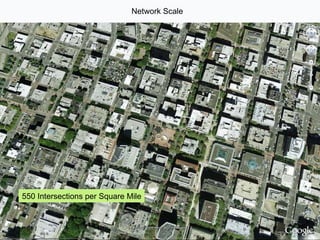
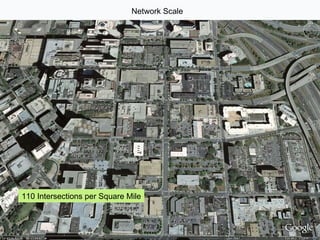
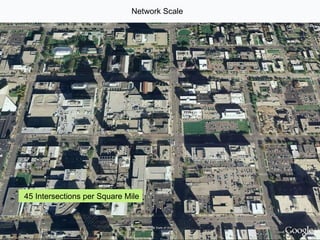
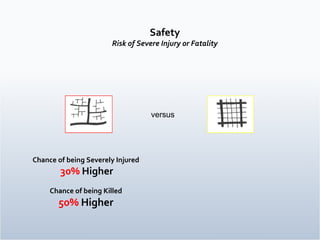
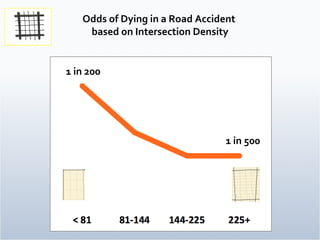
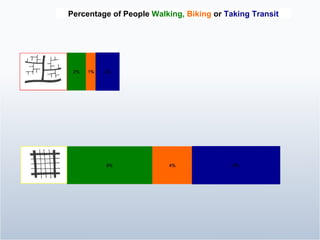
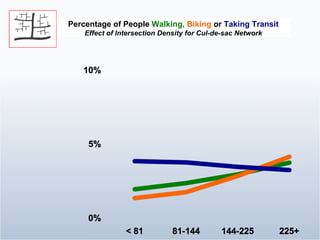
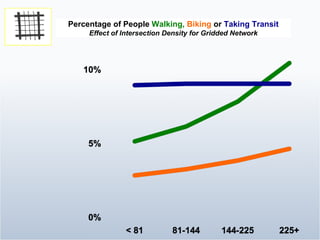
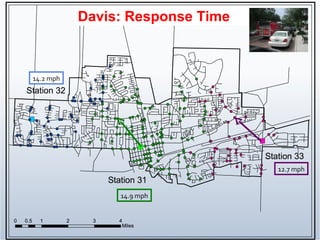
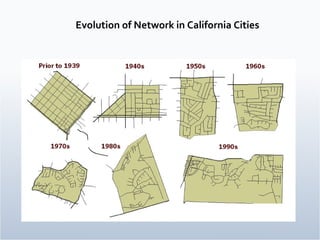
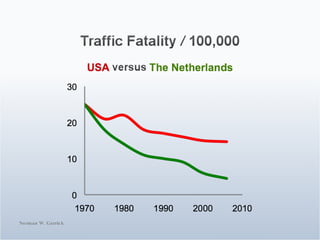
Davis, CA 14 % of people ride to work
Davis, CA Road Fatality Rate:  1 per 100,000
Road Fatality Rate for All 157 California Cities Over 40,000 number per 100,000 population 0.0 17.3
Road Fatality Rate for All 157 California Cities Over 40,000 number per 100,000 population
 
Risk of Fatality (Fatalities as % of Injuries)   California Cities of 40,000 to 120,000
 
Adapted from Stephen Marshall Pre-1950’s Post-1950’s Evolution of the Street Network
 
 
FHA Technical Bulletin No. 7 (1938) Planning Profitable Neighborhoods
According to the FHA the grid layout was Monotonous Had Little Character Uneconomical Posed Safety Concerns
Street network,  safety and  sustainability  in 24 medium sized California cities Cities selected to represent a range of traffic safety level
 
Shape and Configuration Network Scale Network Connectivity
Citywide Street Network Neighborhood Street Network Linear Tree Grid Tributary Radial Grid Tree Adapted from Stephen Marshall,  Streets & Patterns
550 Intersections per Square Mile Network Scale
110 Intersections per Square Mile Network Scale
45 Intersections per Square Mile Network Scale
Link-to-Node Ratio = 1.61  Link-to-Node Ratio = 1.13  Link-to-Node Ratio = 1.16  Network Connectivity
Street Network Properties Street Design Properties Average Total Number of Lanes Average Outside Shoulder Width Raised Median Painted Median On-Street Parking Bike Lanes Raised Curbs Travel and Activity Level Distance from City Center Income Mix of Land Use Variables included in Our Safety and Travel Choice Models
Safety Analysis Based on Geo-coding  230,000  Accident Records in 24 California Cities
Safety and Travel Choice Analysis done for  1040  Census Block Groups  24 California Cities
Travel Choice Based on Census Data 1040 Census Block Groups, 24 California Cities
versus
versus Safety Risk of Severe Injury or Fatality Chance of being Severely Injured  30%  Higher Chance of being Killed  50%  Higher
Odds of Dying in a Road Accident  based on Intersection Density 1 in 200 1 in 500
Percentage of People  Walking,  Biking  or   Taking Transit
Percentage of People  Walking,  Biking  or   Taking Transit Effect of Intersection Density for Cul-de-sac Network
Percentage of People  Walking,  Biking  or   Taking Transit Effect of Intersection Density for Gridded Network
Thanks to US EPA and CNU
28,000 14,000 8,000
15,000 11,000 14,000 11,000
8,346 10,524 12,831 8,600 2,461 28,820 7,518 6,774
16,186 10,364 13,154 24,283 5,898 15,547 17,107
Davis: Response Time 14.9 mph 14.2 mph 12.7 mph


Downtown Hartford 1960 to 2000 Parking
City of Hartford 1960 to 2000 Population and Employment
Evolution of Network in California Cities
Norman W. Garrick
Norman W. Garrick 11 X 2 X
 
Norman W. Garrick Sustainability Gap USA Norway Daily Miles Traveled For every man,  woman and child
 
Working on Detroit

Street Networks: Traffic Safety, Travel Mode Choice and Emergency Services

Editor's Notes

  • #9 To tame the street so all street users can share in its function for their specific needs, We have to reduce the vehicle operating speeds.