This document summarizes different techniques for assigning routes in transportation network modeling. It describes the all-or-nothing assignment method, direction curve method, capacity restraint assignment techniques, and multi-route assignment technique. For each method, it provides details on the approach, limitations, and examples of models that use the technique. The document is presented by five students as part of their course on urban transportation systems.
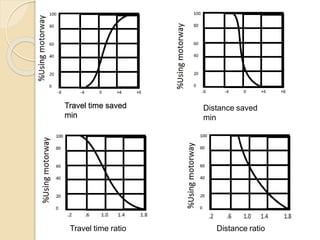
Detailed description of Capacity and Level of service of Multi lane highways based on Highway Capacity Manual (HCM2010) along with one example for finding LOS of a highway
Transportation planning is an integral part of overall urban planning and needs systematic approach.
Travel demand estimation is an important part of comprehensive transportation planning process.
However, planning does not end by predicting travel demand.
The ultimate aim of urban transport planning is to generate alternatives for improving transportation system to meet future demand and selecting the best alternative after proper evaluation.
Highway planning and alignment: Different modes of transportation – historical Development of road construction- Highway Development in India –Classification of roads- Road pattern
– Highway planning in India- Highway alignment - Engineering Surveys for alignment – Highway Project- Important Transport/Highway related agencies in India. PMGSY project.
Introduction about IRC, NRRDA
Origin and Destination ( O-D) Study. defined all types very well with advantages and disadvantages. Introduction of OD, Objective of OD Study
Information required for OD
OD Survey Types
Methodology
Road Side Interview Method
License Plate Method
Tag on Car method
Home Interview method
postal method
online survey method
commercial and public vehilce method survey
OD MATRIX
Desire line diagram and Flow Line diagram
Conclusion and Reference.
Transportation Engineering
Brief study on measurement of spot speed with the help of enoscope for diploma engineering students of civil engineering stream.
Operatioal analysis of any road is necessary for its design,planning and implementation procedure.This article mostly deals with preliminary proposal of two lane road of eastern region of Nepal.due to increased traffic condition servicabilty and level of service of koshi higway is found to be very poor hence Dharan submetropolitan city's part is analysed.
JAVA 2013 IEEE DATAMINING PROJECT T drive enhancing driving directions with t...IEEEGLOBALSOFTTECHNOLOGIES
To Get any Project for CSE, IT ECE, EEE Contact Me @ 09849539085, 09966235788 or mail us - ieeefinalsemprojects@gmail.com-Visit Our Website: www.finalyearprojects.org
T drive enhancing driving directions with taxi drivers’ intelligenceIEEEFINALYEARPROJECTS
To Get any Project for CSE, IT ECE, EEE Contact Me @ 09849539085, 09966235788 or mail us - ieeefinalsemprojects@gmail.co¬m-Visit Our Website: www.finalyearprojects.org
IJRET : International Journal of Research in Engineering and Technology is an international peer reviewed, online journal published by eSAT Publishing House for the enhancement of research in various disciplines of Engineering and Technology. The aim and scope of the journal is to provide an academic medium and an important reference for the advancement and dissemination of research results that support high-level learning, teaching and research in the fields of Engineering and Technology. We bring together Scientists, Academician, Field Engineers, Scholars and Students of related fields of Engineering and Technology.
A new conceptual algorithm for adaptive route changing in urban environmentseSAT Journals
Abstract In this paper an attempt is shown in a Mathematical Model of an alternating route adapting for large scale, which was previously done in small scale. This evaluation is done considering 75 and above traffic junctions with a scale of 4 to 6 vehicular density per second in each junction. The main objective of this paper is to show how an Adaptive Route Changing [ARC] application responds to assumed scenario & also proposing effective software architecture to monitor traffic in all the junctions at real time to minimise traffic congestion. Keywords : ARC, Intelligent transport system, Traffic Monitoring.
Vehicle Headway Distribution Models on Two-Lane Two-Way Undivided RoadsAM Publications
The time headway between vehicles is an important flow characteristic that affects the safety, level of service, driver behavior, and capacity of a transportation system. The present study attempted to identify suitable probability distribution models for vehicle headways on 2-lane 2-way undivided (2/2 UD) road sections. Data was collected from three locations in the city of Semarang: Abdulrahman Saleh St. (Loc. 1), Taman Siswa St. (Loc. 2) and Lampersari St. (Loc.3). The vehicle headways were grouped into one-second interval. Three mathematical distributions were proposed: random (negative-exponential), normal, and composite, with vehicle headway as variable. The Kolmogorov-Smirnov test was used for testing the goodness of fit. Traffic flows at the selected locations were considered low, with traffic volume ranged between 400 to 670 vehicles per hour per lane. The traffic volume on Loc.1 was 484 vehicles per hour, that on Loc. 2 was 405 vehicles per hour, and that on Loc. 3 was 666 vehicles per hour. Random distribution showed good fit at all locations under study with 95% confidence level. Normal distribution showed good fit at Loc. 1 and Loc. 2, whereas composite distribution fit only at Loc. 1. It was suggested that random distribution is to be used as an input in generating traffic in traffic analysis at highway sections where traffic volume are under 500 vehicles per hour.
Accessibility Analysis and Modeling in Public Transport Networks - A Raster b...Beniamino Murgante
Accessibility Analysis and Modeling in Public Transport Networks - A
Raster based Approach
Morten Fuglsang, - National Environmental Research Institute, Aarhus
University and Aalborg University Copenhagen
Henning Sten Hansen - Aalborg University Copenhagen
Bernd Münier - National Environmental Research Institute, Aarhus University
Quality defects in TMT Bars, Possible causes and Potential Solutions.PrashantGoswami42
Maintaining high-quality standards in the production of TMT bars is crucial for ensuring structural integrity in construction. Addressing common defects through careful monitoring, standardized processes, and advanced technology can significantly improve the quality of TMT bars. Continuous training and adherence to quality control measures will also play a pivotal role in minimizing these defects.
COLLEGE BUS MANAGEMENT SYSTEM PROJECT REPORT.pdfKamal Acharya
The College Bus Management system is completely developed by Visual Basic .NET Version. The application is connect with most secured database language MS SQL Server. The application is develop by using best combination of front-end and back-end languages. The application is totally design like flat user interface. This flat user interface is more attractive user interface in 2017. The application is gives more important to the system functionality. The application is to manage the student’s details, driver’s details, bus details, bus route details, bus fees details and more. The application has only one unit for admin. The admin can manage the entire application. The admin can login into the application by using username and password of the admin. The application is develop for big and small colleges. It is more user friendly for non-computer person. Even they can easily learn how to manage the application within hours. The application is more secure by the admin. The system will give an effective output for the VB.Net and SQL Server given as input to the system. The compiled java program given as input to the system, after scanning the program will generate different reports. The application generates the report for users. The admin can view and download the report of the data. The application deliver the excel format reports. Because, excel formatted reports is very easy to understand the income and expense of the college bus. This application is mainly develop for windows operating system users. In 2017, 73% of people enterprises are using windows operating system. So the application will easily install for all the windows operating system users. The application-developed size is very low. The application consumes very low space in disk. Therefore, the user can allocate very minimum local disk space for this application.
Final project report on grocery store management system..pdfKamal Acharya
In today’s fast-changing business environment, it’s extremely important to be able to respond to client needs in the most effective and timely manner. If your customers wish to see your business online and have instant access to your products or services.
Online Grocery Store is an e-commerce website, which retails various grocery products. This project allows viewing various products available enables registered users to purchase desired products instantly using Paytm, UPI payment processor (Instant Pay) and also can place order by using Cash on Delivery (Pay Later) option. This project provides an easy access to Administrators and Managers to view orders placed using Pay Later and Instant Pay options.
In order to develop an e-commerce website, a number of Technologies must be studied and understood. These include multi-tiered architecture, server and client-side scripting techniques, implementation technologies, programming language (such as PHP, HTML, CSS, JavaScript) and MySQL relational databases. This is a project with the objective to develop a basic website where a consumer is provided with a shopping cart website and also to know about the technologies used to develop such a website.
This document will discuss each of the underlying technologies to create and implement an e- commerce website.
Event Management System Vb Net Project Report.pdfKamal Acharya
In present era, the scopes of information technology growing with a very fast .We do not see any are untouched from this industry. The scope of information technology has become wider includes: Business and industry. Household Business, Communication, Education, Entertainment, Science, Medicine, Engineering, Distance Learning, Weather Forecasting. Carrier Searching and so on.
My project named “Event Management System” is software that store and maintained all events coordinated in college. It also helpful to print related reports. My project will help to record the events coordinated by faculties with their Name, Event subject, date & details in an efficient & effective ways.
In my system we have to make a system by which a user can record all events coordinated by a particular faculty. In our proposed system some more featured are added which differs it from the existing system such as security.
Industrial Training at Shahjalal Fertilizer Company Limited (SFCL)MdTanvirMahtab2
This presentation is about the working procedure of Shahjalal Fertilizer Company Limited (SFCL). A Govt. owned Company of Bangladesh Chemical Industries Corporation under Ministry of Industries.
Sachpazis:Terzaghi Bearing Capacity Estimation in simple terms with Calculati...Dr.Costas Sachpazis
Terzaghi's soil bearing capacity theory, developed by Karl Terzaghi, is a fundamental principle in geotechnical engineering used to determine the bearing capacity of shallow foundations. This theory provides a method to calculate the ultimate bearing capacity of soil, which is the maximum load per unit area that the soil can support without undergoing shear failure. The Calculation HTML Code included.
Democratizing Fuzzing at Scale by Abhishek Aryaabh.arya
Presented at NUS: Fuzzing and Software Security Summer School 2024
This keynote talks about the democratization of fuzzing at scale, highlighting the collaboration between open source communities, academia, and industry to advance the field of fuzzing. It delves into the history of fuzzing, the development of scalable fuzzing platforms, and the empowerment of community-driven research. The talk will further discuss recent advancements leveraging AI/ML and offer insights into the future evolution of the fuzzing landscape.
Water scarcity is the lack of fresh water resources to meet the standard water demand. There are two type of water scarcity. One is physical. The other is economic water scarcity.
Welcome to WIPAC Monthly the magazine brought to you by the LinkedIn Group Water Industry Process Automation & Control.
In this month's edition, along with this month's industry news to celebrate the 13 years since the group was created we have articles including
A case study of the used of Advanced Process Control at the Wastewater Treatment works at Lleida in Spain
A look back on an article on smart wastewater networks in order to see how the industry has measured up in the interim around the adoption of Digital Transformation in the Water Industry.
Saudi Arabia stands as a titan in the global energy landscape, renowned for its abundant oil and gas resources. It's the largest exporter of petroleum and holds some of the world's most significant reserves. Let's delve into the top 10 oil and gas projects shaping Saudi Arabia's energy future in 2024.
Immunizing Image Classifiers Against Localized Adversary Attacksgerogepatton
This paper addresses the vulnerability of deep learning models, particularly convolutional neural networks
(CNN)s, to adversarial attacks and presents a proactive training technique designed to counter them. We
introduce a novel volumization algorithm, which transforms 2D images into 3D volumetric representations.
When combined with 3D convolution and deep curriculum learning optimization (CLO), itsignificantly improves
the immunity of models against localized universal attacks by up to 40%. We evaluate our proposed approach
using contemporary CNN architectures and the modified Canadian Institute for Advanced Research (CIFAR-10
and CIFAR-100) and ImageNet Large Scale Visual Recognition Challenge (ILSVRC12) datasets, showcasing
accuracy improvements over previous techniques. The results indicate that the combination of the volumetric
input and curriculum learning holds significant promise for mitigating adversarial attacks without necessitating
adversary training.
Student information management system project report ii.pdfKamal Acharya
Our project explains about the student management. This project mainly explains the various actions related to student details. This project shows some ease in adding, editing and deleting the student details. It also provides a less time consuming process for viewing, adding, editing and deleting the marks of the students.
4. A route is simply a chain of links between an origin
and destination .
The final Route assignment, route choice, or traffic
assignment concerns the selection of routes between
origins and destinations in transportation networks. It
is the fourth step in the conventional transportation
forecasting model, following trip generation, trip
distribution, and mode choice.
Route Assignment
5. Between the two zones A and B, there maybe alternate
routes to follow, having different lengths and
characteristics. The estimation of what proportion of
total forecasted trips between A and B, shall use the
available alternate routes is known as “Route
Assignment".
In the route assignment:-
i) The route to be travelled is determined.
ii) The interzonal trips are assigned to the selected
routes.
Route Assignment
6. To determine facility needs and costs and benefits, we
need to know the number of travellers on each route
and link of the network. We need to undertake traffic
(or trip) assignment.
Suppose there is a network of highways and transit
systems and a proposed addition. We first want to
know the present pattern of traffic delay and then what
would happen if the addition were made.
Route Assignment
7. • Some of the basic methods of route assignment are:-
All-or-nothing assignment method
Direction curve method
Capacity restraint assignment techniques
Multi-route assignment technique
Methods Of Route
Assignment
9. This is the simplest technique, in which all trips for a
zone are assigned the minimum path connecting the
nodes. The minimum path is the route which has the
least travel time, travel cost or distance. The
technique assumes that the capacity of each link is
infinite so that the volume of traffic does not affect the
time of travel or cost of travel.
In the first stage, the network description and tree
building is made. The next stage is to assign the traffic
flows to the minimum path tree.
All-or-nothing assignment
method
10. Limitations
1. If time alone is used as the governing factor in
selecting the minimum path, the other important
factors like cost, distance, safety will be neglected.
2. In a network with two or more parallel and close links,
the link which is only marginally quicker will be
allocated all the trips. The resulting flow pattern may
lead to an unrealistic situation.
3. Too many vehicles tend to be assigned to more
attractive routes. This may cause increasing
congestion on these routes, and the technique takes
no account of this factor.
All-or-nothing assignment
method
11. 4. All facilities in the network are not effectively utilised.
5. If a superior facility is available, say, for example a
motorway people tend to prefer to use this facility for
longer journeys. This technique does not reflect this
tendency
All-or-nothing assignment
method
Limitations
13. Diversion curves method is one of the frequently used
assignment techniques.
This method predicts the percentage of trips that is
likely to use a proposed new facility (bypass, new
expressway, new arterial street, etc.) based on
distance saved or time saved or cost saved.
The data collected from the pattern of road usage in
the past serve to build up such curves.
Direction curve method
14. can be constructed using theDiversion curves
following variables:-
1. Travel time saved
2. Distance saved
3. Travel time ratio
4. Distance ratio
5. Travel time and distance saved
6. Travel cost ratio
7. Distance and speed ratio
Direction curve method
15. Bureau of Public Roads curve shown in Fig.
The following formula has been fitted to this type
of curves
of traffic diverted to
new
where,
P=percentage
system
Direction curve method
100
1 TR6
P
travel time on oldsystem
TR=travel time ratio
TR
travel time on new system
18. on theirCalifornia Division of Highways, based
observations on freeway in California in 1956,
developed the following equation for arriving at
percentage use of freeway:
route
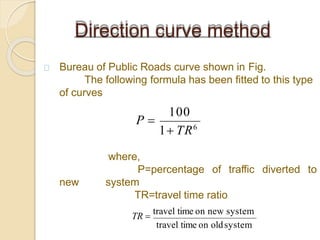
where, P=percentage of motorway usage
d=distance saved in miles on new
t=time saved in minutes on new
route
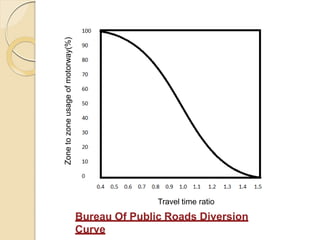
The main drawback of diversion curve assignments is
that only two alternative routes for each pair of zones
Direction curve method
[(d - 0.5t) 2
4.5]0.5
50(d 0.5t)
P 50
20. The capacity restrained assignment technique
involves a sequence of all-or-nothing minimum path
assignments where the sequence is iterated until the
traffic volumes assigned to each links are comparable
with the link travel time assumed in the minimum path
tree building phase.
The link travel time used in assignment is a function of
speed on that link, which again is independent on the
traffic flow being assigned.
Because
involved
of the iterative nature of the calculation
this technique is carried out entirely by
Capacity restraint assignment
techniques
21. In the Detroit area traffic study on iterative procedure was
utilised. In this study, traffic was assigned to various
links, using all-or-nothing approach. The speed
assumed for initial assignment was the free
speed. Each link's travel time was modified as
follows:-
where, TA=adjusted travel time
To=original assigned travel
time
Capacity restraint assignment
techniques
The Detroit Model
C
T T .e(V 1)A O
22. where, Vr=volume of traffic on route r
(vehicles per hour per lane)
V=total volume of traffic (trips) from
zone i to zone j on all routes m
tr=travel time on route r (minutes)
Capacity restraint assignment
This model involves two travel time
versus volume relationships used
iteratively, to arrive at prediction of
volumes on separate routes between
any two zones. The equation used for
predicting the volume on a route r is
given as under1:-
techniques
The TRC trip assignment model
t r
r VV m
r 1 tr
1
23. The TRC trip assignment model
The value of tr, for iterations is found by the following
equation:-
where, trc=unit travel time at the critical volume (min/mile)
tr=travel time on route r (minutes)
of traffic on route r
volume for route r (vehicle
Vr=Volume
(vehicle/hour/lane)
Vrc=critical
/hour/lane)
Lr=Length of route r (km)
Capacity restraint assignment
techniques
r
rc
r rc
V
t t
d(Vr Vrc )
L
25. All road users may not be able to judge the minimum
path for themselves.
It may also happen that all road users may not have
the same criteria for judging the shortest route.
of tall-or-nothing approach are
the multiple route assignment
These limitations
recognised in
technique.
The method consists of assigning the interzonal flow to a
series of routes, the proportion of the total flow
assigned to each being a function of the length of that
Multiroute assignment technique
26. Mclaughlin developed one multipath traffic assignment
technique as under:
A driver's route selection criteria is used which is a
function of :-
(i) Travel time
(ii) Travel cost
(iii) Accident potential
Multi-route assignment technique
27. The minimum resistance path between origin and
destination pair are calculated with all the link
resistances set to values which correspond to a zero
traffic volume.
The minimum resistance value between O-D pair is
increased by 30% .
All the path between O-D pair with resistance values
less than this maximum value are identified.
Multi-route assignment technique