Downloaded 414 times
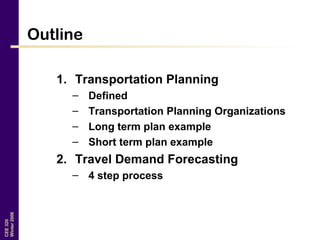
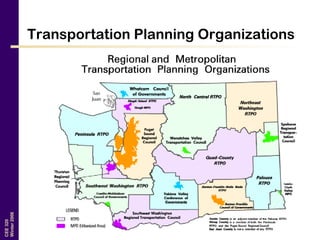
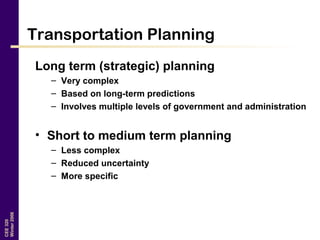
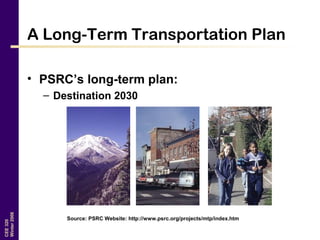
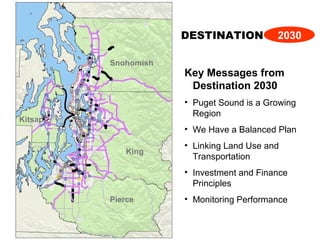
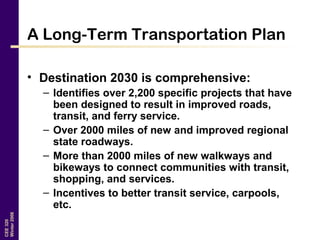
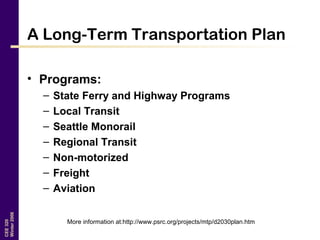
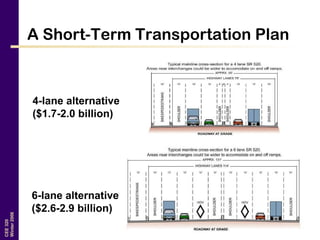

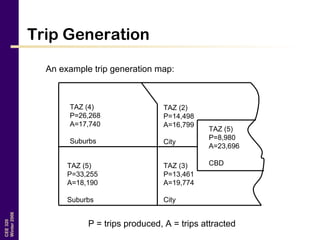
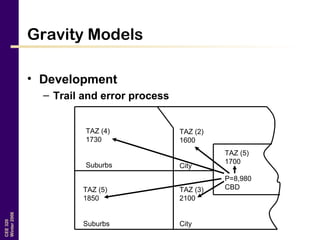
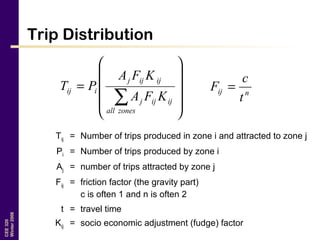
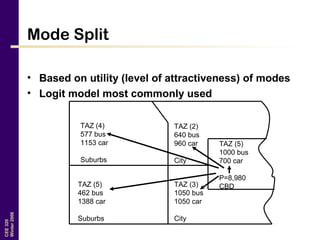
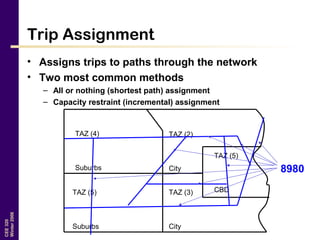
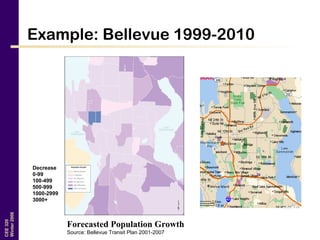

This document provides an overview of transportation planning and travel demand forecasting. It discusses long-term and short-term transportation planning, including examples. It also explains the four-step travel demand forecasting process of trip generation, trip distribution, mode split, and trip assignment. Key models used include Poisson models for trip generation, gravity models for trip distribution, and logit models for mode split.


![11 Geometric Design of Railway Track [Vertical Alignment] (Railway Engineerin...](https://cdn.slidesharecdn.com/ss_thumbnails/geometricdesignofrailwaytrack-ii-200415172410-thumbnail.jpg?width=640&height=640&fit=bounds)
![10 Geometric Design of Railway Track [Horizontal Alignment] (Railway Engineer...](https://cdn.slidesharecdn.com/ss_thumbnails/geometricdesignofrailwaytrack-i-200415171932-thumbnail.jpg?width=640&height=640&fit=bounds)


