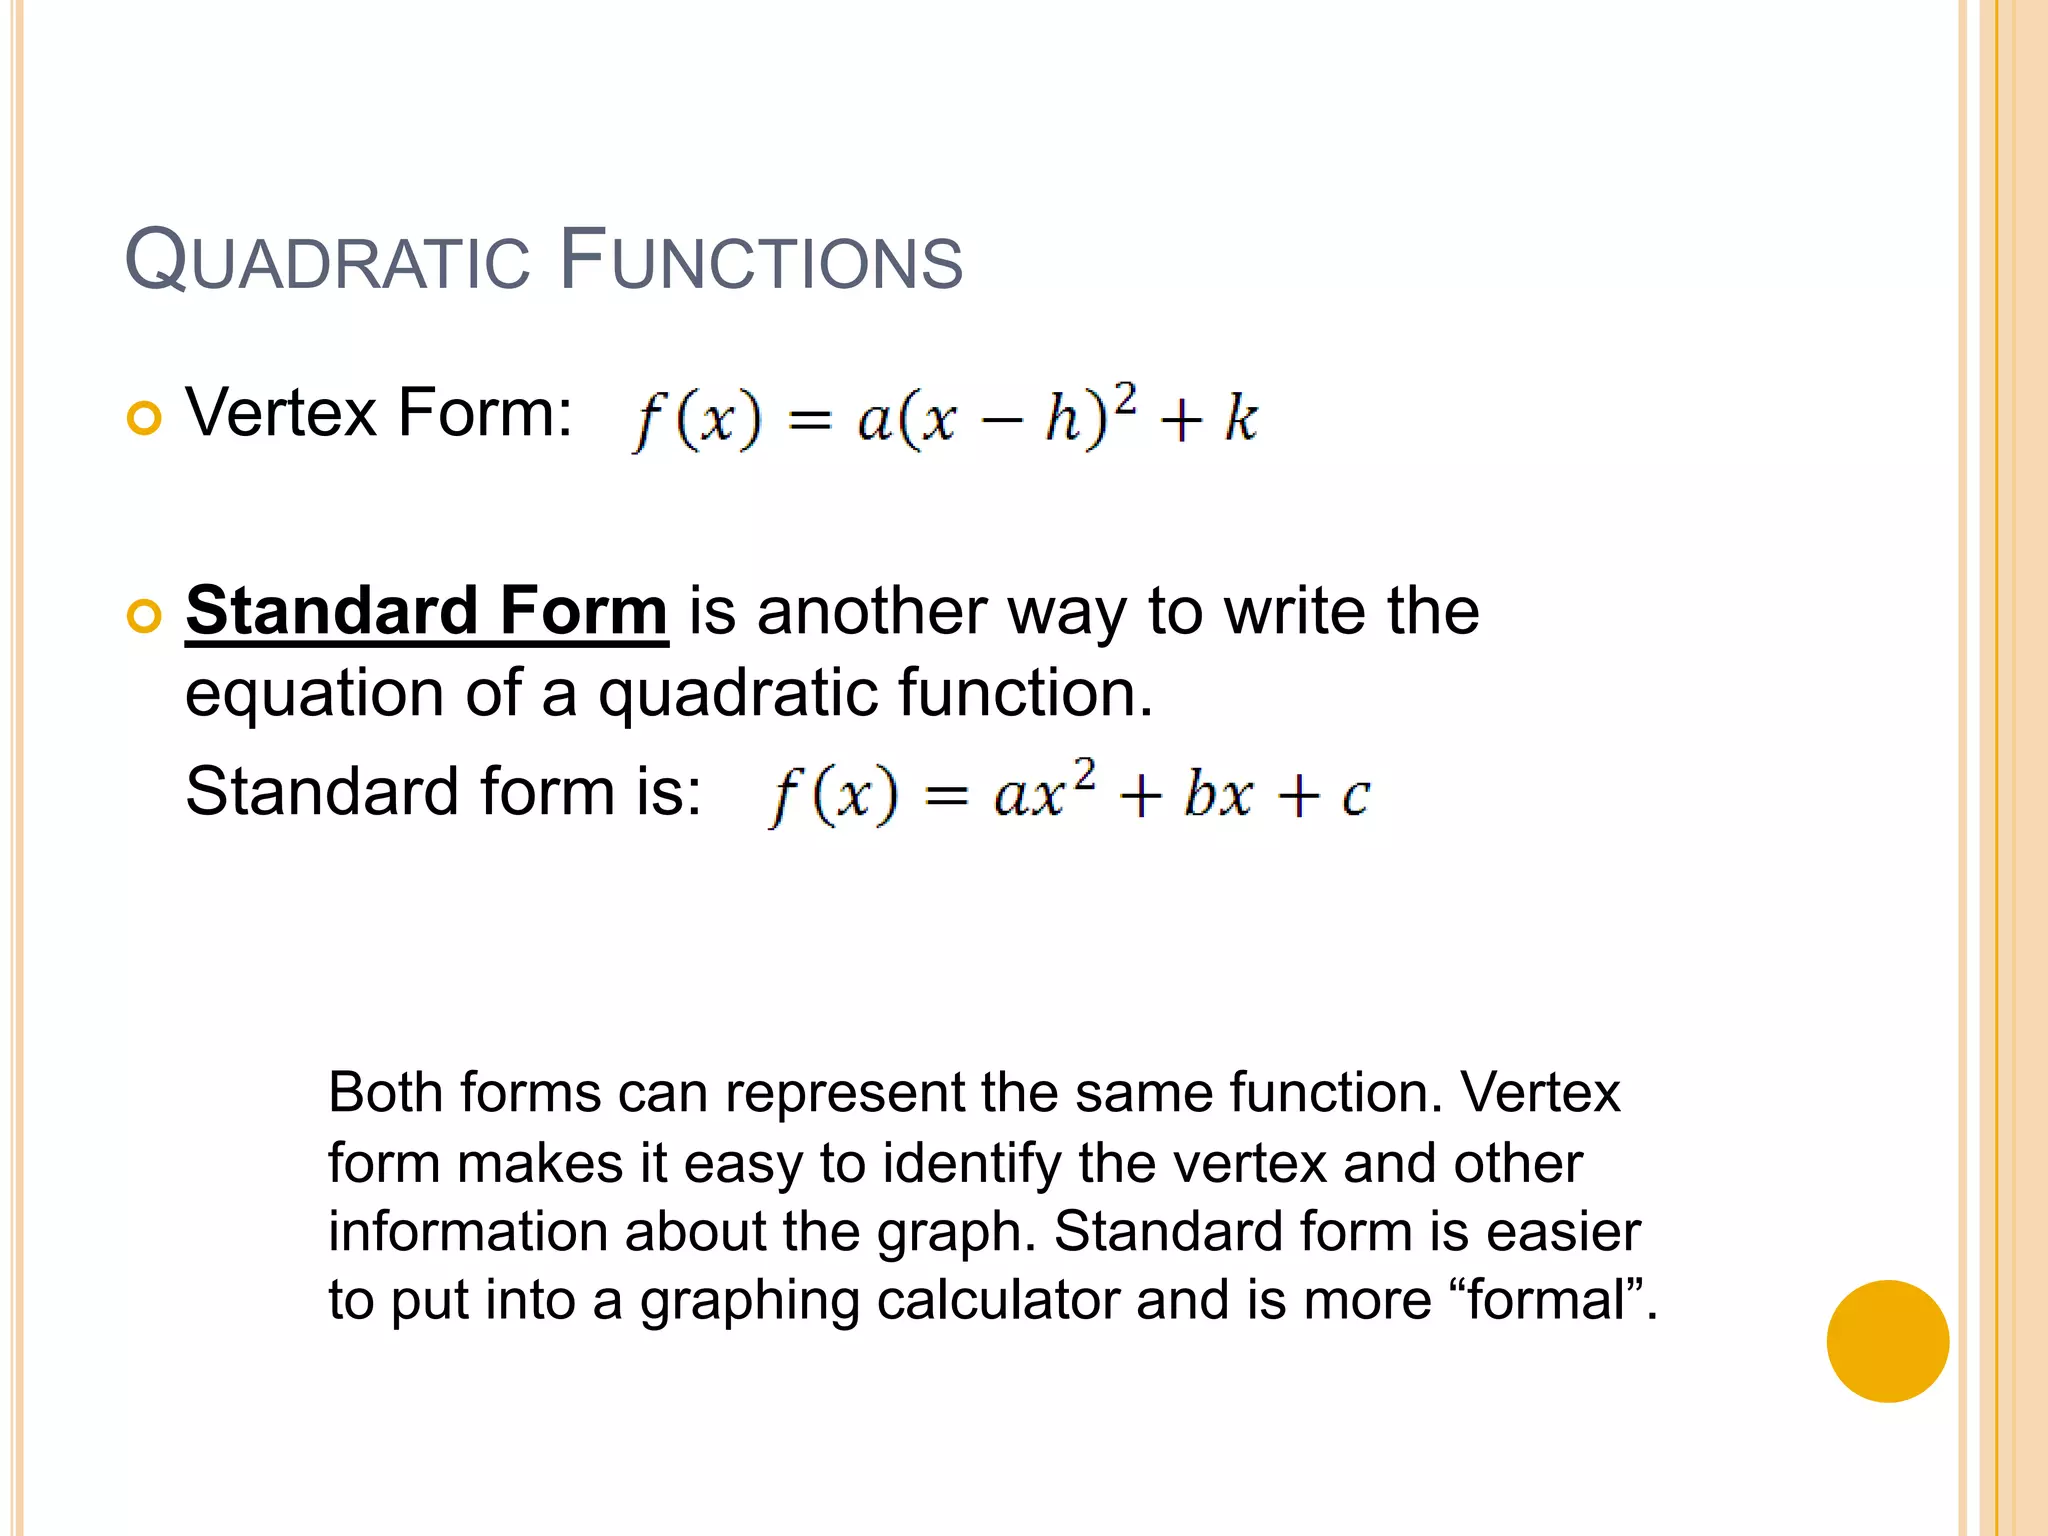
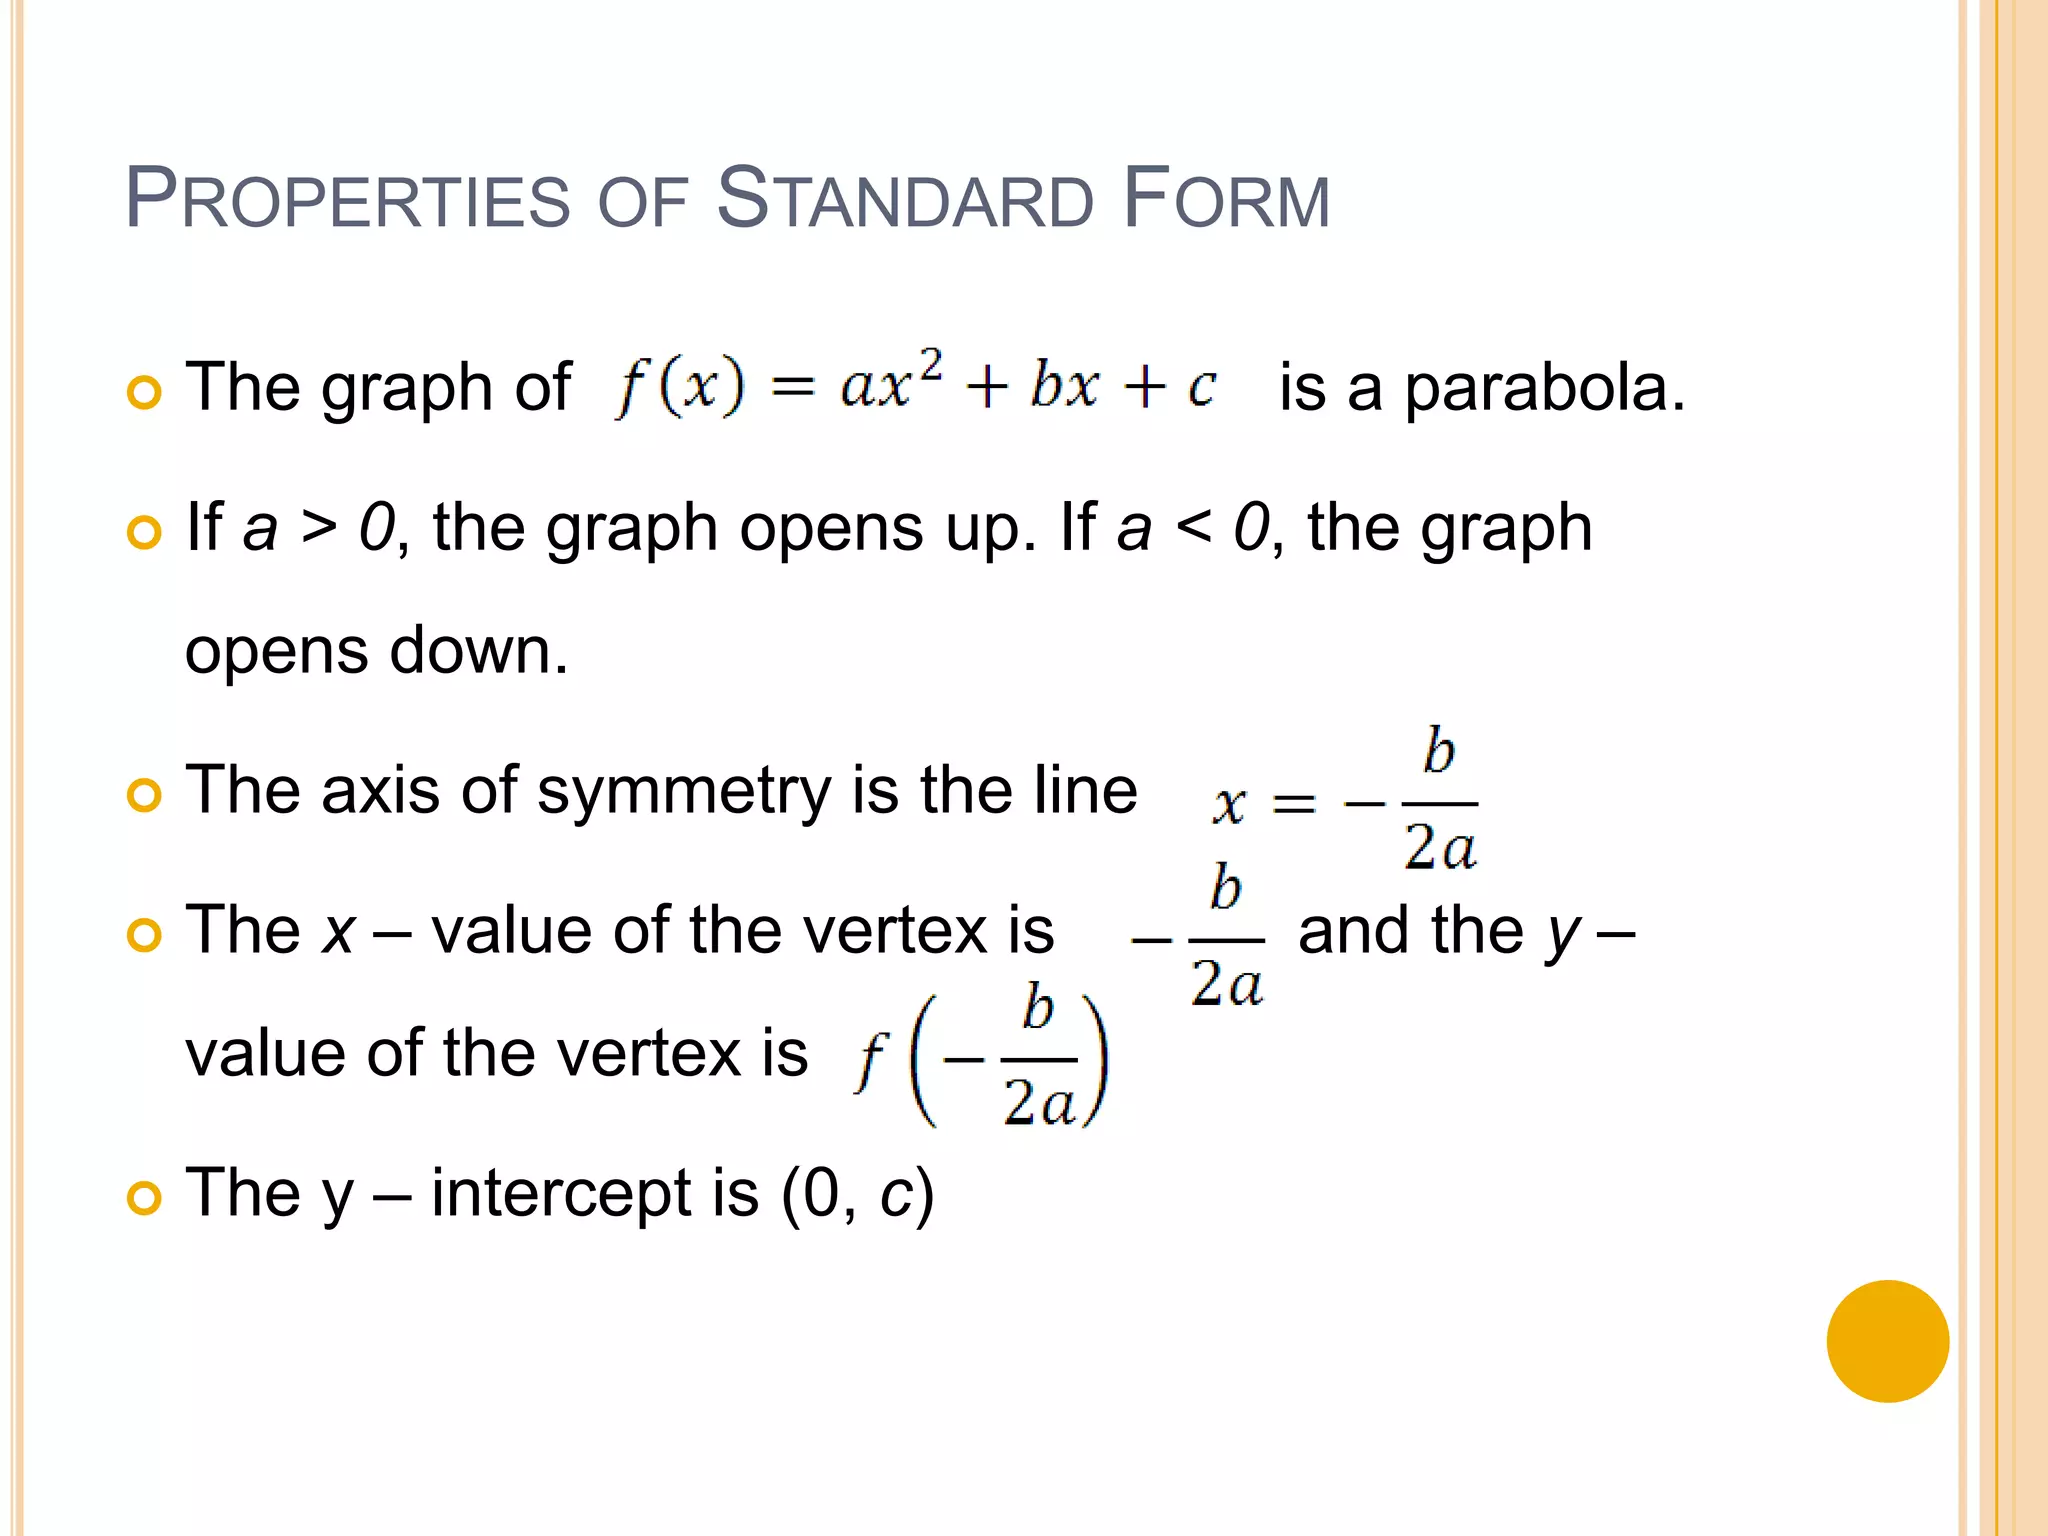
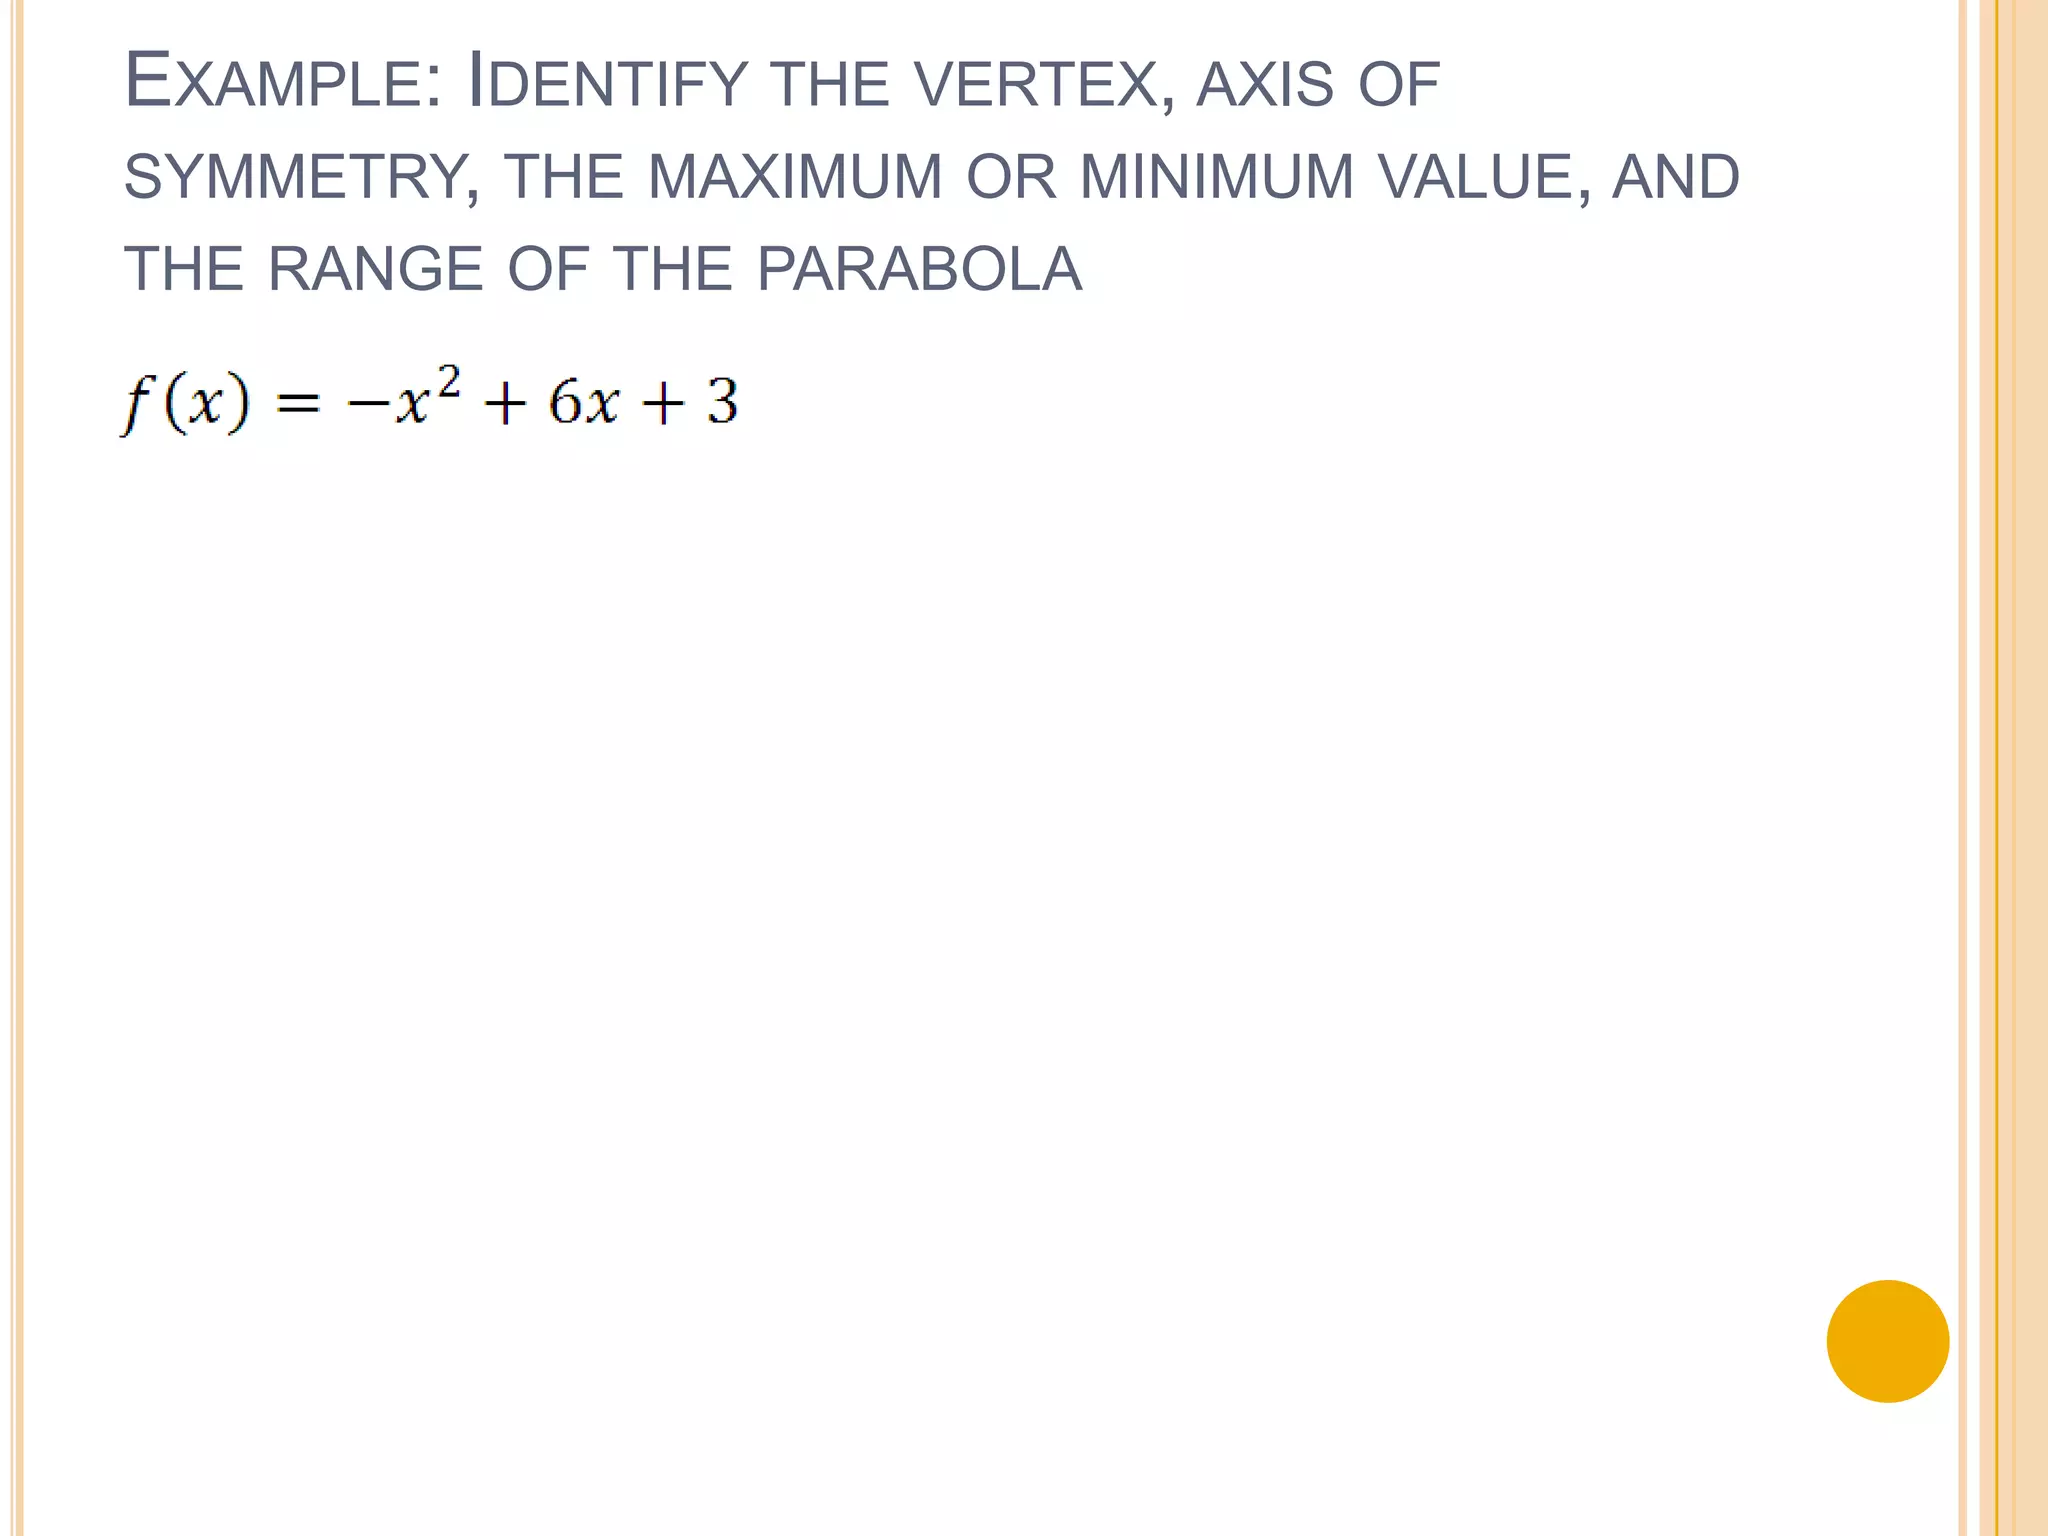
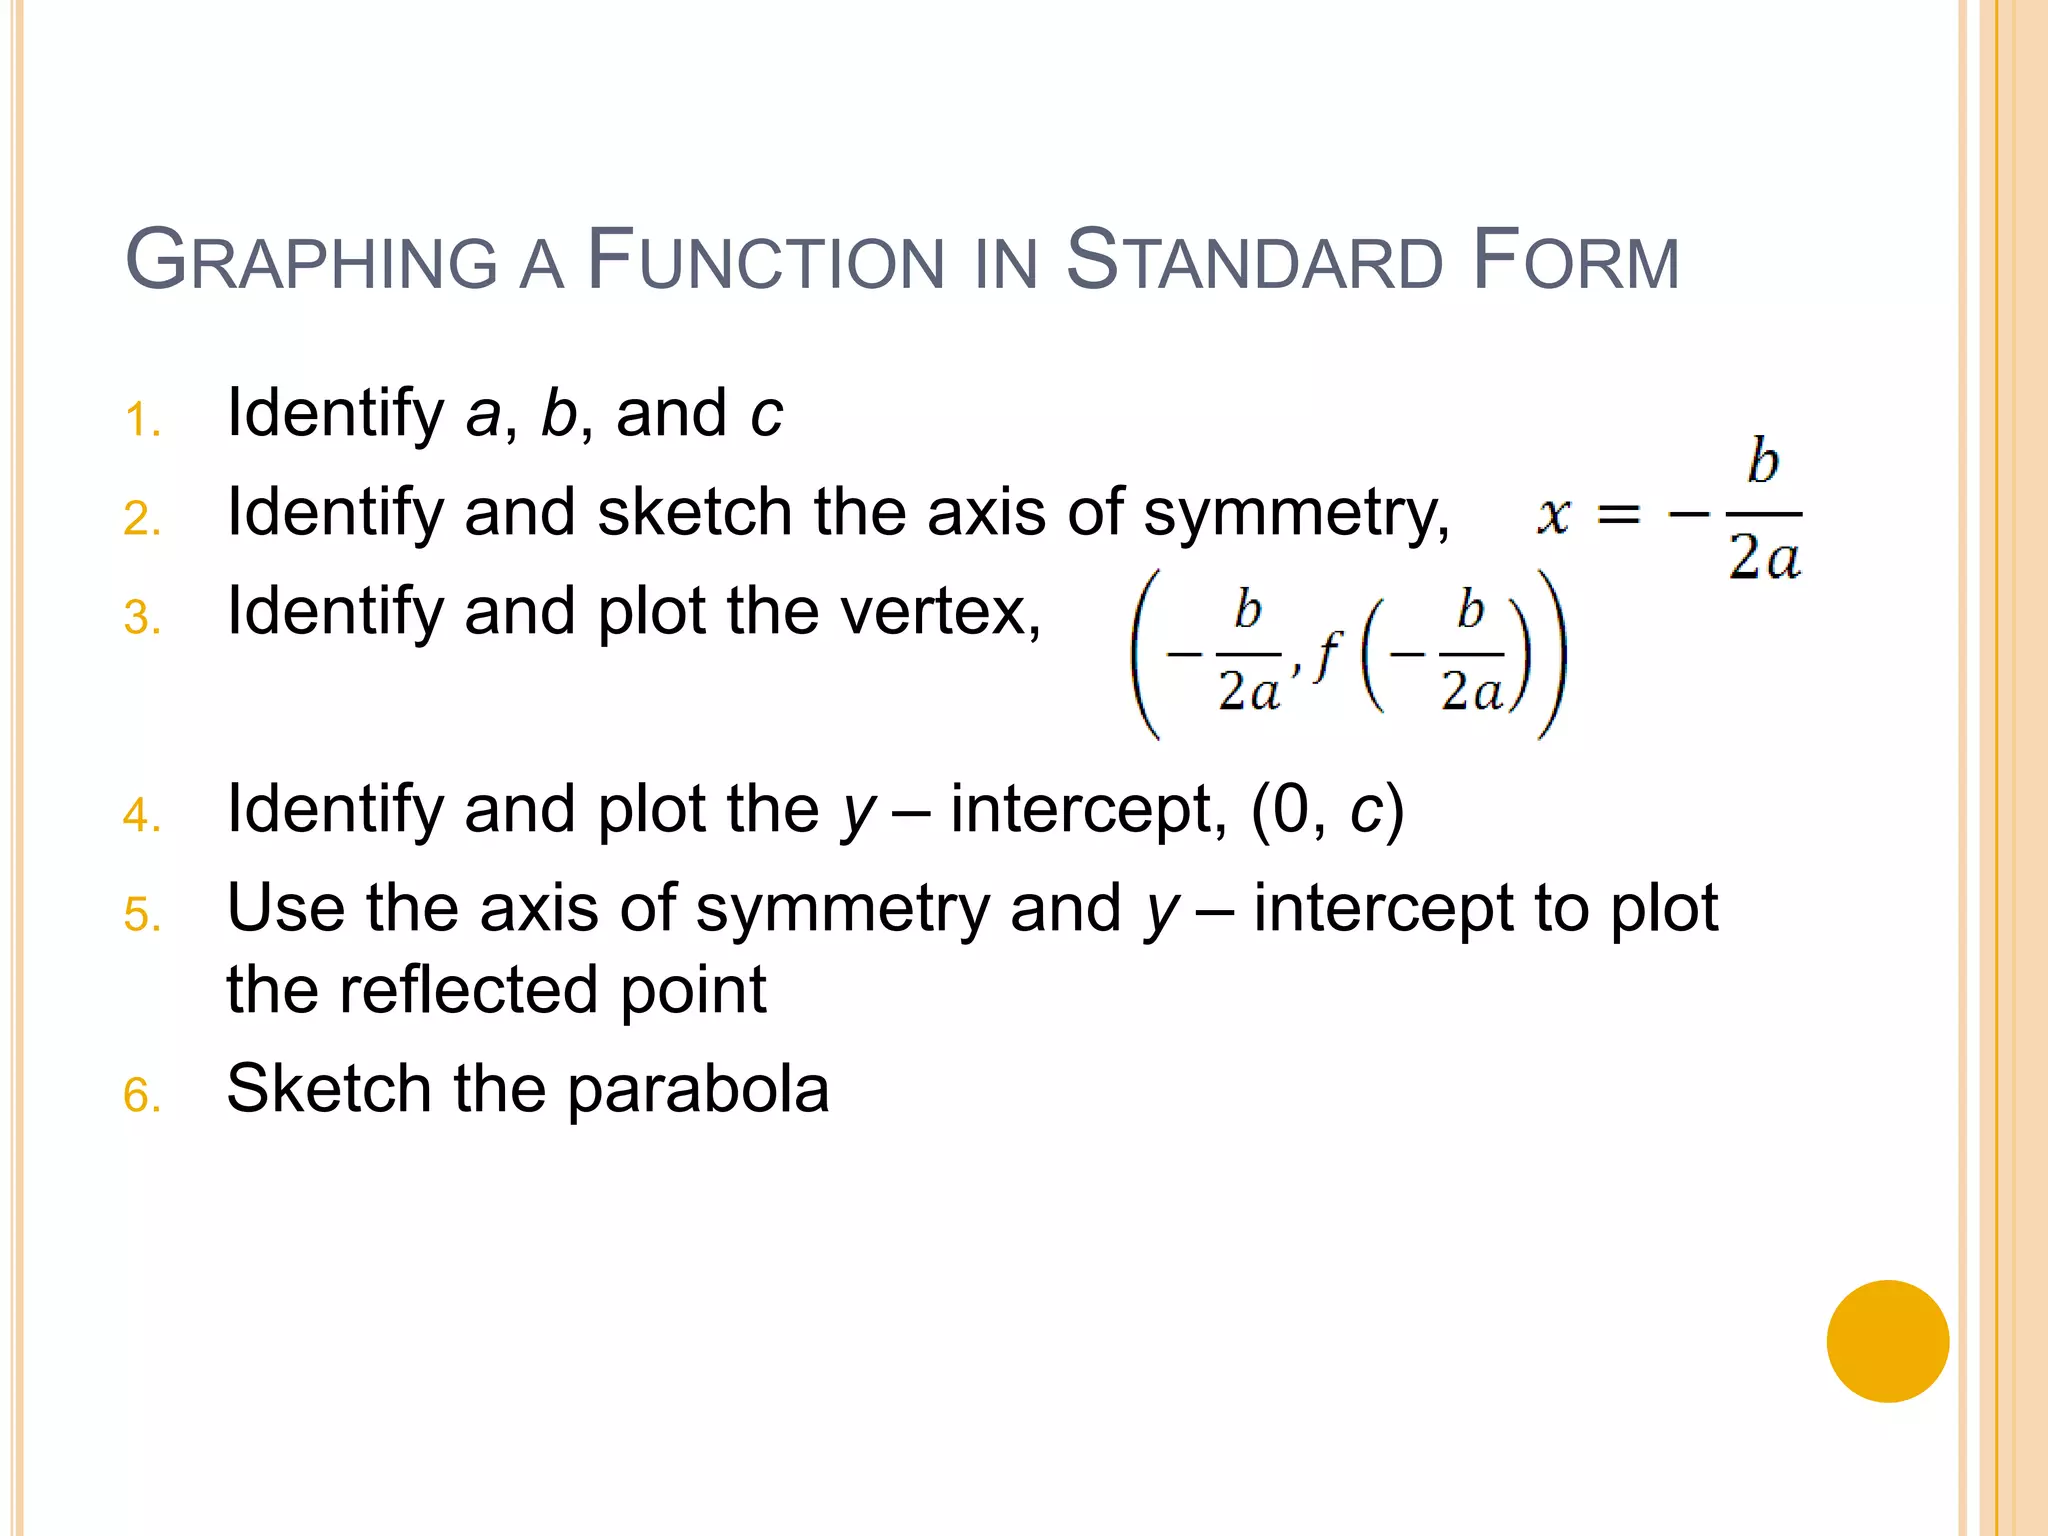
Standard form of a quadratic function is f(x) = ax^2 + bx + c. The graph is a parabola that opens up if a > 0 and opens down if a < 0. The axis of symmetry is the line x = -b/2a and the vertex is (-b/2a, f(-b/2a)). To graph in standard form, identify a, b, c, find the axis of symmetry and vertex, then plot the y-intercept and use reflection to sketch the parabola. The document provides an example of using standard form to identify the vertex, axis of symmetry, minimum/maximum value, and range of a parabola.


![5.1[1]](https://cdn.slidesharecdn.com/ss_thumbnails/5-11-121219075353-phpapp01-thumbnail.jpg?width=640&height=640&fit=bounds)


