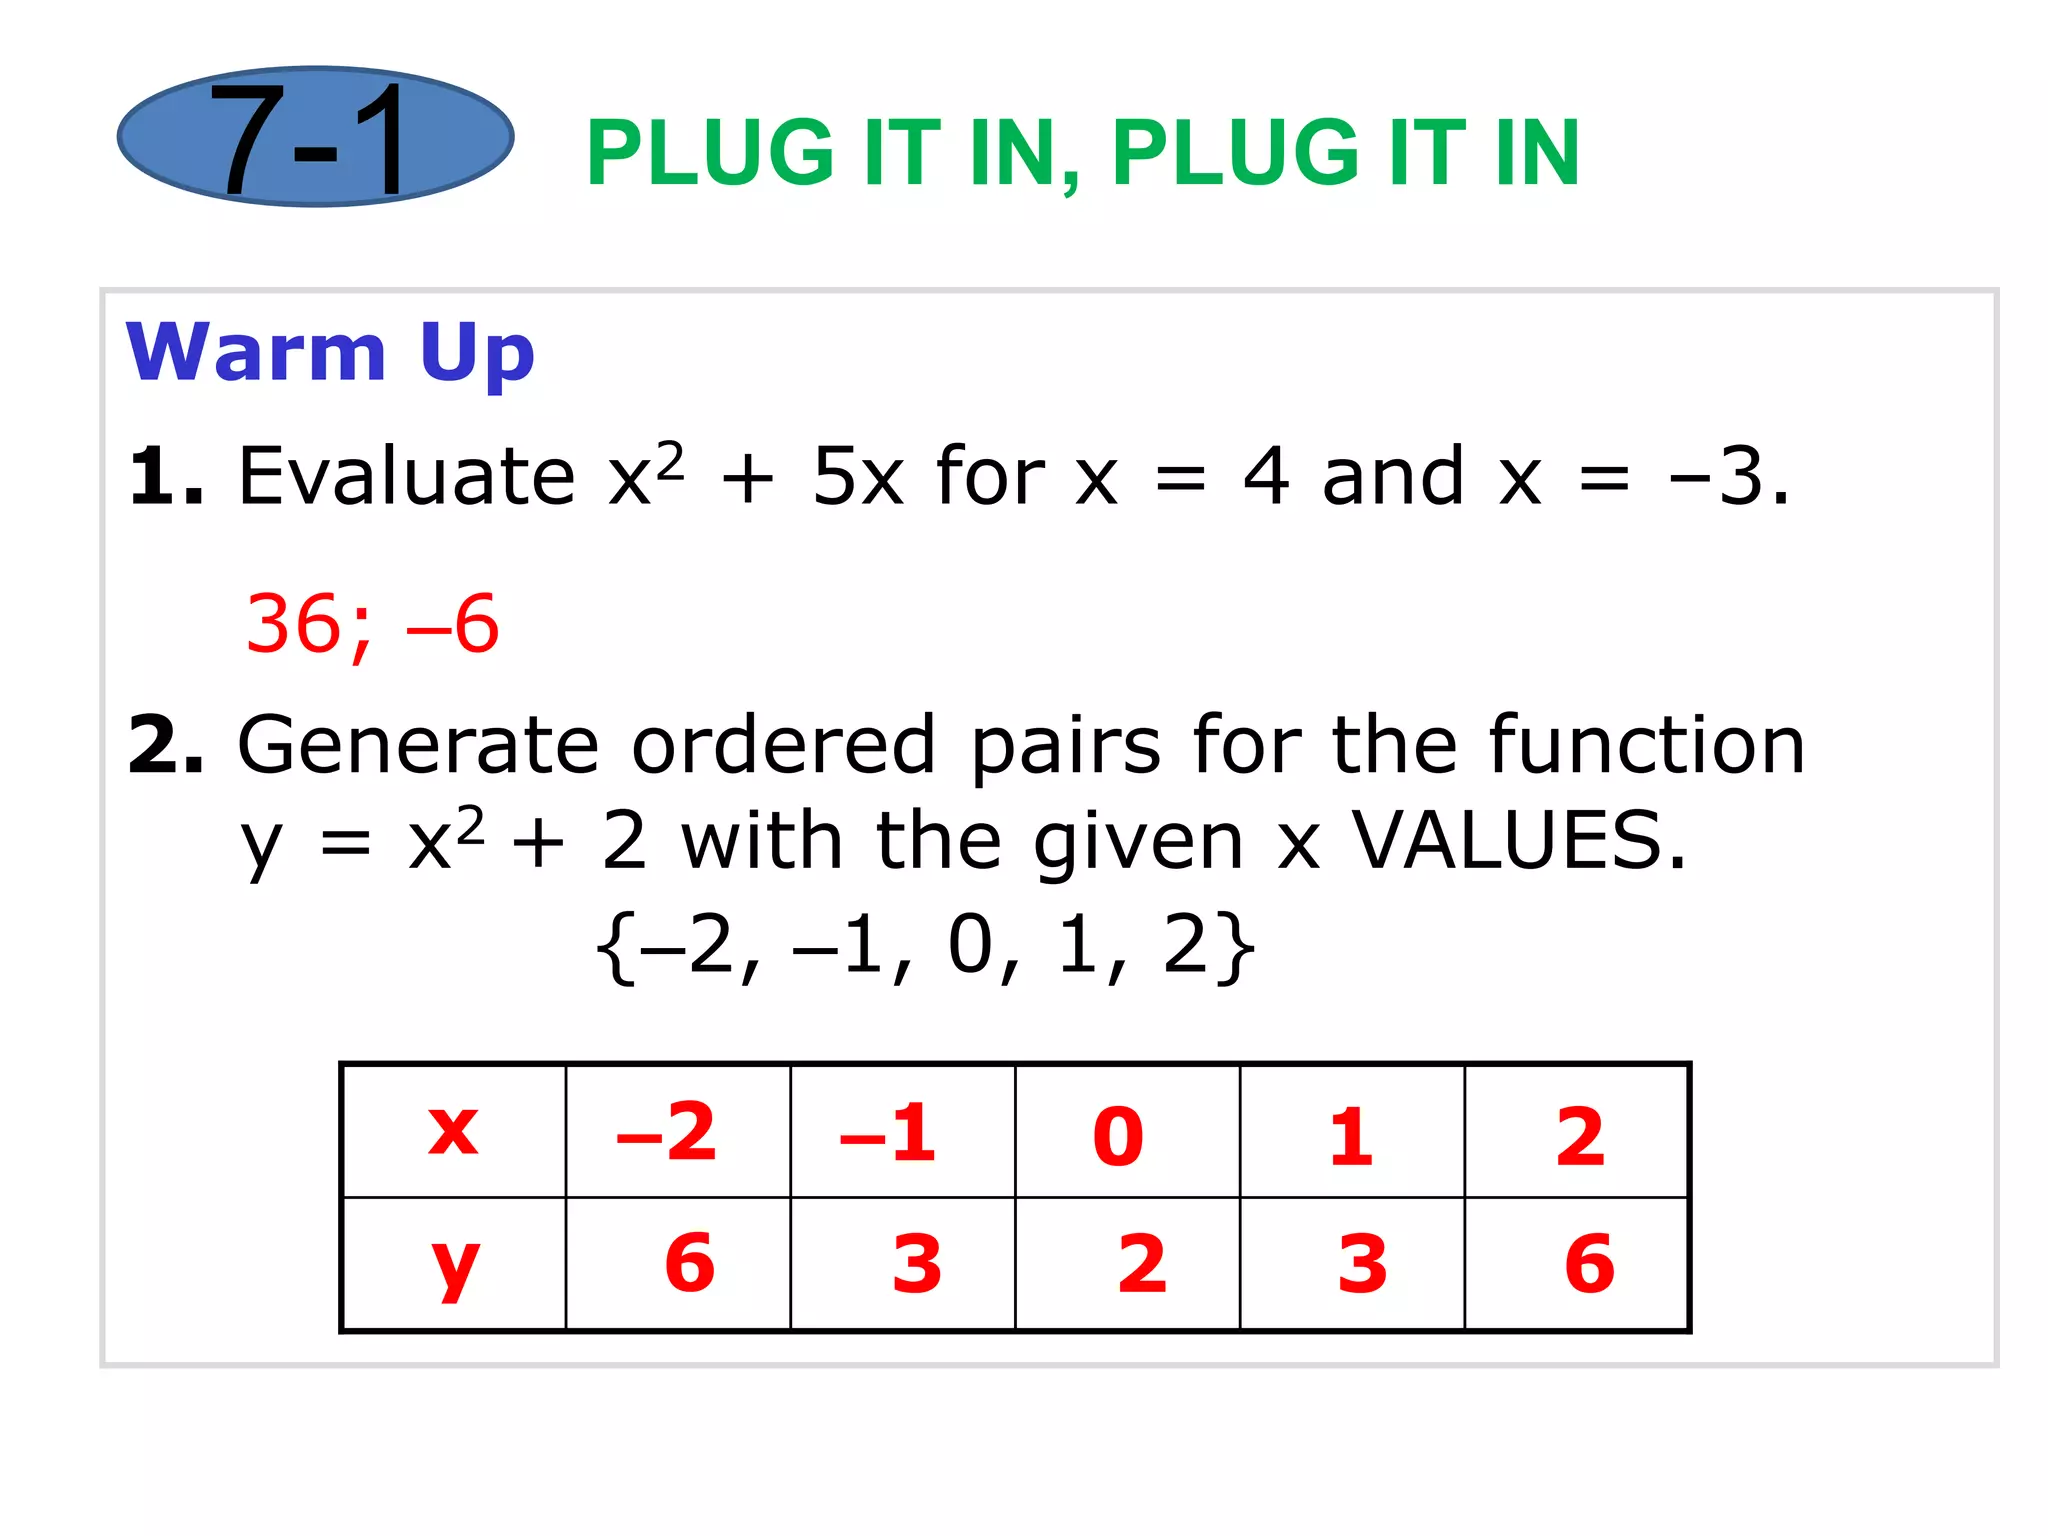
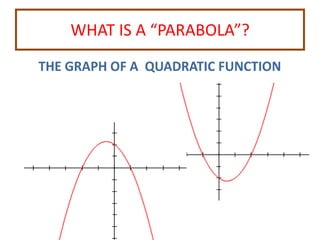
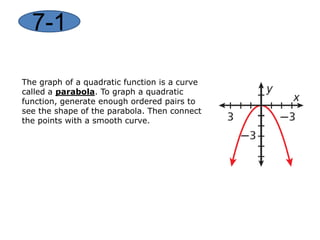
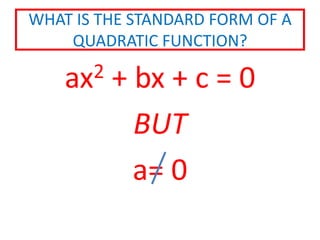
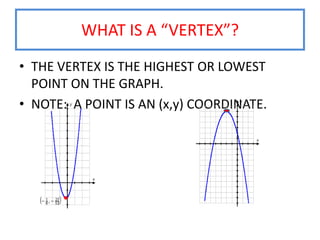
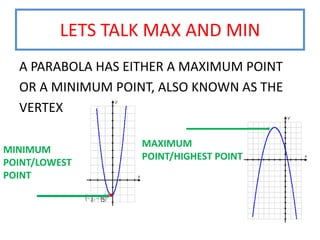
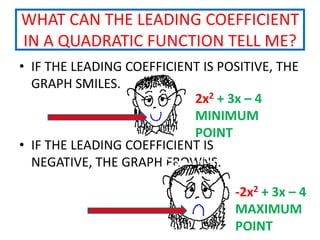
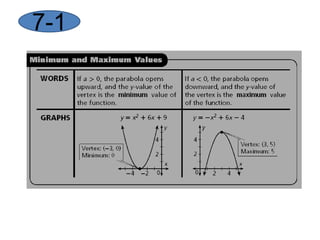
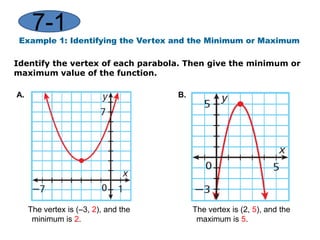
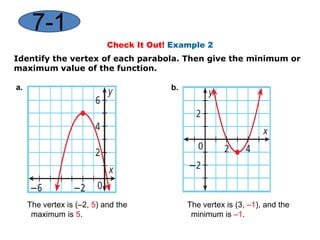
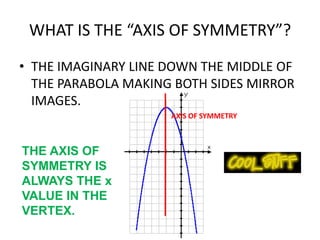
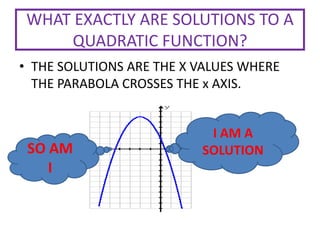
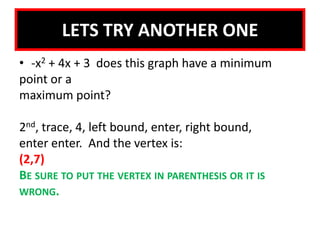
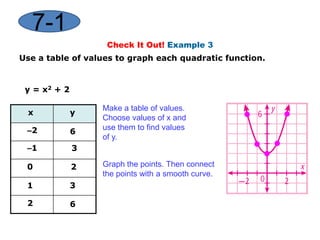
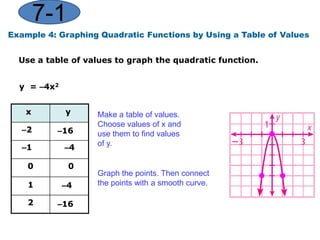
This document provides instruction on graphing quadratic functions. It defines key terms like parabola, vertex, axis of symmetry, and solutions. It explains that the vertex is the highest or lowest point and its x-coordinate is the axis of symmetry. The solutions are the x-values where the parabola crosses the x-axis. Examples show how to identify the vertex and whether the function has a maximum or minimum. The last example demonstrates graphing a quadratic function using a table of values.