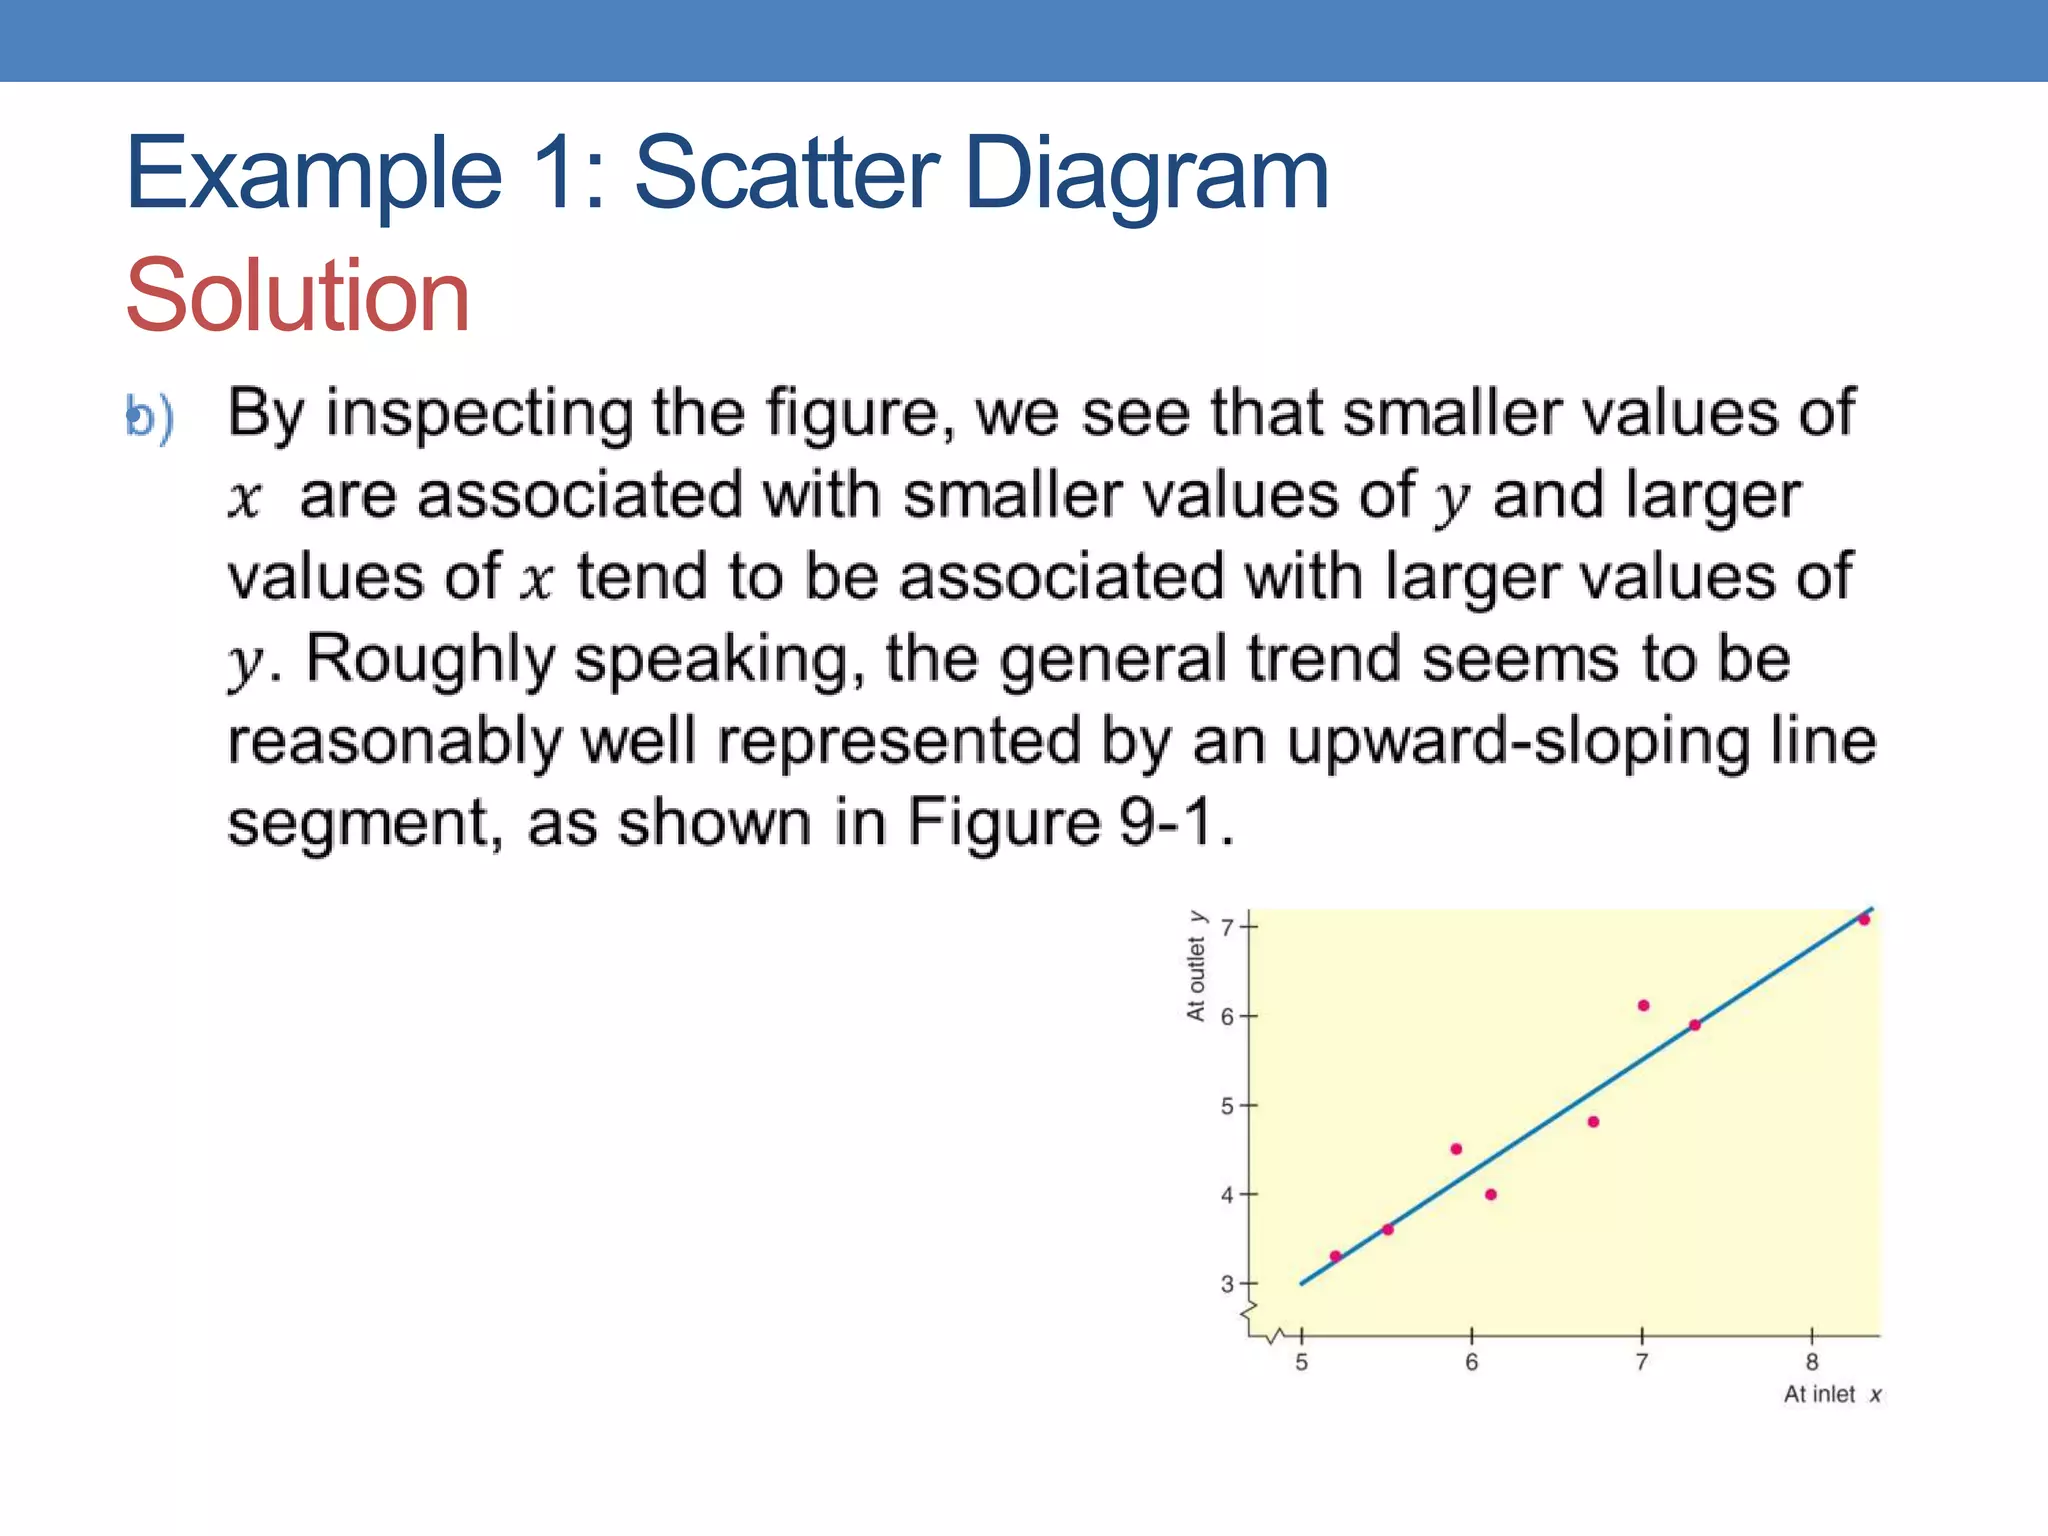
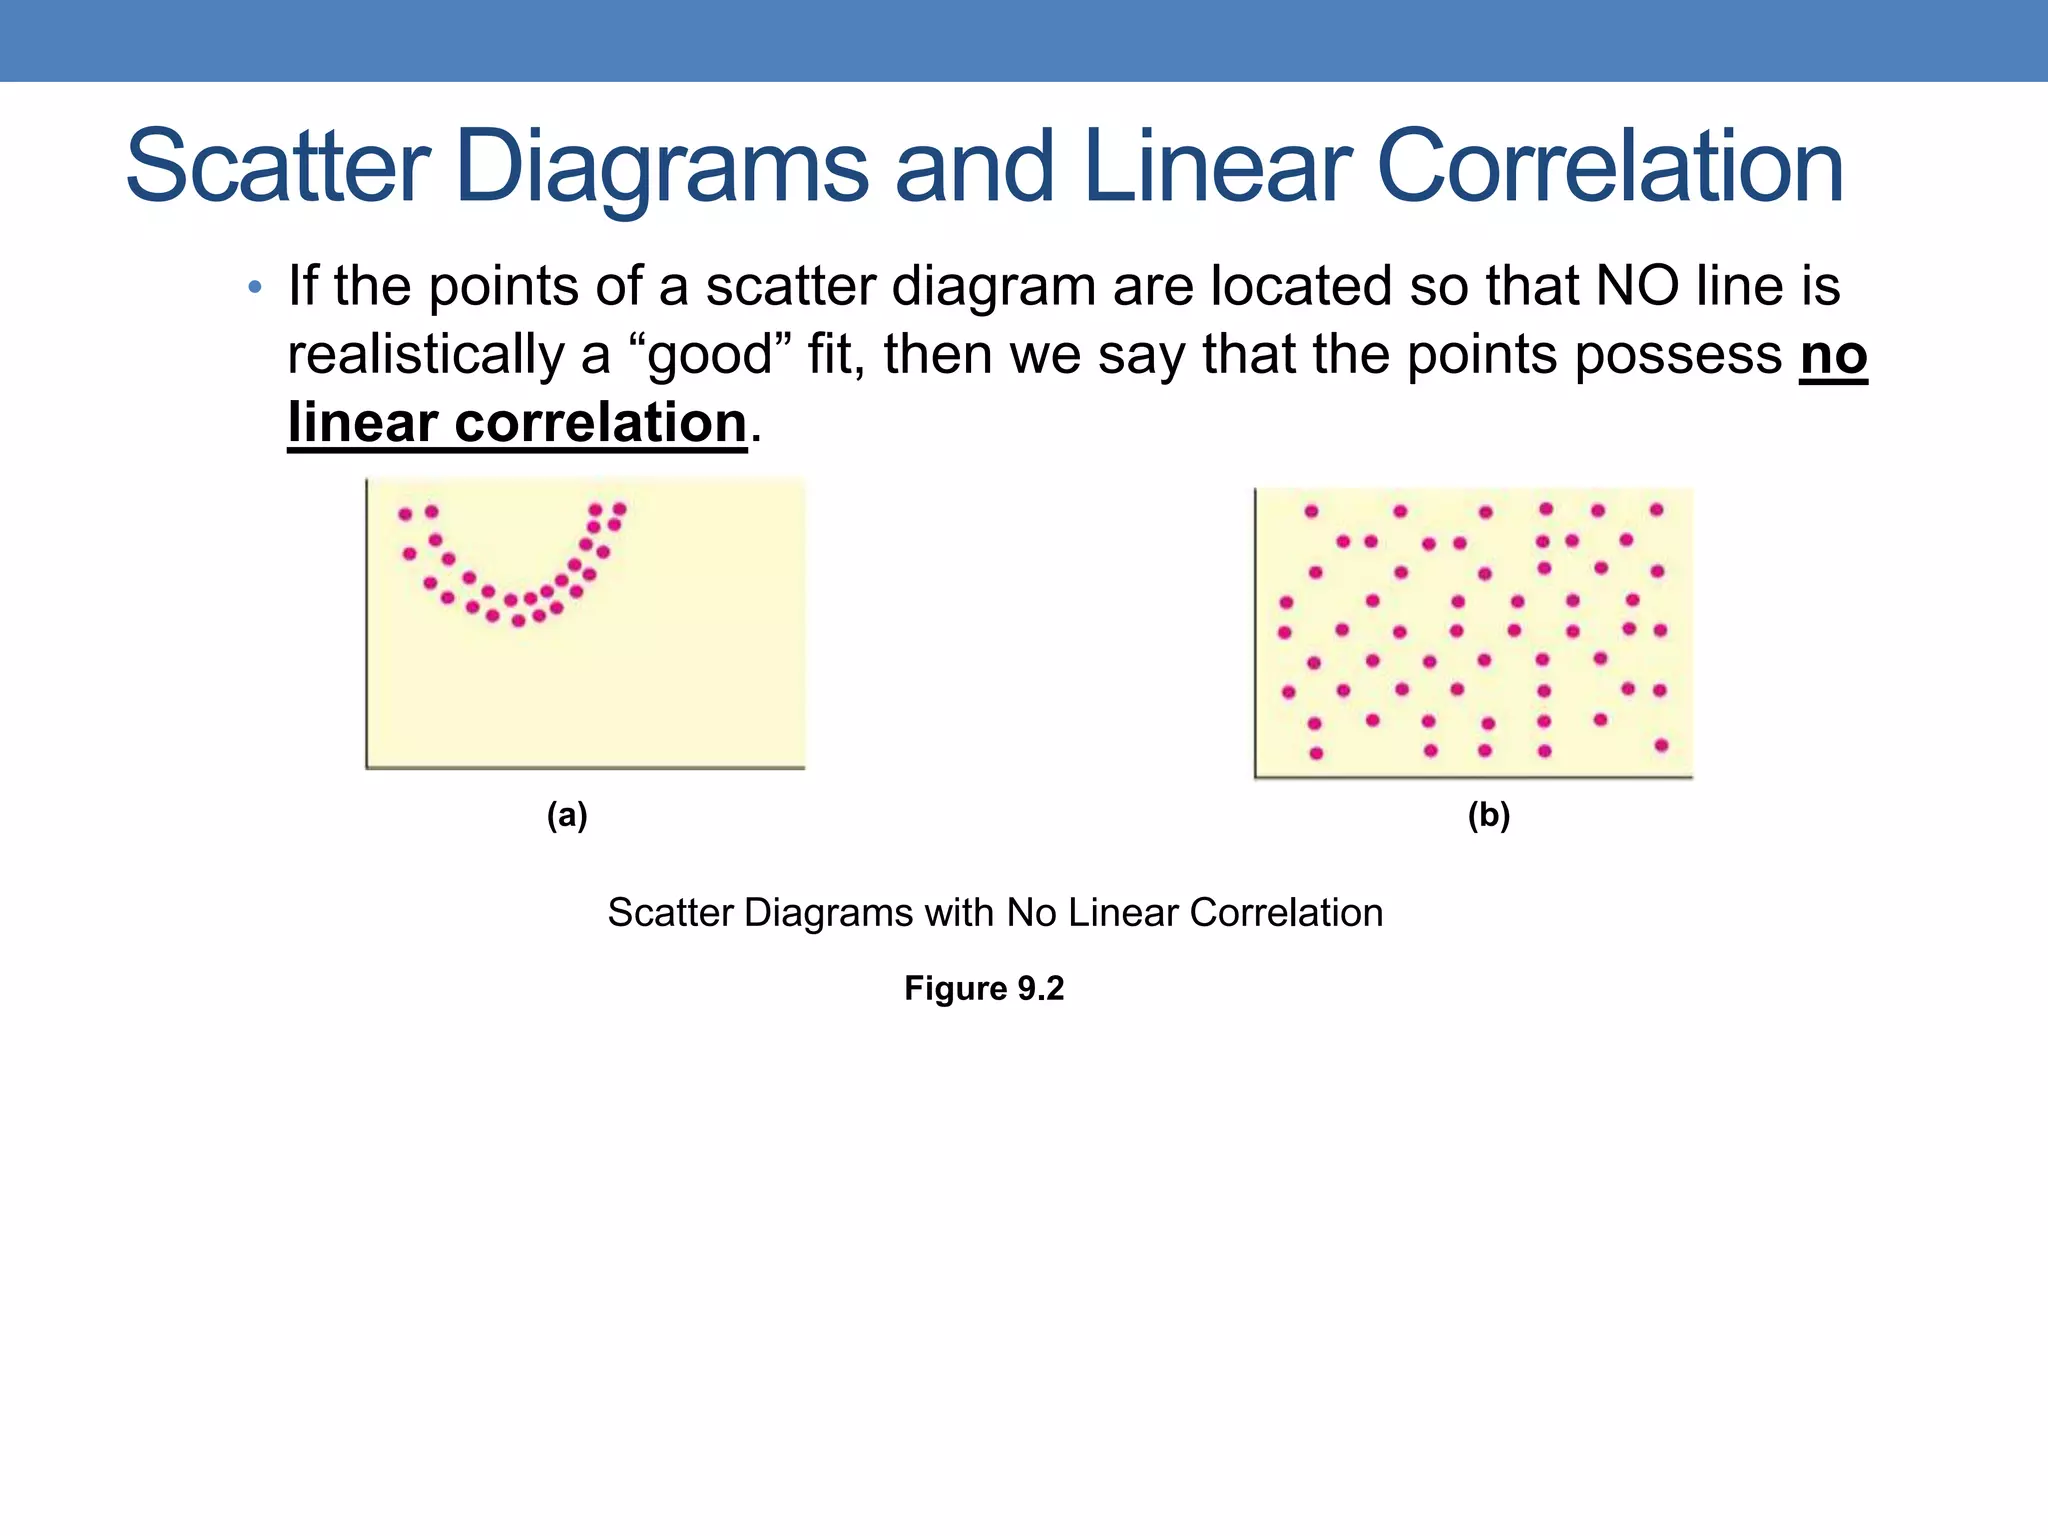
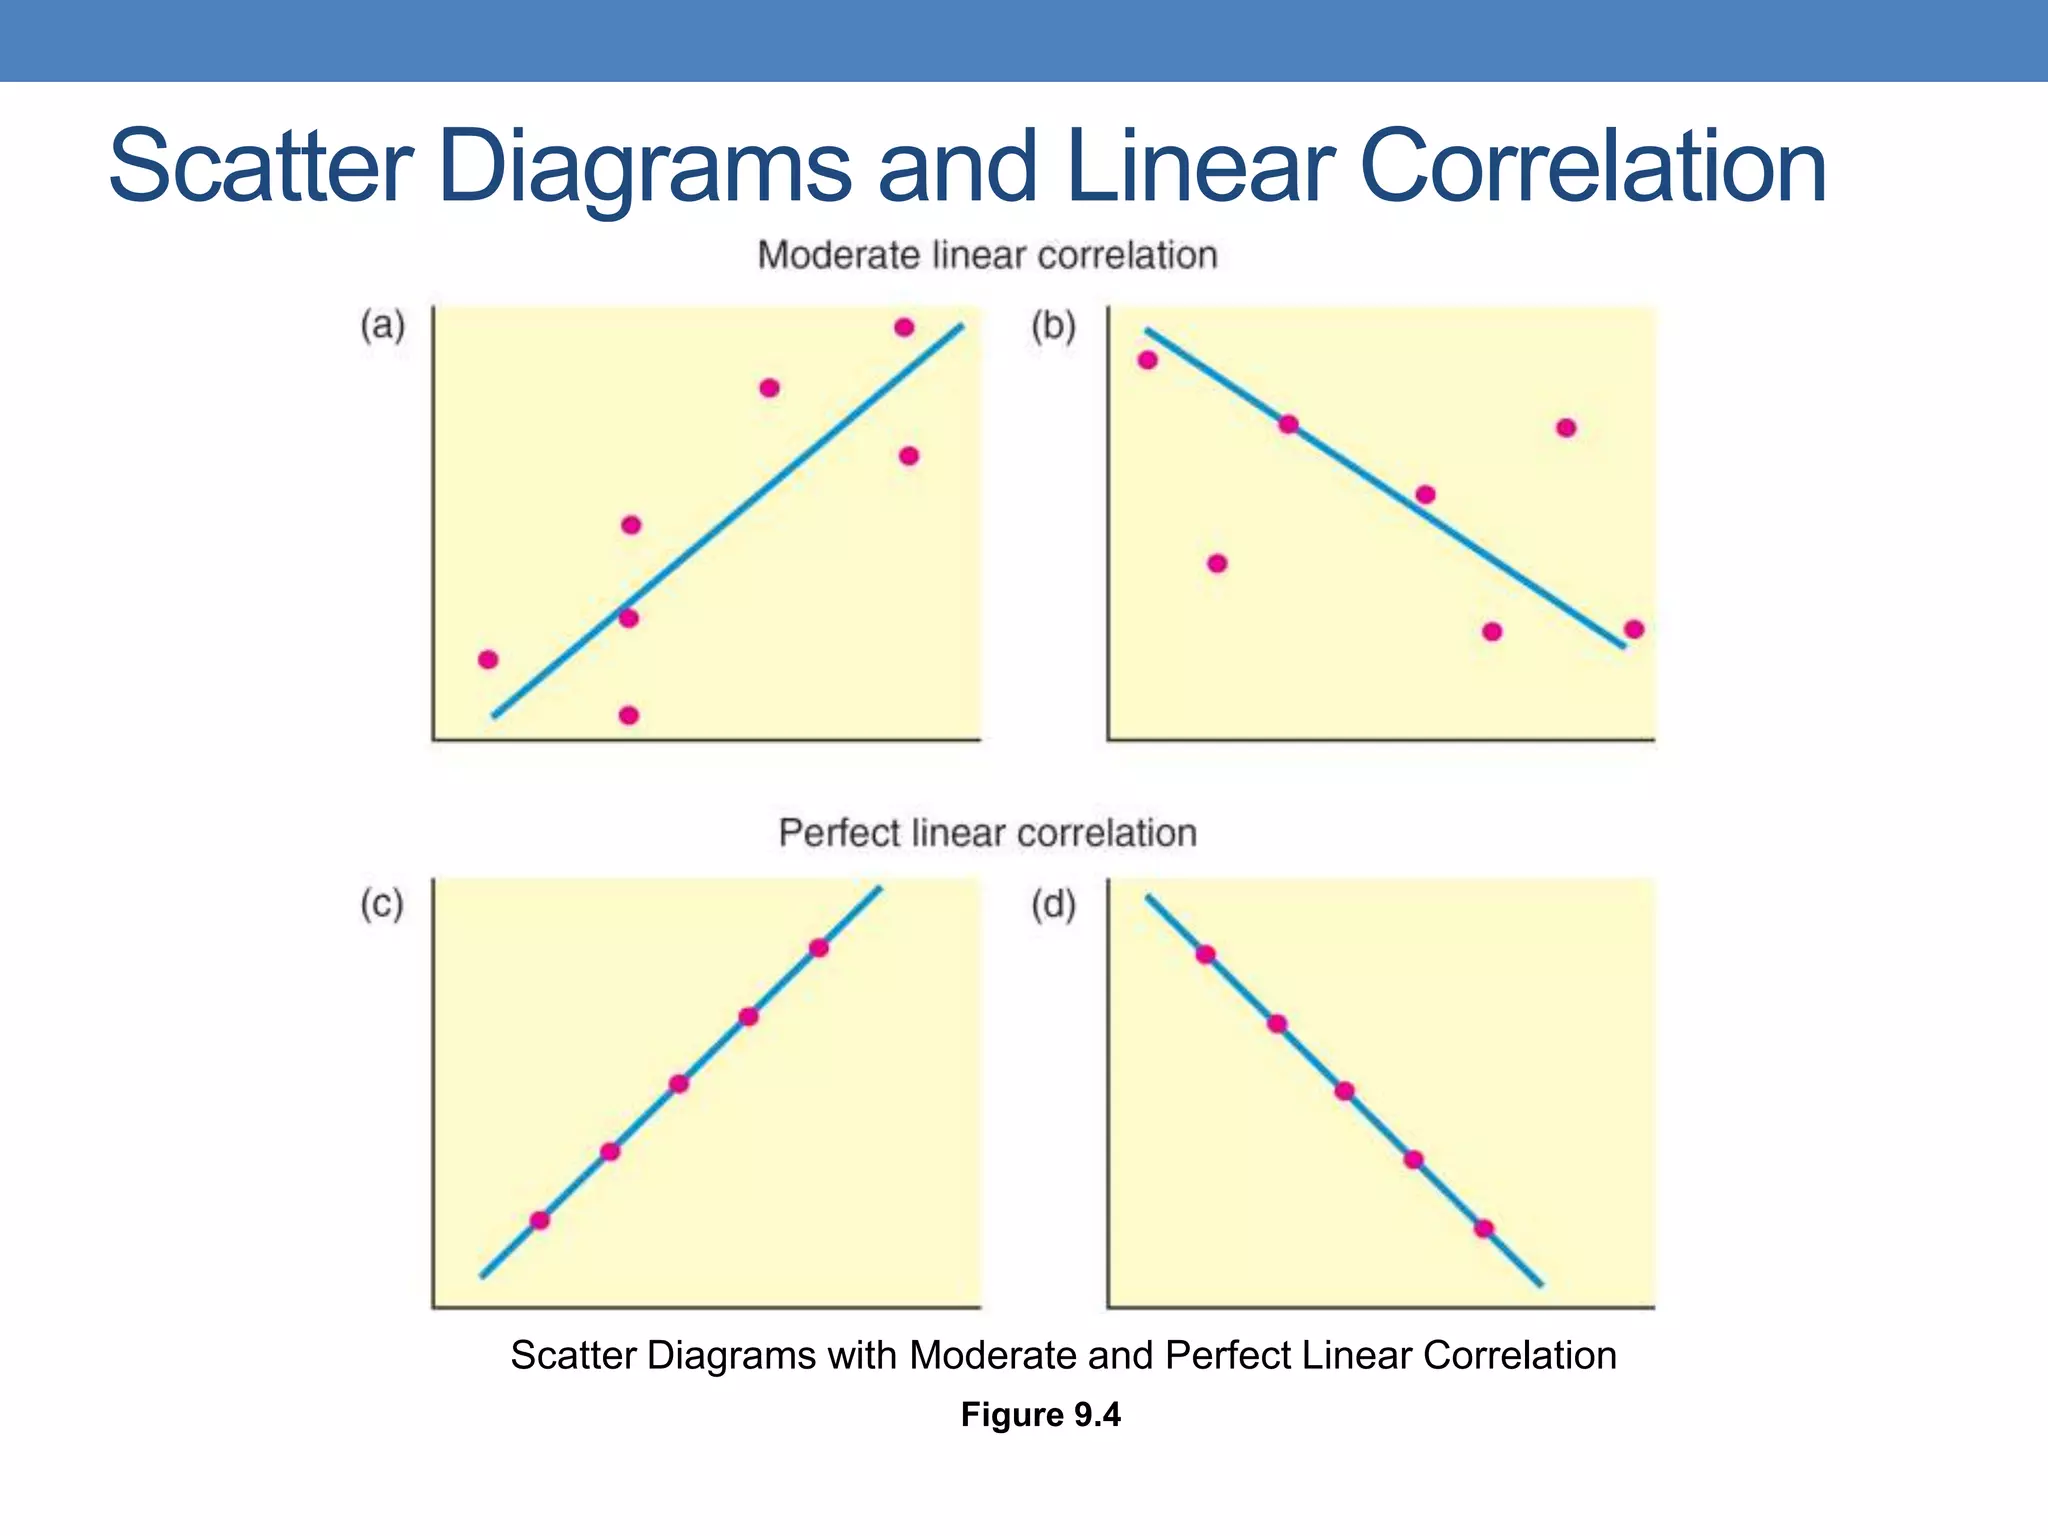
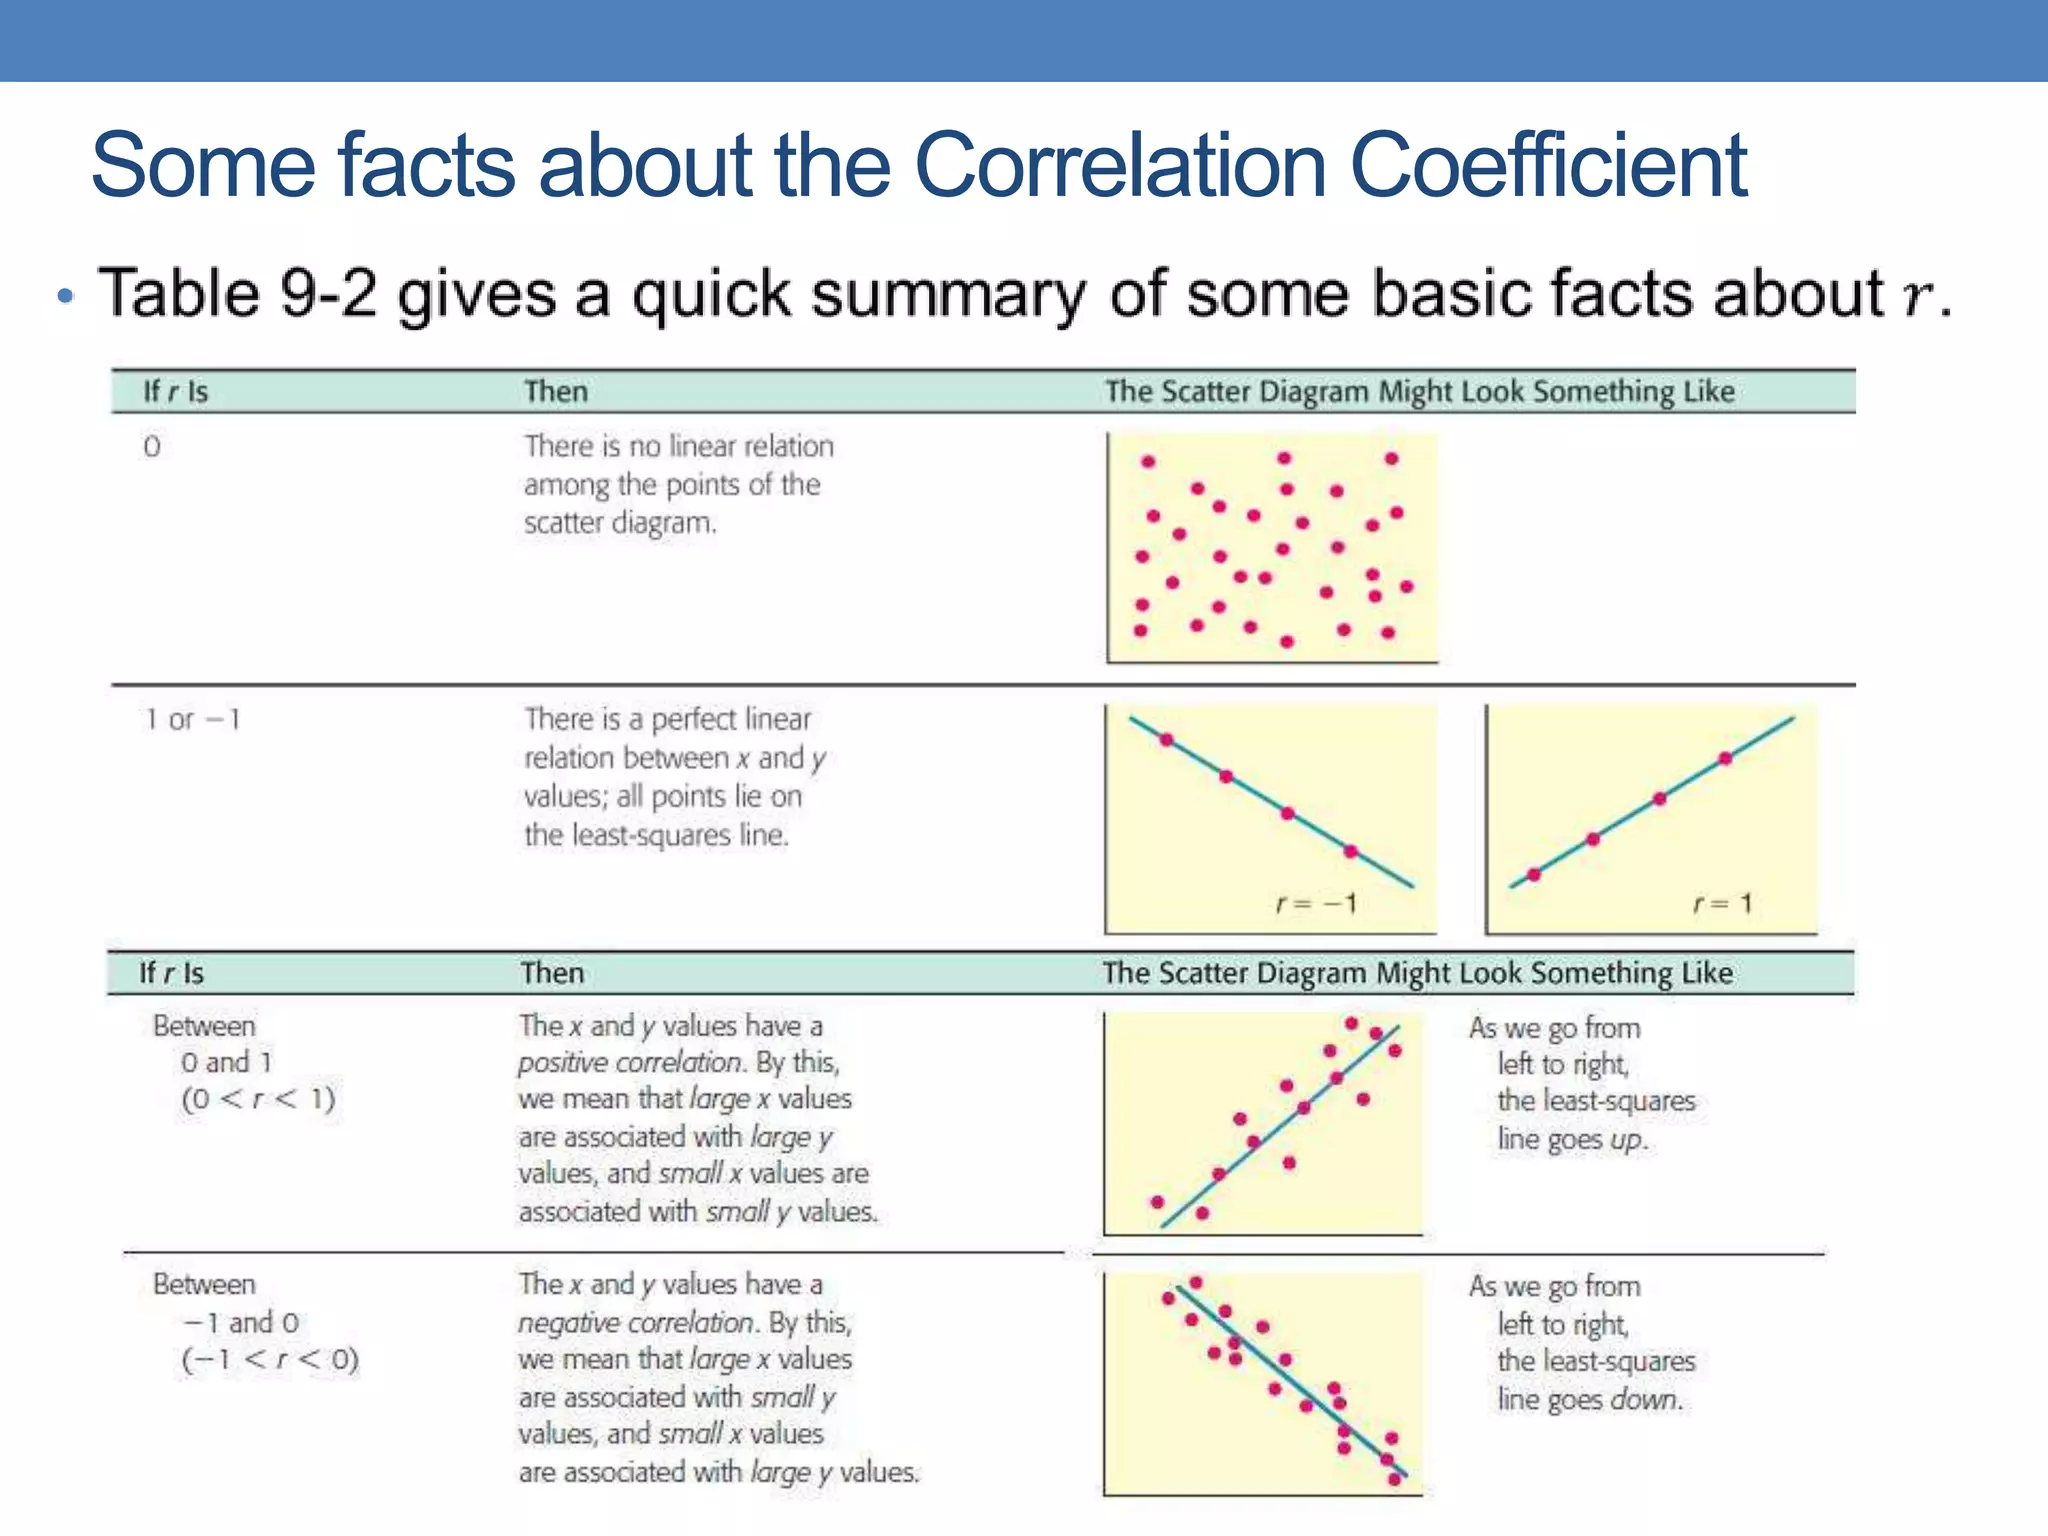
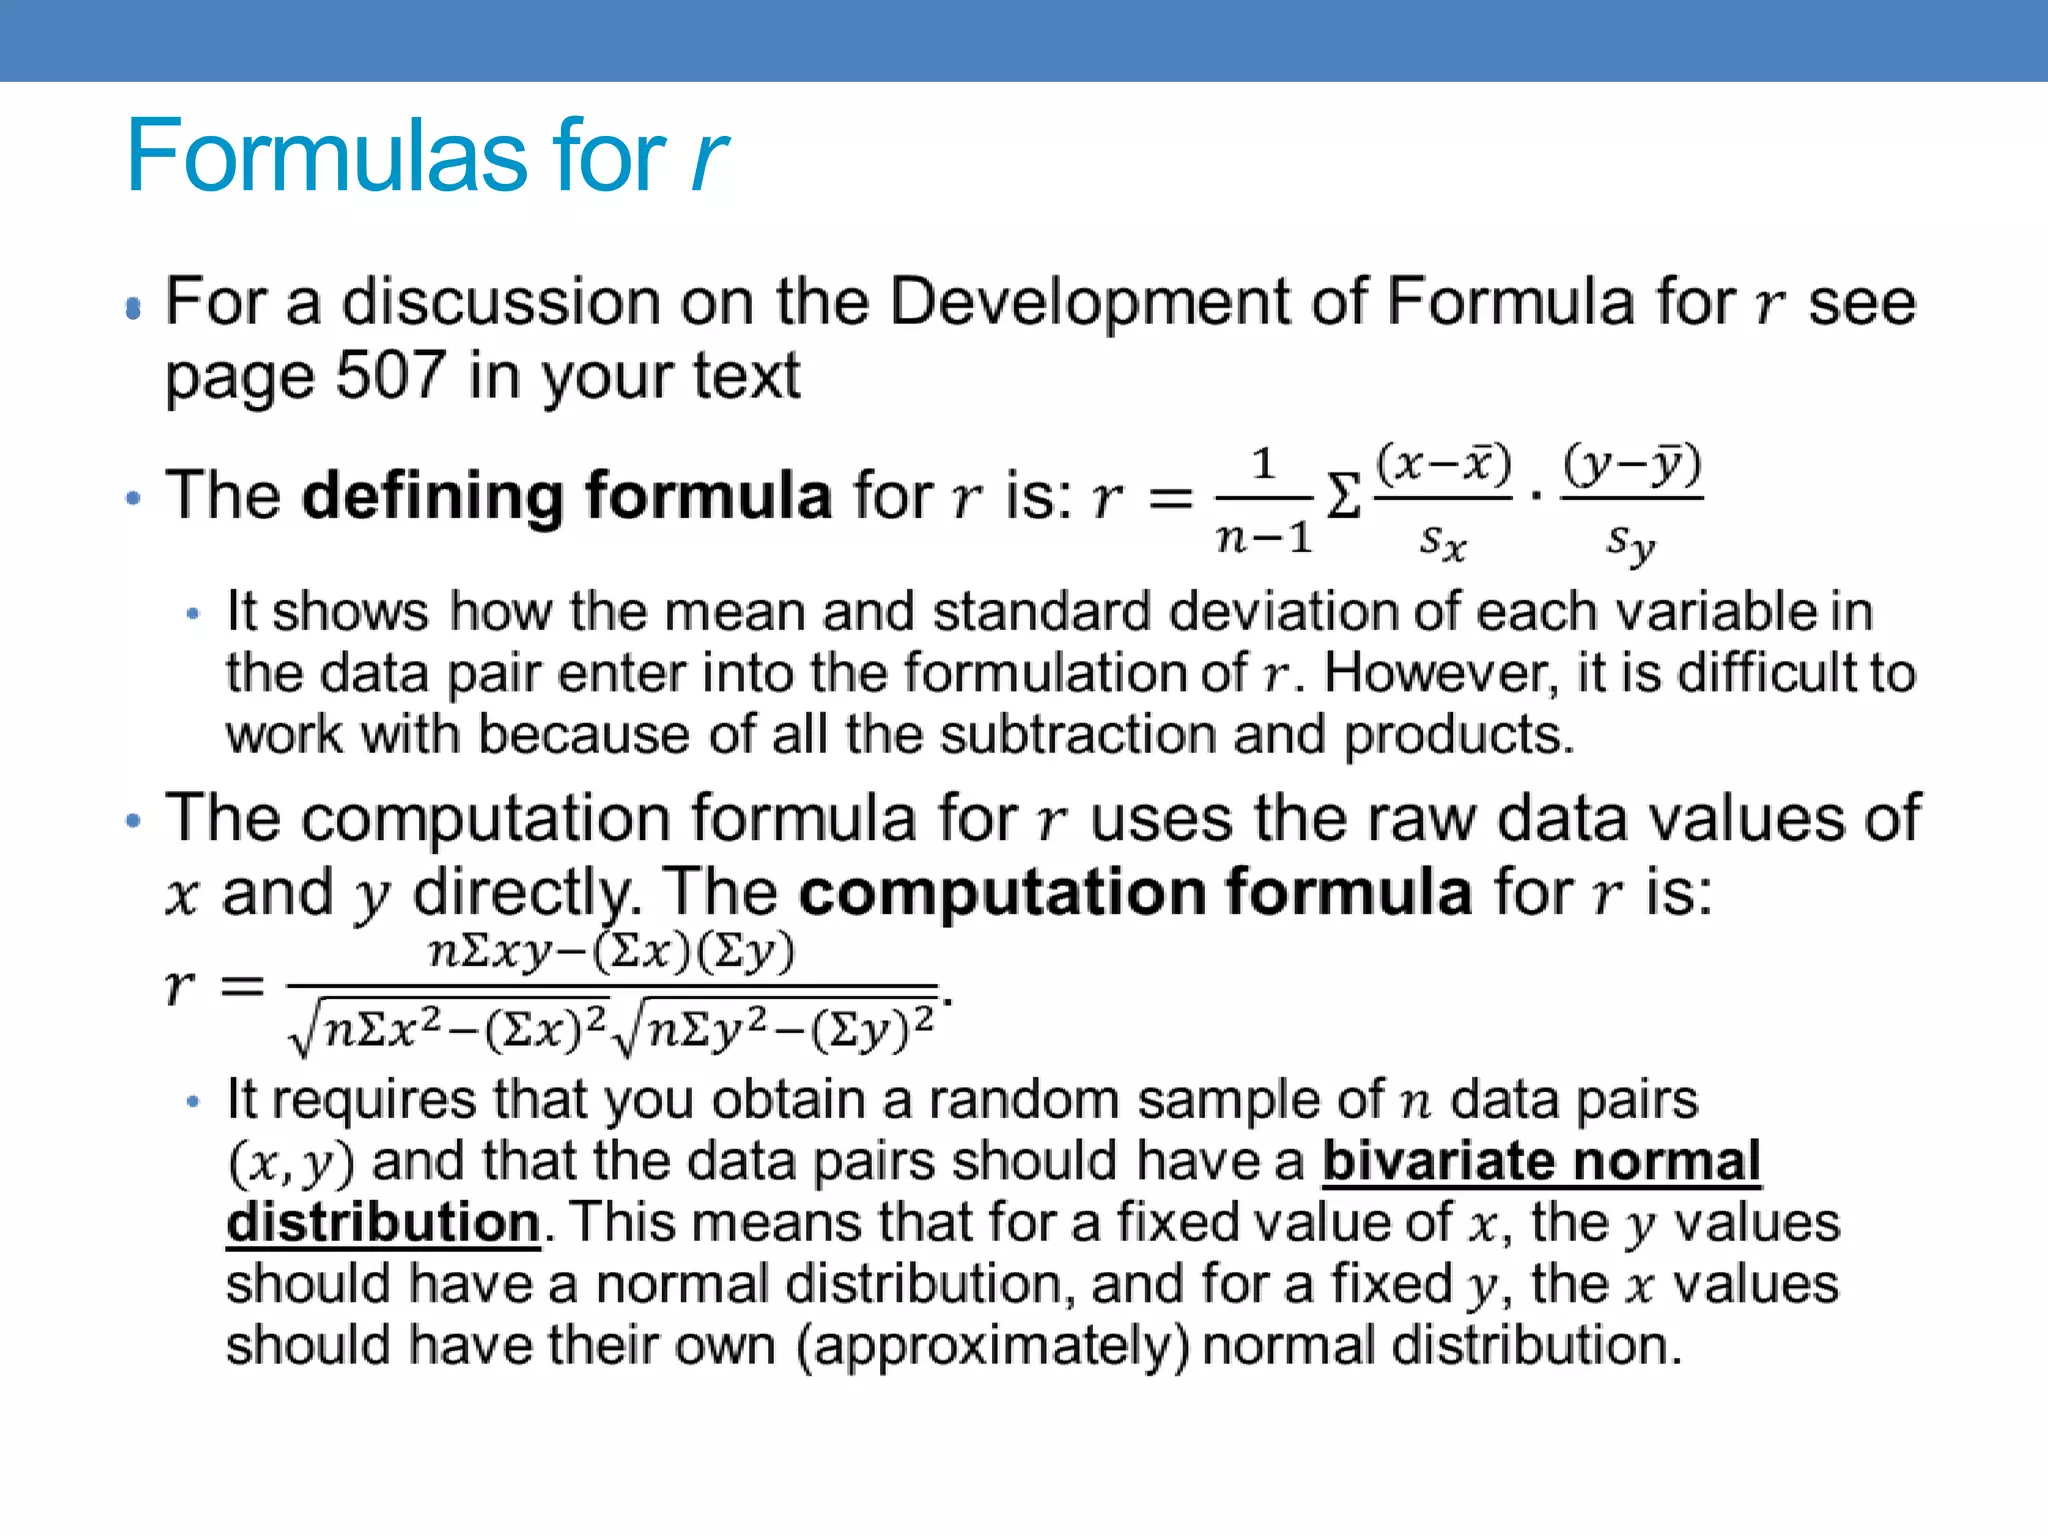
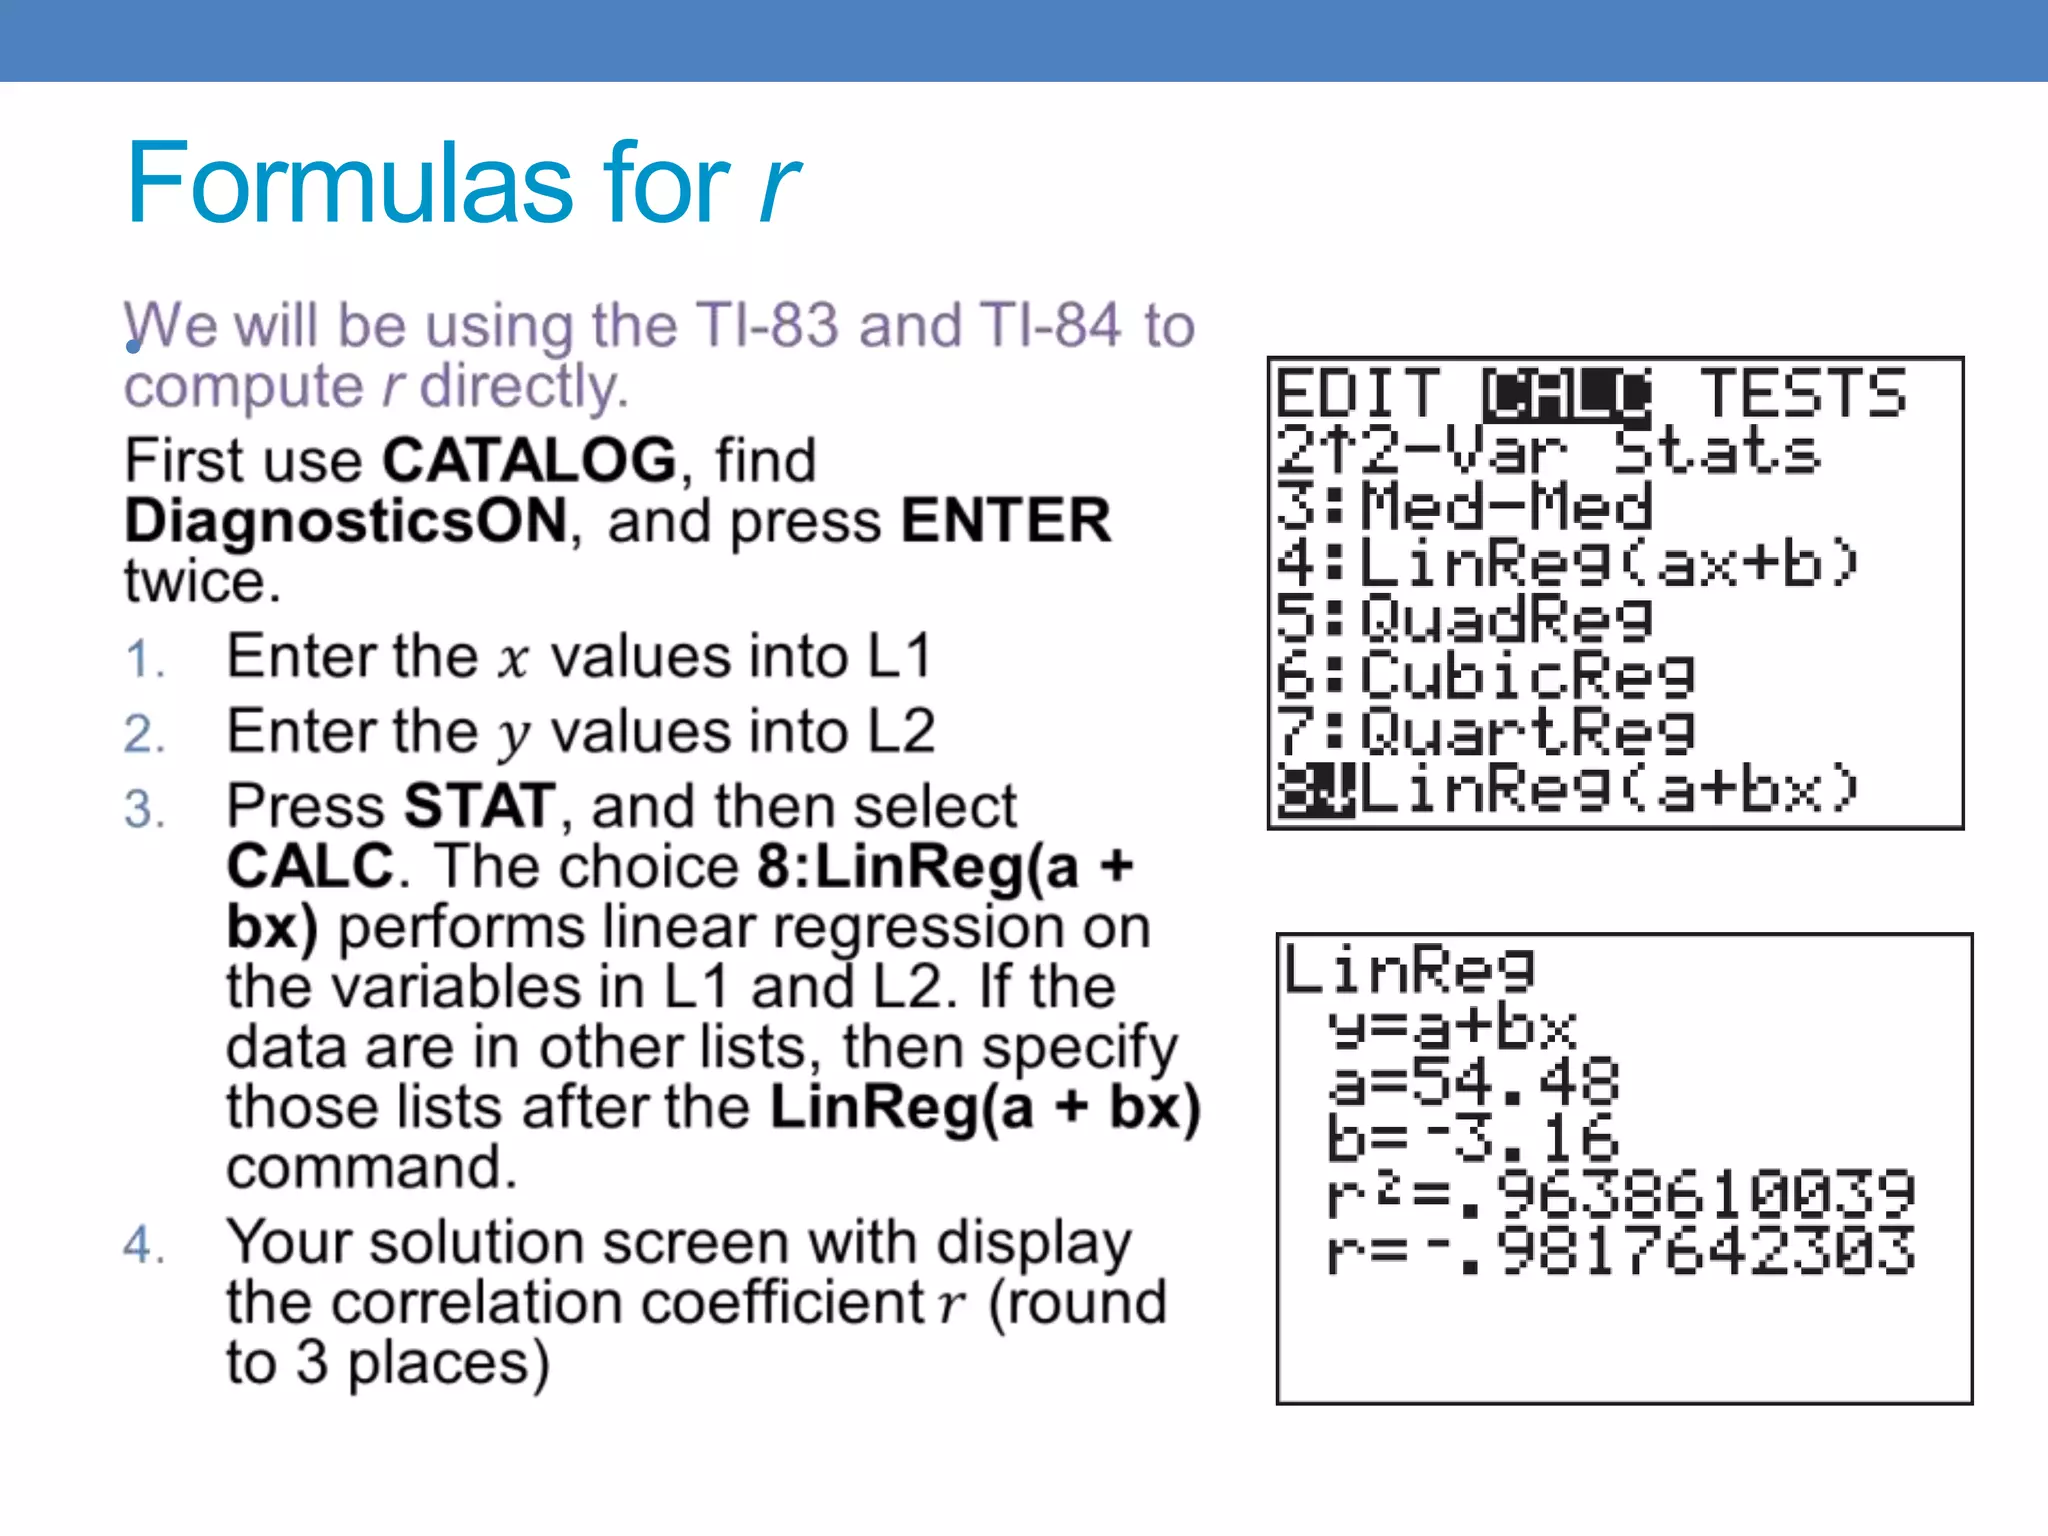
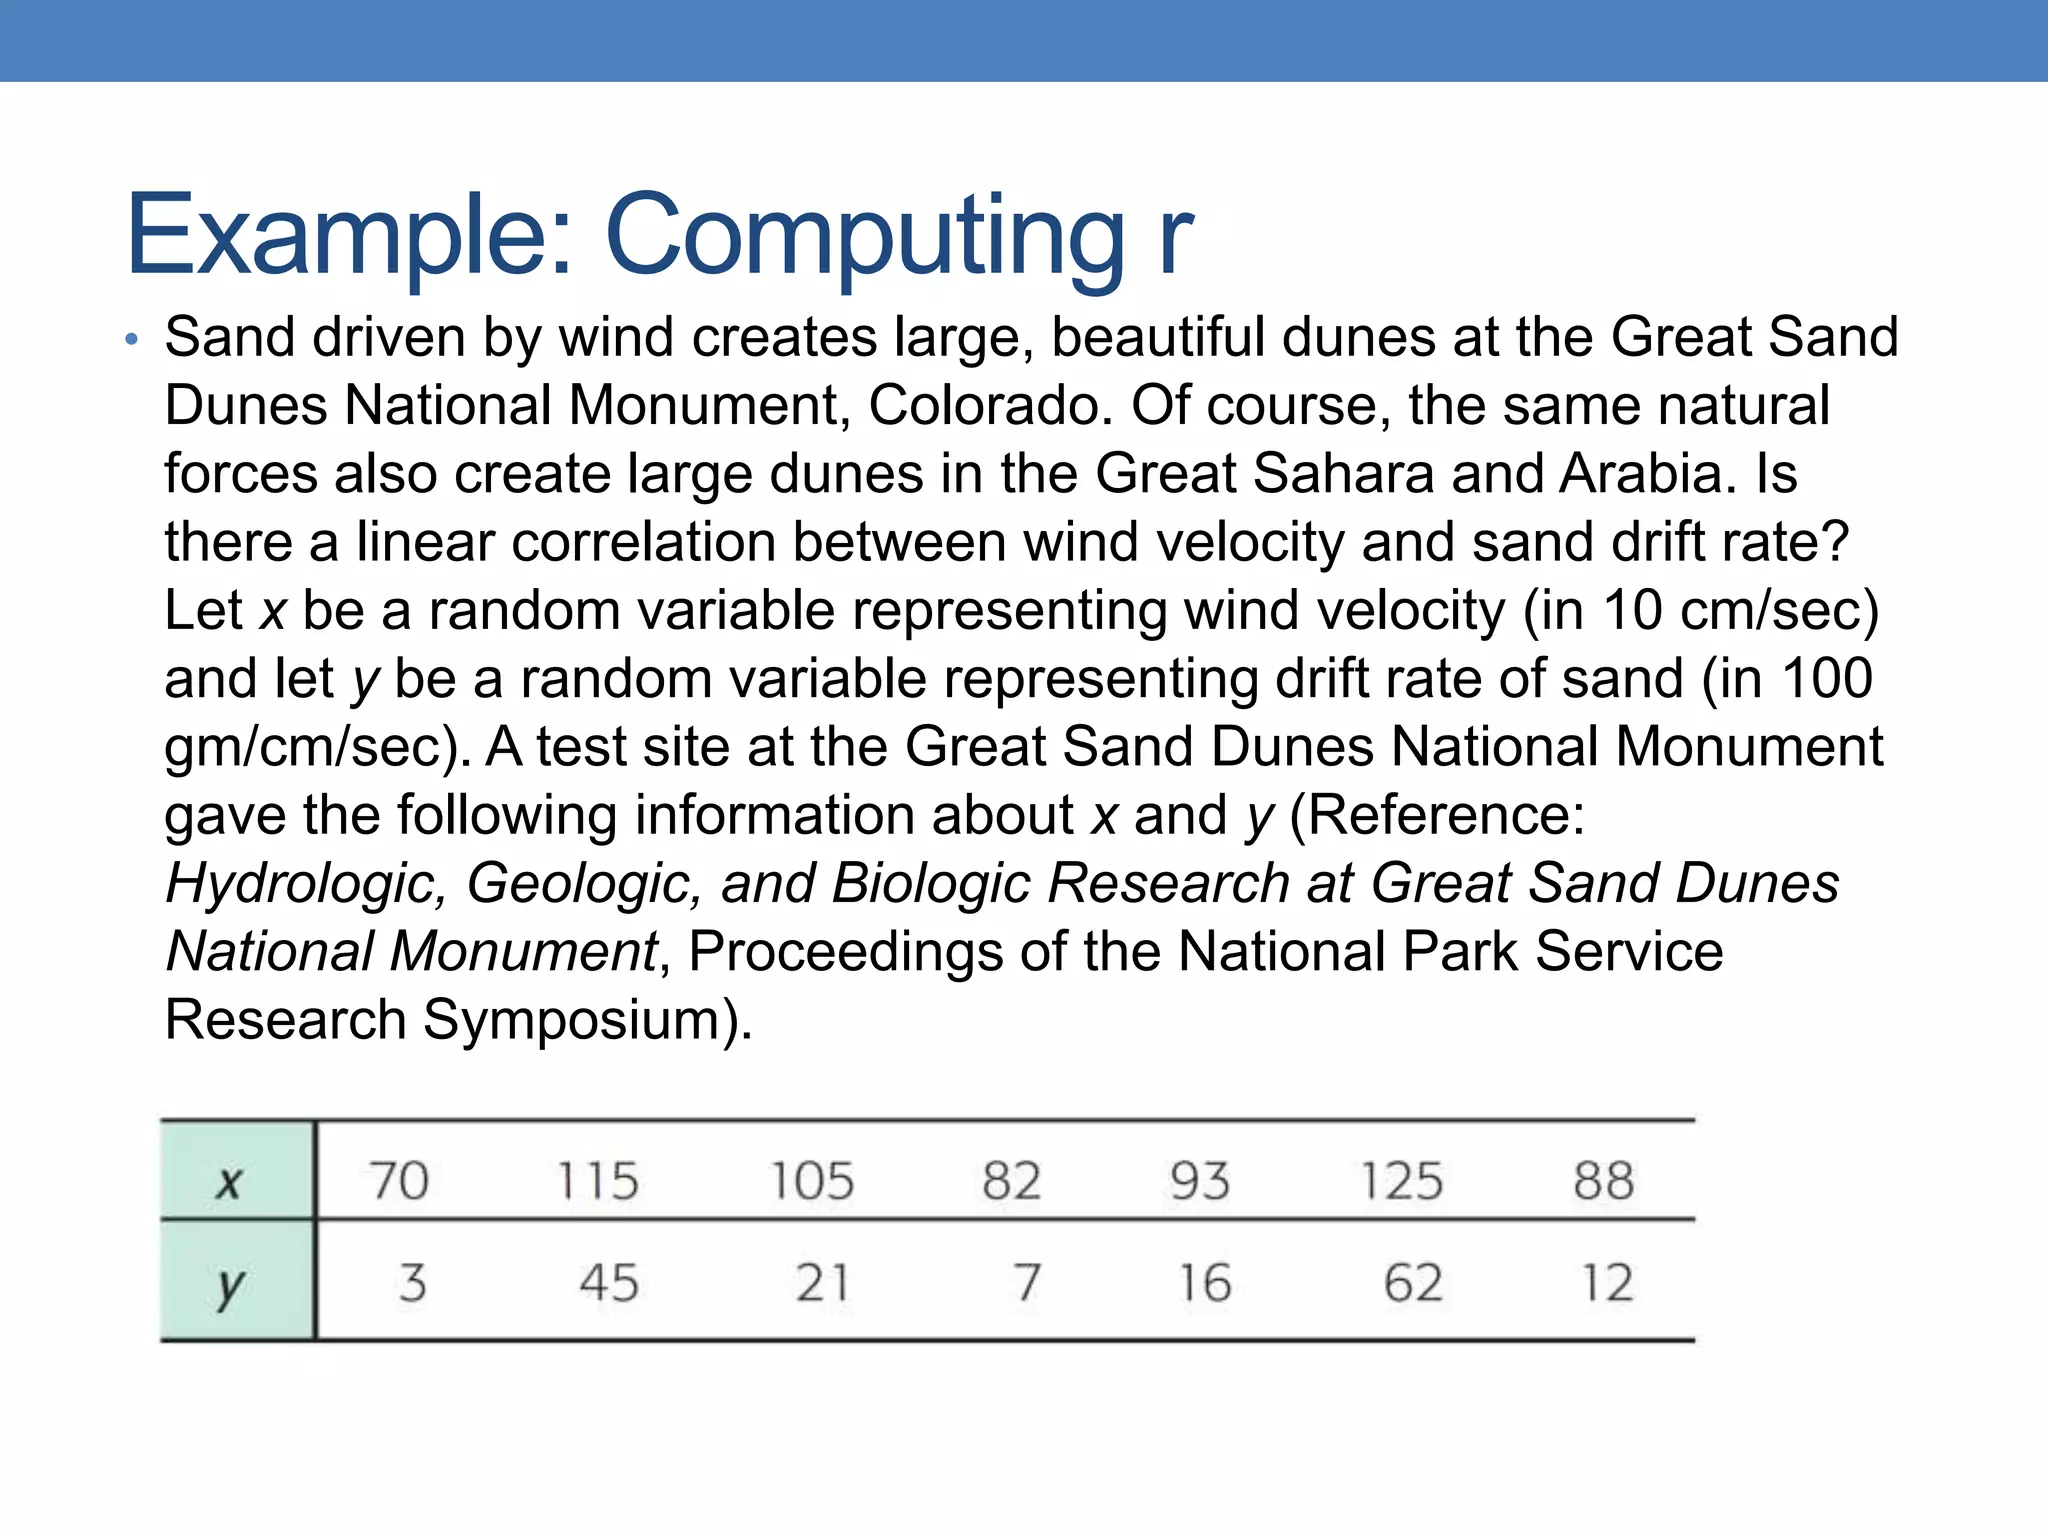
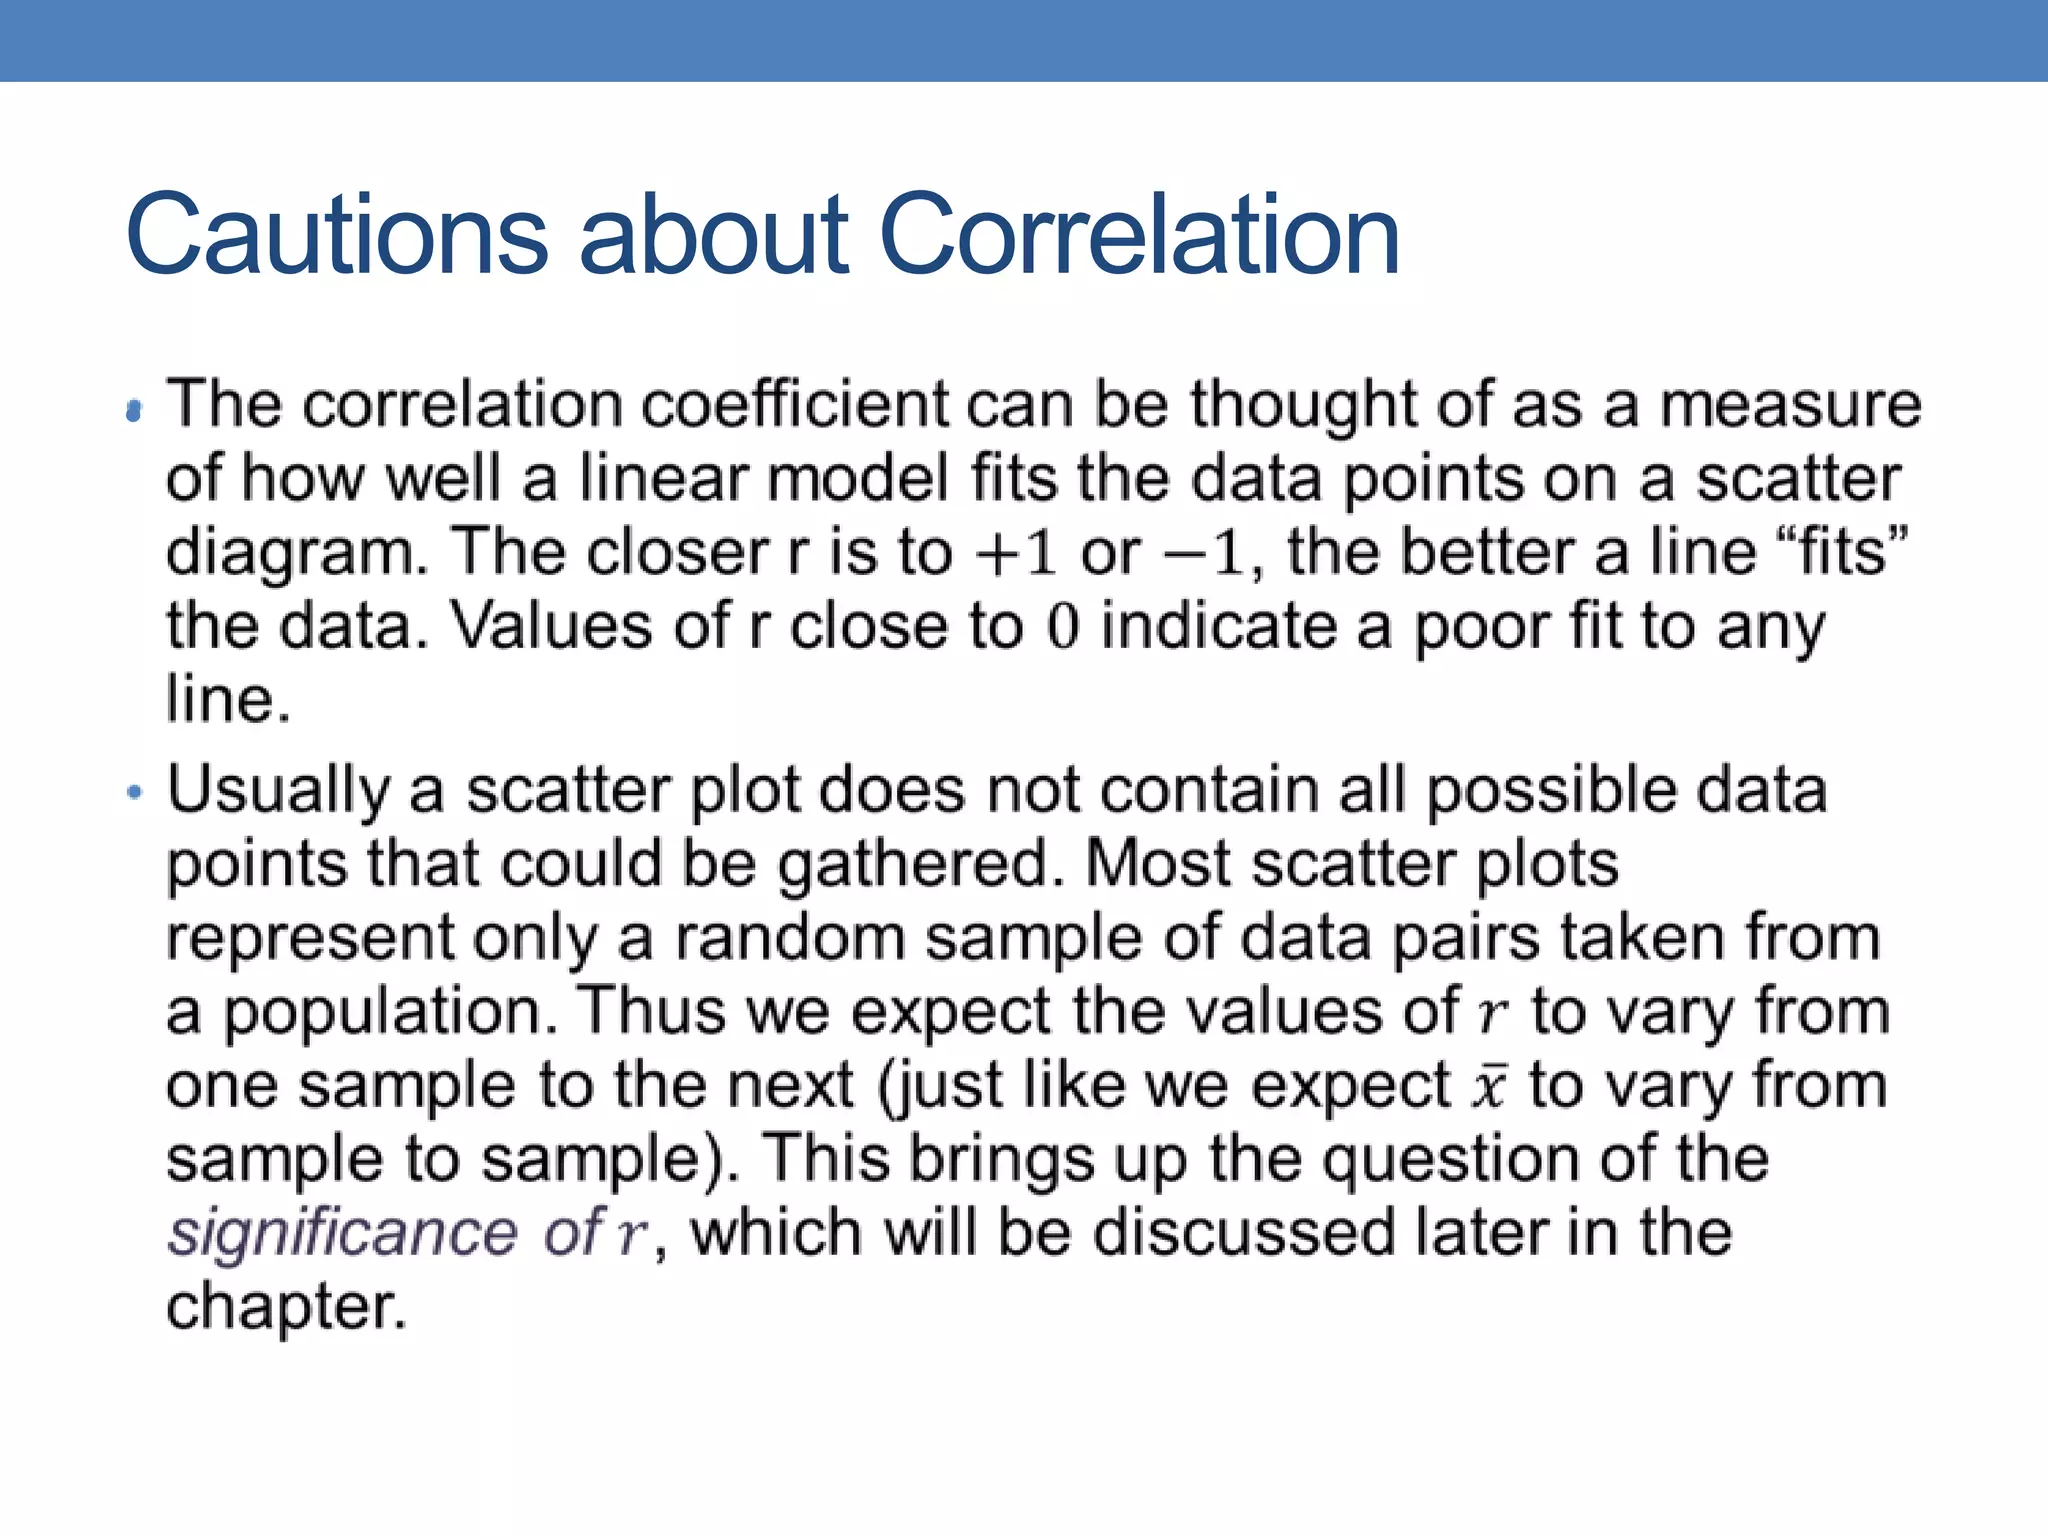
9.1 SCATTER
DIAGRAMS AND
LINEAR CORRELATION
Scatter Diagrams
•
Example 1: Scatter Diagram
•
Example 1: Scatter Diagram
Solution
a) The values in the table make ordered pairs. To make
   the scatter diagram, scan the data and choose an
   appropriate scale for each axis.
                                   Phosphorous Reduction (100 mg/l)
                                                Figure 9.1


                                    The line segment shows
                                    the basic trend.
Example 1: Scatter Diagram
Solution
•
Scatter Diagrams and Linear Correlation
•
Scatter Diagrams and Linear Correlation
  • If the points of a scatter diagram are located so that NO line is
   realistically a “good” fit, then we say that the points possess no
   linear correlation.


              (a)                                                 (b)

                    Scatter Diagrams with No Linear Correlation
                                    Figure 9.2
Scatter Diagrams and Linear Correlation


         Scatter Diagrams with Moderate and Perfect Linear Correlation
                                 Figure 9.4
Sample Correlation Coefficient r
•
Sample Correlation Coefficient r
•
Some facts about the Correlation Coefficient
•
Formulas for r
•
Formulas for r
•
Example: Computing r
• Sand driven by wind creates large, beautiful dunes at the Great Sand
 Dunes National Monument, Colorado. Of course, the same natural
 forces also create large dunes in the Great Sahara and Arabia. Is
 there a linear correlation between wind velocity and sand drift rate?
 Let x be a random variable representing wind velocity (in 10 cm/sec)
 and let y be a random variable representing drift rate of sand (in 100
 gm/cm/sec). A test site at the Great Sand Dunes National Monument
 gave the following information about x and y (Reference:
 Hydrologic, Geologic, and Biologic Research at Great Sand Dunes
 National Monument, Proceedings of the National Park Service
 Research Symposium).
Cautions about Correlation
•
Causation
• The correlation coefficient is a mathematical tool for
 measuring the strength of a linear relationship between
 two variables.
  • It makes no implication about cause or effect.
• The fact that two variables tend to increase or decrease
  together does not mean that a change in one is causing a
  change in the other.
• A strong correlation between x and y is sometimes due to
  other (either known or unknown) variables. Such variables
  are called lurking variables.

9.1

  • 1.
  • 2.
  • 3.
    Example 1: ScatterDiagram •
  • 4.
    Example 1: ScatterDiagram Solution a) The values in the table make ordered pairs. To make the scatter diagram, scan the data and choose an appropriate scale for each axis. Phosphorous Reduction (100 mg/l) Figure 9.1 The line segment shows the basic trend.
  • 5.
    Example 1: ScatterDiagram Solution •
  • 6.
    Scatter Diagrams andLinear Correlation •
  • 7.
    Scatter Diagrams andLinear Correlation • If the points of a scatter diagram are located so that NO line is realistically a “good” fit, then we say that the points possess no linear correlation. (a) (b) Scatter Diagrams with No Linear Correlation Figure 9.2
  • 8.
    Scatter Diagrams andLinear Correlation
  • 9.
    Scatter Diagrams andLinear Correlation Scatter Diagrams with Moderate and Perfect Linear Correlation Figure 9.4
  • 10.
  • 11.
  • 12.
    Some facts aboutthe Correlation Coefficient •
  • 13.
  • 14.
  • 15.
    Example: Computing r •Sand driven by wind creates large, beautiful dunes at the Great Sand Dunes National Monument, Colorado. Of course, the same natural forces also create large dunes in the Great Sahara and Arabia. Is there a linear correlation between wind velocity and sand drift rate? Let x be a random variable representing wind velocity (in 10 cm/sec) and let y be a random variable representing drift rate of sand (in 100 gm/cm/sec). A test site at the Great Sand Dunes National Monument gave the following information about x and y (Reference: Hydrologic, Geologic, and Biologic Research at Great Sand Dunes National Monument, Proceedings of the National Park Service Research Symposium).
  • 16.
  • 17.
    Causation • The correlationcoefficient is a mathematical tool for measuring the strength of a linear relationship between two variables. • It makes no implication about cause or effect. • The fact that two variables tend to increase or decrease together does not mean that a change in one is causing a change in the other. • A strong correlation between x and y is sometimes due to other (either known or unknown) variables. Such variables are called lurking variables.