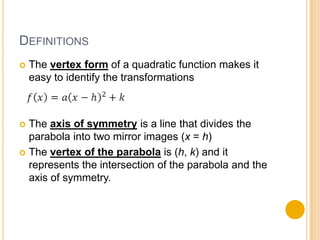
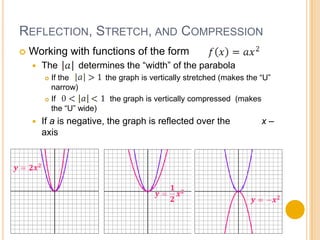
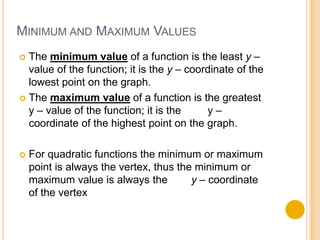
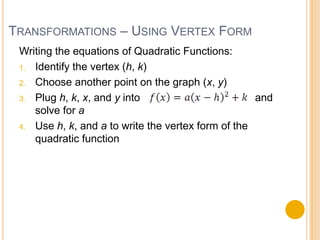
CHAPTER 4 QUADRATIC FUNCTIONS
AND EQUATIONS
4.1 Quadratic Functions and Transformations
DEFINITIONS
   A parabola is the graph of a quadratic function.
       A parabola is a “U” shaped graph

       The parent Quadratic Function is


                                    Vertex at (0, 0)
                                    Axis of Symmetry at x = 0
DEFINITIONS
   The vertex form of a quadratic function makes it
    easy to identify the transformations


 The axis of symmetry is a line that divides the
  parabola into two mirror images (x = h)
 The vertex of the parabola is (h, k) and it
  represents the intersection of the parabola and the
  axis of symmetry.
REFLECTION, STRETCH, AND COMPRESSION
   Working with functions of the form
       The      determines the “width” of the parabola
         If the          the graph is vertically stretched (makes the “U”
          narrow)
         If               the graph is vertically compressed (makes
          the “U” wide)
       If a is negative, the graph is reflected over the              x–
        axis
MINIMUM AND MAXIMUM VALUES
 The minimum value of a function is the least y –
  value of the function; it is the y – coordinate of the
  lowest point on the graph.
 The maximum value of a function is the greatest
  y – value of the function; it is the     y–
  coordinate of the highest point on the graph.

   For quadratic functions the minimum or maximum
    point is always the vertex, thus the minimum or
    maximum value is always the         y – coordinate
    of the vertex
TRANSFORMATIONS – USING VERTEX FORM
  Remember transformations from Chapter 2
  The vertex form makes identifying transformations
   easy

      a gives you information about stretch, compression, and
       reflection over the x – axis
      h gives you information about the horizontal shift
      k gives you information about the vertical shift


      The vertex is at (h, k)
      The axis of symmetry is at x = h
TRANSFORMATIONS – USING VERTEX FORM
 Graphing Quadratic Functions:
 1. Identify and Plot the vertex and axis of symmetry

 2. Set up a Table of Values. Choose x – values to the
    right and left of the vertex and find the
    corresponding y – values
 3. Plot the points and sketch the parabola
EXAMPLE: GRAPH EACH FUNCTION. DESCRIBE
HOW IT WAS TRANSLATED FROM
EXAMPLE: GRAPH EACH FUNCTION. DESCRIBE
HOW IT WAS TRANSLATED FROM
EXAMPLE: GRAPH EACH FUNCTION. DESCRIBE
HOW IT WAS TRANSLATED FROM
EXAMPLE: GRAPH EACH FUNCTION. DESCRIBE
HOW IT WAS TRANSLATED FROM
TRANSFORMATIONS – USING VERTEX FORM
 Writing the equations of Quadratic Functions:
 1. Identify the vertex (h, k)

 2. Choose another point on the graph (x, y)

 3. Plug h, k, x, and y into                        and
    solve for a
 4. Use h, k, and a to write the vertex form of the
    quadratic function
EXAMPLE: WRITE A QUADRATIC FUNCTION TO
MODEL EACH GRAPH
EXAMPLE: WRITE A QUADRATIC FUNCTION TO
MODEL EACH GRAPH

4.1 quadratic functions and transformations

  • 1.
    CHAPTER 4 QUADRATICFUNCTIONS AND EQUATIONS 4.1 Quadratic Functions and Transformations
  • 2.
    DEFINITIONS  A parabola is the graph of a quadratic function.  A parabola is a “U” shaped graph  The parent Quadratic Function is Vertex at (0, 0) Axis of Symmetry at x = 0
  • 3.
    DEFINITIONS  The vertex form of a quadratic function makes it easy to identify the transformations  The axis of symmetry is a line that divides the parabola into two mirror images (x = h)  The vertex of the parabola is (h, k) and it represents the intersection of the parabola and the axis of symmetry.
  • 4.
    REFLECTION, STRETCH, ANDCOMPRESSION  Working with functions of the form  The determines the “width” of the parabola  If the the graph is vertically stretched (makes the “U” narrow)  If the graph is vertically compressed (makes the “U” wide)  If a is negative, the graph is reflected over the x– axis
  • 5.
    MINIMUM AND MAXIMUMVALUES  The minimum value of a function is the least y – value of the function; it is the y – coordinate of the lowest point on the graph.  The maximum value of a function is the greatest y – value of the function; it is the y– coordinate of the highest point on the graph.  For quadratic functions the minimum or maximum point is always the vertex, thus the minimum or maximum value is always the y – coordinate of the vertex
  • 6.
    TRANSFORMATIONS – USINGVERTEX FORM  Remember transformations from Chapter 2  The vertex form makes identifying transformations easy  a gives you information about stretch, compression, and reflection over the x – axis  h gives you information about the horizontal shift  k gives you information about the vertical shift  The vertex is at (h, k)  The axis of symmetry is at x = h
  • 7.
    TRANSFORMATIONS – USINGVERTEX FORM Graphing Quadratic Functions: 1. Identify and Plot the vertex and axis of symmetry 2. Set up a Table of Values. Choose x – values to the right and left of the vertex and find the corresponding y – values 3. Plot the points and sketch the parabola
  • 8.
    EXAMPLE: GRAPH EACHFUNCTION. DESCRIBE HOW IT WAS TRANSLATED FROM
  • 9.
    EXAMPLE: GRAPH EACHFUNCTION. DESCRIBE HOW IT WAS TRANSLATED FROM
  • 10.
    EXAMPLE: GRAPH EACHFUNCTION. DESCRIBE HOW IT WAS TRANSLATED FROM
  • 11.
    EXAMPLE: GRAPH EACHFUNCTION. DESCRIBE HOW IT WAS TRANSLATED FROM
  • 12.
    TRANSFORMATIONS – USINGVERTEX FORM Writing the equations of Quadratic Functions: 1. Identify the vertex (h, k) 2. Choose another point on the graph (x, y) 3. Plug h, k, x, and y into and solve for a 4. Use h, k, and a to write the vertex form of the quadratic function
  • 13.
    EXAMPLE: WRITE AQUADRATIC FUNCTION TO MODEL EACH GRAPH
  • 14.
    EXAMPLE: WRITE AQUADRATIC FUNCTION TO MODEL EACH GRAPH