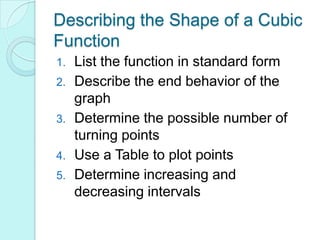
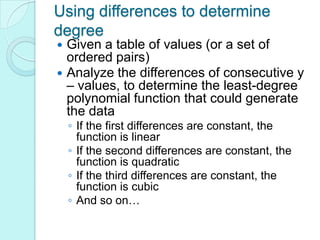
This document discusses how to describe the shape of a cubic function by listing it in standard form, describing the end behavior of the graph, determining the possible number of turning points using a table of values, and determining the increasing and decreasing intervals. It explains that to describe the shape, you identify the sign of the leading coefficient to determine the end behavior and the number of turning points, which is one less than the possible degree. The document also discusses using differences of consecutive y-values in a table to determine the least degree of the polynomial function that could generate the data, with constant first differences indicating linear, constant second differences indicating quadratic, and constant third differences indicating cubic.


![5.1[1]](https://cdn.slidesharecdn.com/ss_thumbnails/5-11-121219075353-phpapp01-thumbnail.jpg?width=640&height=640&fit=bounds)


