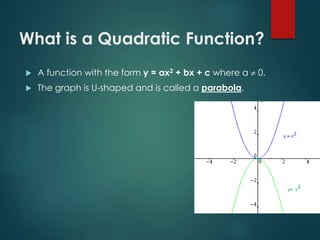
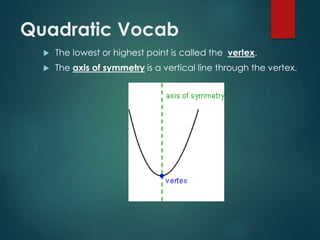
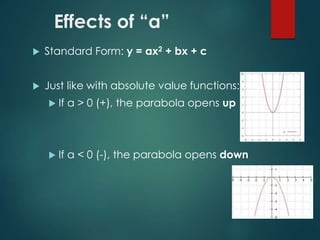
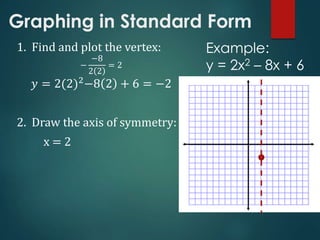
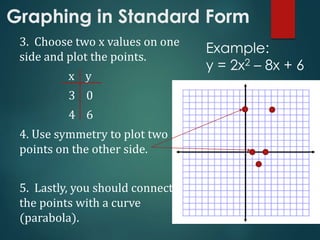
Basics of Graphing
Quadratic Functionsadapted from hisema01
What is a Quadratic Function?
 A function with the form y = ax2 + bx + c where a  0.
 The graph is U-shaped and is called a parabola.
Why Study Quadratics?
 Many things we see every day are modeled by
quadratic functions.
 What are some examples?
 Water in a drinking fountain
 The McDonald’s Golden Arches
 The path of a basketball
Quadratic Vocab
 The lowest or highest point is called the vertex.
 The axis of symmetry is a vertical line through the vertex.
Effects of “a”
 Standard Form: y = ax2 + bx + c
 Just like with absolute value functions:
 If a > 0 (+), the parabola opens up
 If a < 0 (-), the parabola opens down
Effects of “a”
 Standard Form: y = ax2 + bx + c
 Just like with absolute value functions:
 If |a| < 1, the parabola is wider than y = x2
because it’s vertically shrunk
 If |a| > 1, the parabola is narrower than
y = x2 because it’s vertically stretched.
Effects of “c”
 Standard Form: y = ax2 + bx + c
 Just like with absolute value functions:
 If c < 1, the parabola is shifted down c units
 If c > 1, the parabola is shifted up c units
Finding the Vertex
 The x-coordinate of the vertex is −
𝑏
2𝑎
 To find the y, plug the x-coordinate into the equation.
 Axis of symmetry is the line x = −
𝑏
2𝑎
Graphing in Standard Form
1. Find and plot the vertex:
−
−8
2 2
= 2
𝑦 = 2(2)2−8 2 + 6 = −2
2. Draw the axis of symmetry:
x = 2
Example:
y = 2x2 – 8x + 6
Graphing in Standard Form
3. Choose two x values on one
side and plot the points.
x y
3 0
4 6
4. Use symmetry to plot two
points on the other side.
5. Lastly, you should connect
the points with a curve
(parabola).
Example:
y = 2x2 – 8x + 6

Graphing Quadratic Functions

  • 1.
    Basics of Graphing QuadraticFunctionsadapted from hisema01
  • 2.
    What is aQuadratic Function?  A function with the form y = ax2 + bx + c where a  0.  The graph is U-shaped and is called a parabola.
  • 3.
    Why Study Quadratics? Many things we see every day are modeled by quadratic functions.  What are some examples?  Water in a drinking fountain  The McDonald’s Golden Arches  The path of a basketball
  • 4.
    Quadratic Vocab  Thelowest or highest point is called the vertex.  The axis of symmetry is a vertical line through the vertex.
  • 5.
    Effects of “a” Standard Form: y = ax2 + bx + c  Just like with absolute value functions:  If a > 0 (+), the parabola opens up  If a < 0 (-), the parabola opens down
  • 6.
    Effects of “a” Standard Form: y = ax2 + bx + c  Just like with absolute value functions:  If |a| < 1, the parabola is wider than y = x2 because it’s vertically shrunk  If |a| > 1, the parabola is narrower than y = x2 because it’s vertically stretched.
  • 7.
    Effects of “c” Standard Form: y = ax2 + bx + c  Just like with absolute value functions:  If c < 1, the parabola is shifted down c units  If c > 1, the parabola is shifted up c units
  • 8.
    Finding the Vertex The x-coordinate of the vertex is − 𝑏 2𝑎  To find the y, plug the x-coordinate into the equation.  Axis of symmetry is the line x = − 𝑏 2𝑎
  • 9.
    Graphing in StandardForm 1. Find and plot the vertex: − −8 2 2 = 2 𝑦 = 2(2)2−8 2 + 6 = −2 2. Draw the axis of symmetry: x = 2 Example: y = 2x2 – 8x + 6
  • 10.
    Graphing in StandardForm 3. Choose two x values on one side and plot the points. x y 3 0 4 6 4. Use symmetry to plot two points on the other side. 5. Lastly, you should connect the points with a curve (parabola). Example: y = 2x2 – 8x + 6