Downloaded 751 times

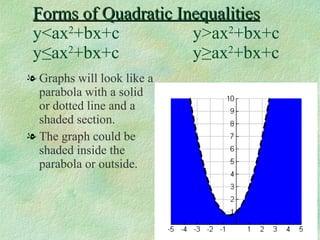
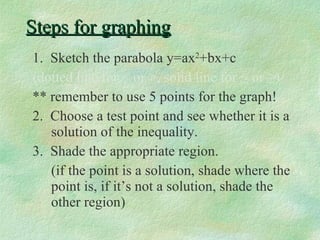
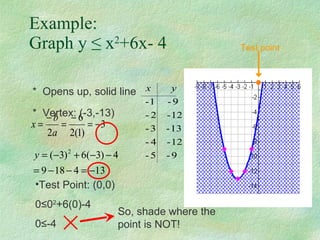
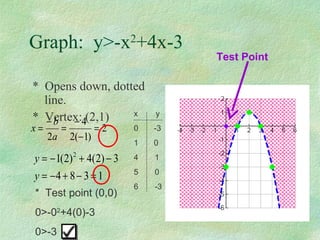
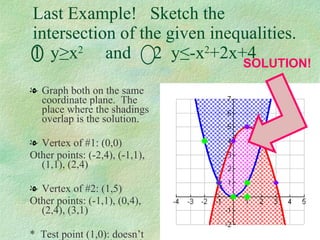

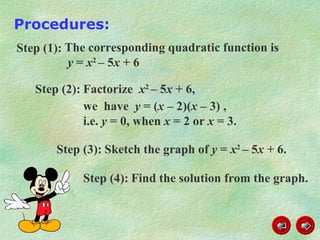
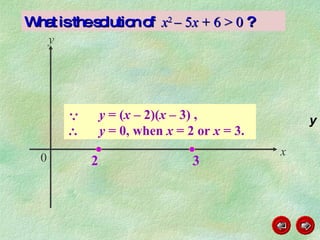
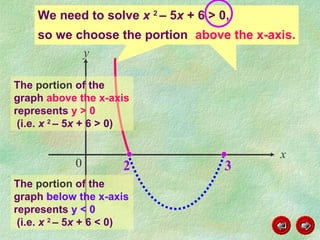
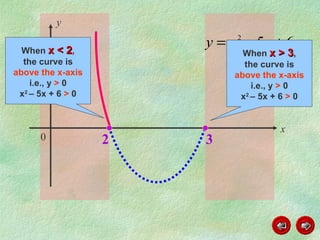

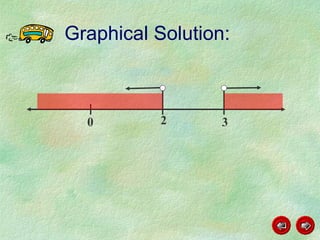
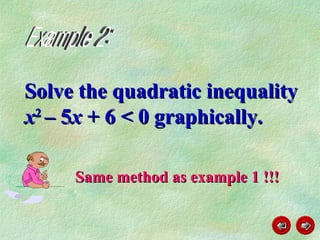
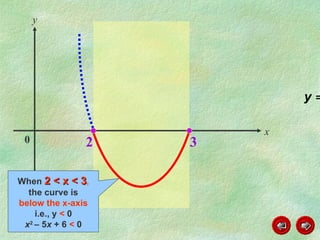

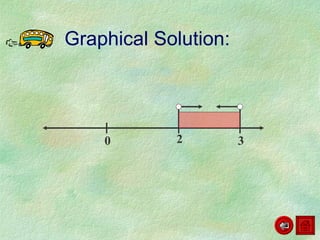
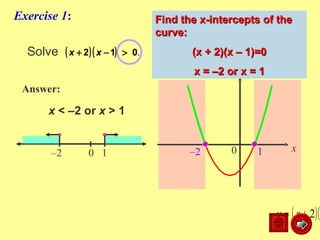
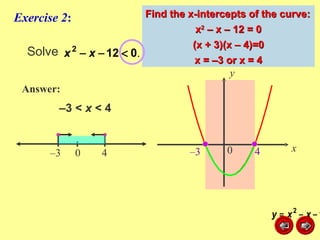
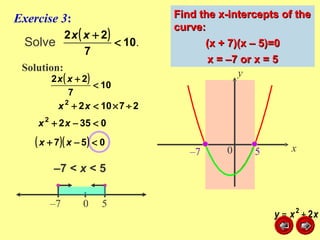

This document discusses how to graph and solve quadratic inequalities. It provides steps for graphing quadratic inequalities by sketching the parabola and shading the appropriate region based on a test point. Examples are given of solving quadratic inequalities graphically by determining the portions of the graph above or below the x-axis and obtaining the solution intervals. Exercises are also worked through to practice solving quadratic inequalities graphically.