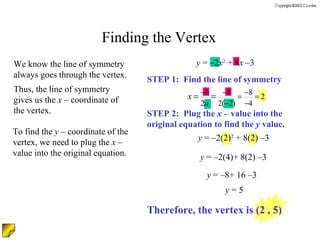
Graphing Quadratic Functions y = ax 2  + bx + c
All the slides in this presentation are timed. You do not need to click the mouse or press any keys on the keyboard for the presentation on each slide to continue. However, in order to make sure the presentation does not go too quickly, you will need to click the mouse or press a key on the keyboard to advance to the next slide. You will know when the slide is finished when you see a small icon in the bottom left corner of the slide. Click the mouse button to advance the slide when you see this icon.
Quadratic Functions The graph of a quadratic function is a  parabola . A parabola can open up or down. If the parabola opens up, the lowest point is called the vertex. If the parabola opens down, the vertex is the highest point. NOTE:  if the parabola opened left or right it would not be a function! y x Vertex Vertex
Standard Form y = ax 2  + bx + c The parabola will open down when the  a  value is negative. The parabola will open up when the  a  value is positive. The standard form of a quadratic function is  y x a  > 0 a  < 0
Line of Symmetry Parabolas have a symmetric property to them. If we drew a line down the middle of the parabola, we could fold the parabola in half. We call this line the  line of symmetry .  The line of symmetry ALWAYS passes through the vertex. Or, if we graphed one side of the parabola, we could “fold” (or  REFLECT ) it over, the line of symmetry to graph the other side. y x Line of Symmetry
Finding the Line of Symmetry Find the line of symmetry of  y  = 3 x 2  – 18 x  + 7 When a quadratic function is in standard form The  equation of the line of symmetry  is  y = ax 2  + bx + c , For example… Using the formula… This is best read as …  the opposite of  b  divided by the quantity of 2 times  a . Thus, the line of symmetry is  x  = 3.
Finding the Vertex We know the line of symmetry always goes through the vertex. Thus, the line of symmetry gives us the  x  – coordinate of the vertex. To find the  y  – coordinate of the vertex, we need to plug the  x  – value into the original equation. STEP 1:  Find the line of symmetry STEP 2:  Plug the  x  – value into the original equation to find the  y  value. y  = –2 x 2  + 8 x  –3  y  = –2(2) 2  + 8(2) –3  y  = –2(4)+ 8(2) –3  y  = –8+ 16 –3  y  = 5  Therefore, the vertex is (2 , 5)
A Quadratic Function in Standard Form The standard form of a quadratic function is given by y  =  ax 2  +  bx  +  c There are 3 steps to graphing a parabola in standard form. STEP 1 :  Find the line of symmetry STEP 2 :  Find the vertex STEP 3 :  Find two other points and reflect them across the line of symmetry.  Then connect the five points with a smooth curve. Plug in the line of symmetry ( x  – value) to obtain the  y –  value of the vertex. MAKE A TABLE  using  x  – values close to the line of symmetry. USE the equation
STEP 1 :  Find the line of symmetry Let's Graph ONE!  Try … y  = 2 x 2  – 4 x  – 1 A Quadratic Function in Standard Form Thus the line of symmetry is  x  = 1 y x
Let's Graph ONE!  Try … y  = 2 x 2  – 4 x  – 1 STEP 2 :  Find the vertex A Quadratic Function in Standard Form Thus the vertex is (1 ,–3). Since the  x  – value of the vertex is given by the line of symmetry, we need to plug in  x  = 1 to find the  y  – value of the vertex. y x
5 – 1 Let's Graph ONE!  Try … y  = 2 x 2  – 4 x  – 1 STEP 3 :  Find two other points and reflect them across the line of symmetry.  Then connect the five points with a smooth curve. A Quadratic Function in Standard Form y x 3 2 y x

Graphing Quadradic

  • 1.
  • 2.
    All the slidesin this presentation are timed. You do not need to click the mouse or press any keys on the keyboard for the presentation on each slide to continue. However, in order to make sure the presentation does not go too quickly, you will need to click the mouse or press a key on the keyboard to advance to the next slide. You will know when the slide is finished when you see a small icon in the bottom left corner of the slide. Click the mouse button to advance the slide when you see this icon.
  • 3.
    Quadratic Functions Thegraph of a quadratic function is a parabola . A parabola can open up or down. If the parabola opens up, the lowest point is called the vertex. If the parabola opens down, the vertex is the highest point. NOTE: if the parabola opened left or right it would not be a function! y x Vertex Vertex
  • 4.
    Standard Form y= ax 2 + bx + c The parabola will open down when the a value is negative. The parabola will open up when the a value is positive. The standard form of a quadratic function is y x a > 0 a < 0
  • 5.
    Line of SymmetryParabolas have a symmetric property to them. If we drew a line down the middle of the parabola, we could fold the parabola in half. We call this line the line of symmetry . The line of symmetry ALWAYS passes through the vertex. Or, if we graphed one side of the parabola, we could “fold” (or REFLECT ) it over, the line of symmetry to graph the other side. y x Line of Symmetry
  • 6.
    Finding the Lineof Symmetry Find the line of symmetry of y = 3 x 2 – 18 x + 7 When a quadratic function is in standard form The equation of the line of symmetry is y = ax 2 + bx + c , For example… Using the formula… This is best read as … the opposite of b divided by the quantity of 2 times a . Thus, the line of symmetry is x = 3.
  • 7.
    Finding the VertexWe know the line of symmetry always goes through the vertex. Thus, the line of symmetry gives us the x – coordinate of the vertex. To find the y – coordinate of the vertex, we need to plug the x – value into the original equation. STEP 1: Find the line of symmetry STEP 2: Plug the x – value into the original equation to find the y value. y = –2 x 2 + 8 x –3 y = –2(2) 2 + 8(2) –3 y = –2(4)+ 8(2) –3 y = –8+ 16 –3 y = 5 Therefore, the vertex is (2 , 5)
  • 8.
    A Quadratic Functionin Standard Form The standard form of a quadratic function is given by y = ax 2 + bx + c There are 3 steps to graphing a parabola in standard form. STEP 1 : Find the line of symmetry STEP 2 : Find the vertex STEP 3 : Find two other points and reflect them across the line of symmetry. Then connect the five points with a smooth curve. Plug in the line of symmetry ( x – value) to obtain the y – value of the vertex. MAKE A TABLE using x – values close to the line of symmetry. USE the equation
  • 9.
    STEP 1 : Find the line of symmetry Let's Graph ONE! Try … y = 2 x 2 – 4 x – 1 A Quadratic Function in Standard Form Thus the line of symmetry is x = 1 y x
  • 10.
    Let's Graph ONE! Try … y = 2 x 2 – 4 x – 1 STEP 2 : Find the vertex A Quadratic Function in Standard Form Thus the vertex is (1 ,–3). Since the x – value of the vertex is given by the line of symmetry, we need to plug in x = 1 to find the y – value of the vertex. y x
  • 11.
    5 – 1Let's Graph ONE! Try … y = 2 x 2 – 4 x – 1 STEP 3 : Find two other points and reflect them across the line of symmetry. Then connect the five points with a smooth curve. A Quadratic Function in Standard Form y x 3 2 y x