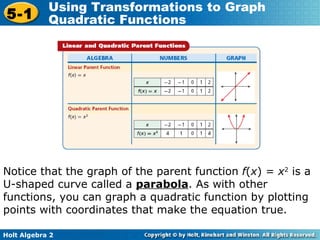
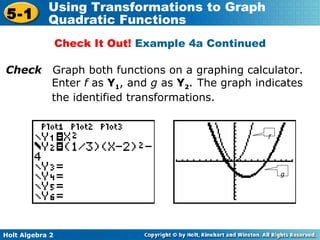
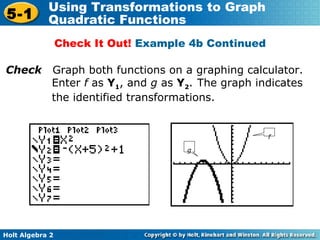
The document provides information about graphing and transforming quadratic functions:
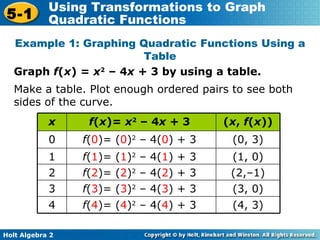
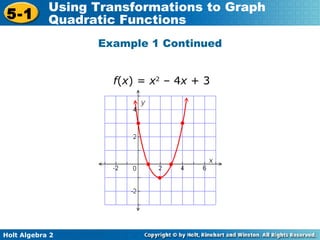
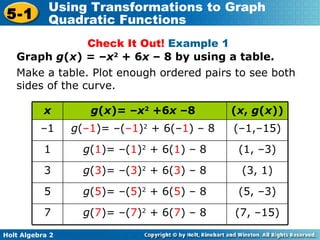
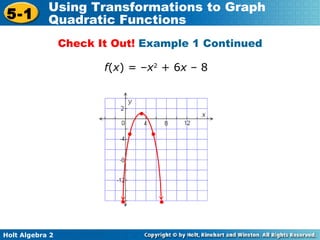
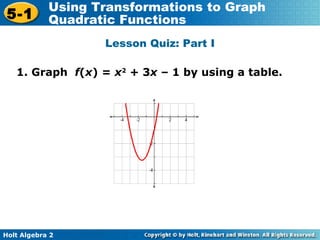
- It discusses graphing quadratic functions by making tables of x- and y-values and plotting points. Examples show graphing f(x) = x^2 - 4x + 3 and g(x) = -x^2 + 6x - 8.
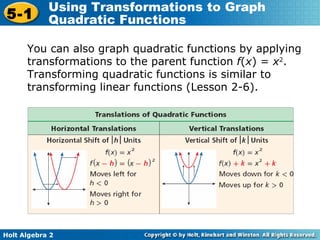
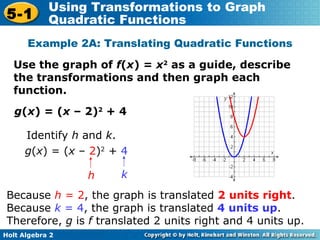
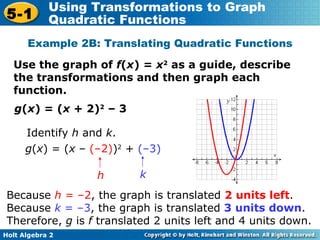
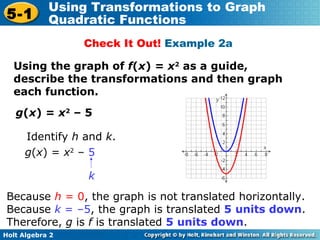
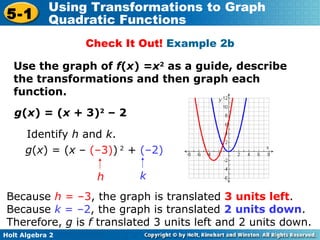
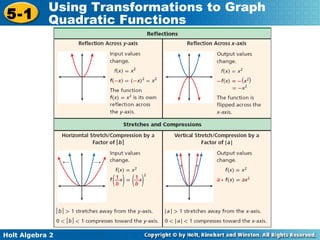
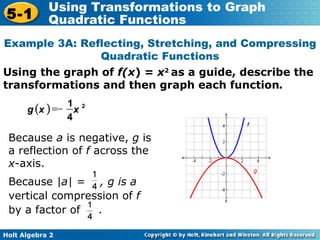
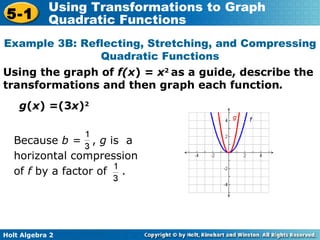
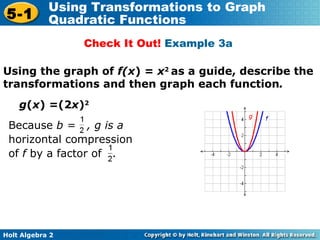
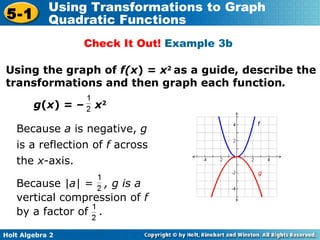
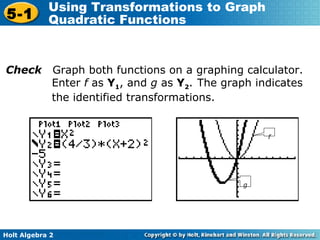
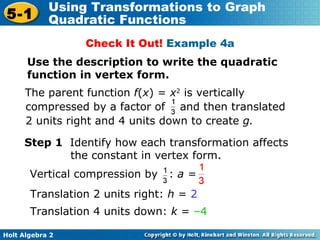
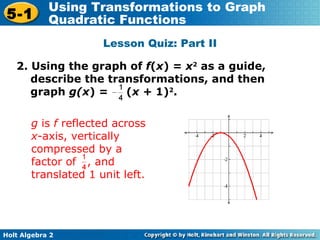
- Transformations of quadratic functions are described as translating the graph left/right or up/down, reflecting across an axis, or stretching/compressing vertically or horizontally. Examples demonstrate translating, reflecting, and compressing the graph of f(x) = x^2.
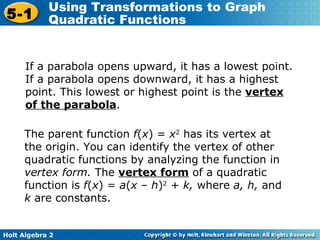
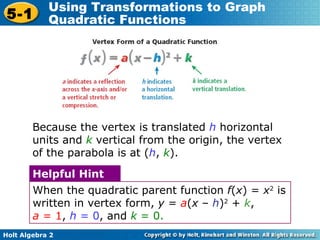
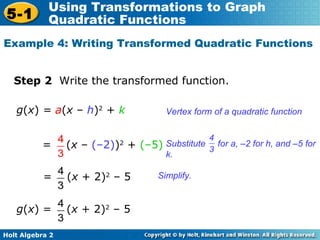
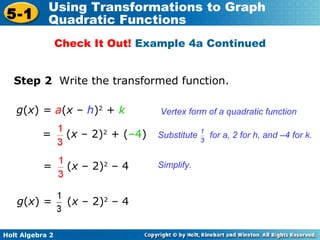
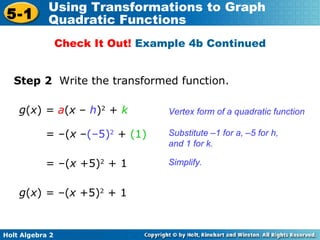
- The vertex form of a quadratic function f(x) = a(x-h)^2 +


![Math pdf [eDvArDo]](https://cdn.slidesharecdn.com/ss_thumbnails/mathpdf-140627082926-phpapp01-thumbnail.jpg?width=640&height=640&fit=bounds)