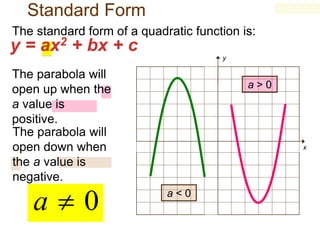
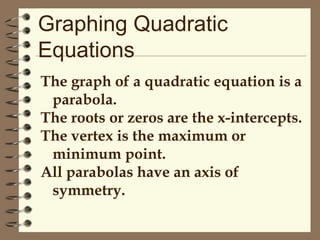
1) This document discusses how to solve quadratic equations by graphing, including identifying the terms of a quadratic equation, finding the solutions by graphing, and graphing quadratic functions.
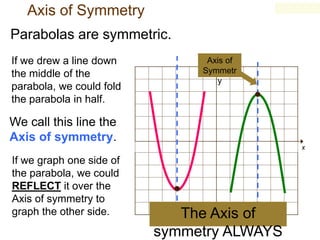
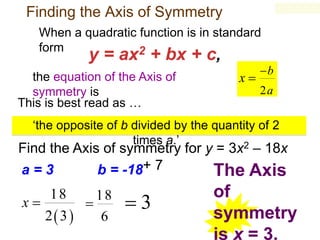
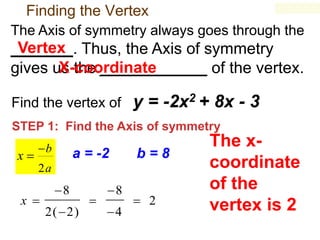
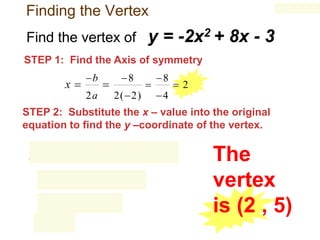
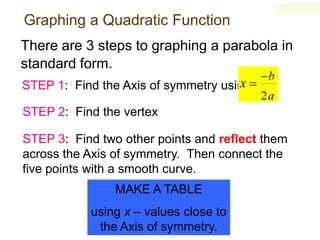
2) The key steps for graphing a quadratic function are to find the axis of symmetry using the standard form equation, find the vertex point, and find two other points to reflect across the axis of symmetry to complete the parabolic graph.
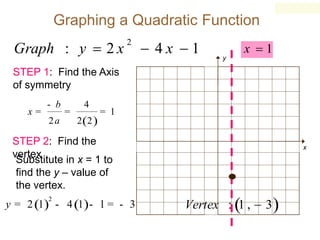
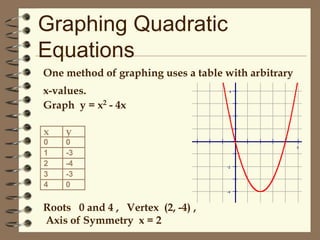
3) An example problem walks through graphing the quadratic equation y = x^2 - 4x by first finding the roots, vertex, and axis of symmetry, and then constructing a table to plot points and graph the parabola.