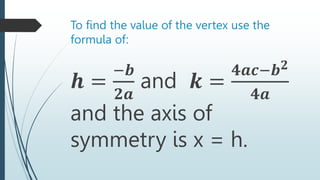
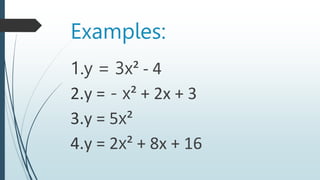
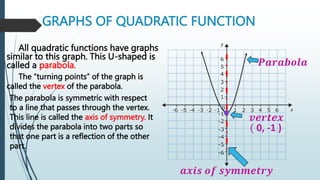
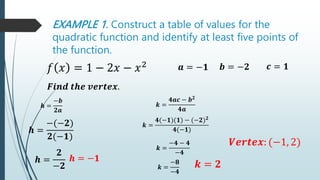
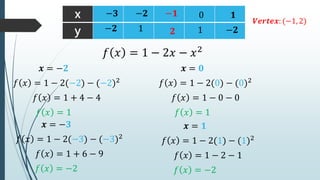
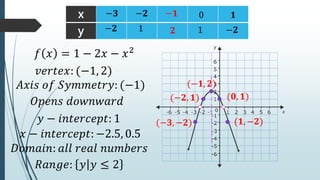
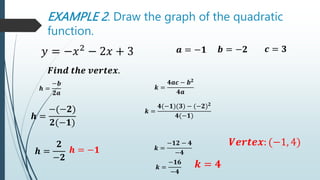
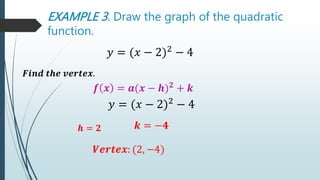
Forms of Quadratic Functions
Give the different forms of
quadratic function, determine the
axis of symmetry, opening of the
parabola and the vertex; and
Identify the different forms of
quadratic functions.
The vertex is (h,k), and the axis of
symmetry is x = h which divides the
graph of quadratic function into two
equal parts. The value of a indicates
the opening of the graph. If the value
of a is positive, the graphs opens
upward. If the value of a is negative,
the graph opens downward.
To find the value of the vertex use the
formula of:
𝒉 =
−𝒃
𝟐𝒂
and 𝒌 =
𝟒𝒂𝒄−𝒃𝟐
𝟒𝒂
and the axis of
symmetry is x = h.
Examples:
1.y = 3x² - 4
2.y = - x² + 2x + 3
3.y = 5x²
4.y = 2x² + 8x + 16
Graphs of Quadratic
Functions
Learning Targets
 Draw the graphs of the quadratic
function;
 Analyze the effect of changing the
values of a, h and k in the equation
y = a(x-h)²+k of the quadratic function
on its graph.
GRAPHS OF QUADRATIC FUNCTION
All quadratic functions have graphs
similar to this graph. This U-shaped is
called a parabola. 𝑷𝒂𝒓𝒂𝒃𝒐𝒍𝒂
𝒗𝒆𝒓𝒕𝒆𝒙
( 0, -1 )
The “turning points” of the graph is
called the vertex of the parabola.
The parabola is symmetric with respect
to a line that passes through the vertex.
This line is called the axis of symmetry. It
divides the parabola into two parts so
that one part is a reflection of the other
part.
𝒂𝒙𝒊𝒔 𝒐𝒇 𝒔𝒚𝒎𝒎𝒆𝒕𝒓𝒚
EXAMPLE 1. Construct a table of values for the
quadratic function and identify at least five points of
the function.
𝑓 𝑥 = 1 − 2𝑥 − 𝑥2
𝒌 =
𝟒𝒂𝒄 − 𝒃𝟐
𝟒𝒂
𝒉 =
−𝒃
𝟐𝒂
𝒂 = −𝟏 𝒃 = −𝟐 𝒄 = 𝟏
𝑭𝒊𝒏𝒅 𝒕𝒉𝒆 𝒗𝒆𝒓𝒕𝒆𝒙.
𝒉 =
−(−𝟐)
𝟐(−𝟏)
𝒉 =
𝟐
−𝟐
𝒉 = −𝟏
𝒌 =
−𝟒 − 𝟒
−𝟒
𝒌 =
𝟒(−𝟏)(𝟏) − (−𝟐)𝟐
𝟒(−𝟏)
𝒌 =
−𝟖
−𝟒
𝒌 = 𝟐
𝑽𝒆𝒓𝒕𝒆𝒙: (−1, 2)
x
y
−𝟏
𝟐
−𝟐
−𝟑 0 𝟏
1
−𝟐 1 −𝟐
𝑓 𝑥 = 1 − 2(−2) − (−2)2
𝒙 = −𝟐
𝑓 𝑥 = 1 − 2𝑥 − 𝑥2
𝑓 𝑥 = 1
𝑓 𝑥 = 1 + 4 − 4
𝑓 𝑥 = 1 − 2(−3) − (−3)2
𝒙 = −𝟑
𝑓 𝑥 = −2
𝑓 𝑥 = 1 + 6 − 9
𝑓 𝑥 = 1 − 2(0) − (0)2
𝒙 = 𝟎
𝑓 𝑥 = 1
𝑓 𝑥 = 1 − 0 − 0
𝑓 𝑥 = 1 − 2(1) − (1)2
𝒙 = 𝟏
𝑓 𝑥 = −2
𝑓 𝑥 = 1 − 2 − 1
𝑽𝒆𝒓𝒕𝒆𝒙: (−1, 2)
x
y
−𝟏
(−𝟏, 𝟐)
−𝟐
−𝟑 0 𝟏
1
−𝟐 1 −𝟐
𝑓 𝑥 = 1 − 2𝑥 − 𝑥2
𝑣𝑒𝑟𝑡𝑒𝑥: (−1, 2)
𝟐
(−𝟐, 𝟏)
(−𝟑, −𝟐) (𝟏, −𝟐)
(𝟎, 𝟏)
𝐴𝑥𝑖𝑠 𝑜𝑓 𝑆𝑦𝑚𝑚𝑒𝑡𝑟𝑦: (−1)
𝑦 − 𝑖𝑛𝑡𝑒𝑟𝑐𝑒𝑝𝑡: 1
𝑂𝑝𝑒𝑛𝑠 𝑑𝑜𝑤𝑛𝑤𝑎𝑟𝑑
𝑥 − 𝑖𝑛𝑡𝑒𝑟𝑐𝑒𝑝𝑡: −2.5, 0.5
𝑅𝑎𝑛𝑔𝑒: 𝑦 𝑦 ≤ 2
𝐷𝑜𝑚𝑎𝑖𝑛: 𝑎𝑙𝑙 𝑟𝑒𝑎𝑙 𝑛𝑢𝑚𝑏𝑒𝑟𝑠
EXAMPLE 2. Draw the graph of the quadratic
function.
𝑦 = −𝑥2
− 2𝑥 + 3
𝒌 =
𝟒𝒂𝒄 − 𝒃𝟐
𝟒𝒂
𝒉 =
−𝒃
𝟐𝒂
𝒂 = −𝟏 𝒃 = −𝟐 𝒄 = 𝟑
𝑭𝒊𝒏𝒅 𝒕𝒉𝒆 𝒗𝒆𝒓𝒕𝒆𝒙.
𝒉 =
−(−𝟐)
𝟐(−𝟏)
𝒉 =
𝟐
−𝟐
𝒉 = −𝟏 𝒌 =
−𝟏𝟐 − 𝟒
−𝟒
𝒌 =
𝟒(−𝟏)(𝟑) − (−𝟐)𝟐
𝟒(−𝟏)
𝒌 =
−𝟏𝟔
−𝟒
𝒌 = 𝟒
𝑽𝒆𝒓𝒕𝒆𝒙: (−1, 4)
x
y
−𝟏
𝟒
−𝟐
−𝟑 0 𝟏
3
𝟎 3 𝟎
𝑓 𝑥 = −(0)2 − 2 0 + 3
𝒙 = −𝟐
𝑦 = −𝑥2
− 2𝑥 + 3
𝑓 𝑥 = 3
𝒙 = −𝟑
𝑓 𝑥 = 0
𝒙 = 𝟎
𝑓 𝑥 = 3
𝒙 = 𝟏
𝑓 𝑥 = 0
𝑓 𝑥 = 0 − 0 + 3
𝑓 𝑥 = −(−3)2
− 2 −3 + 3
𝑓 𝑥 = −9 + 6 + 3
𝑓 𝑥 = −(−2)2 − 2 −2 + 3
𝑓 𝑥 = −4 + 4 + 3
𝑓 𝑥 = −(1)2 − 2 1 + 3
𝑓 𝑥 = −1 − 2 + 3
x
y
−𝟏
(−𝟏, 𝟒)
−𝟐
−𝟑 0 𝟏
3
𝟎 3 𝟎
𝑦 = −𝑥2
− 2𝑥 + 3
𝑣𝑒𝑟𝑡𝑒𝑥: (−1, 4)
𝟒
(−𝟐, 𝟑)
(−𝟑, 𝟎) (𝟏, 𝟎)
(𝟎, 𝟑)
𝐴𝑥𝑖𝑠 𝑜𝑓 𝑆𝑦𝑚𝑚𝑒𝑡𝑟𝑦: (−1)
𝑦 − 𝑖𝑛𝑡𝑒𝑟𝑐𝑒𝑝𝑡: 3
𝑂𝑝𝑒𝑛𝑠 𝑑𝑜𝑤𝑛𝑤𝑎𝑟𝑑
𝑥 − 𝑖𝑛𝑡𝑒𝑟𝑐𝑒𝑝𝑡: −3 𝑎𝑛𝑑 1
𝑅𝑎𝑛𝑔𝑒: 𝑦 𝑦 ≤ 4
𝐷𝑜𝑚𝑎𝑖𝑛: 𝑎𝑙𝑙 𝑟𝑒𝑎𝑙 𝑛𝑢𝑚𝑏𝑒𝑟𝑠
EXAMPLE 3. Draw the graph of the quadratic
function.
𝑦 = (𝑥 − 2)2
− 4
𝑭𝒊𝒏𝒅 𝒕𝒉𝒆 𝒗𝒆𝒓𝒕𝒆𝒙.
𝒉 = 𝟐 𝒌 = −𝟒
𝑽𝒆𝒓𝒕𝒆𝒙: (2, −4)
𝒇 𝒙 = 𝒂(𝒙 − 𝒉)𝟐
+ 𝒌
𝑦 = (𝑥 − 2)2
− 4
x
y
2
−𝟒
1
0 3 𝟒
−3
𝟎 −3 𝟎
𝒙 = 𝟏
𝑦 = (−1)2
− 4
𝑓 𝑥 = −3
𝒙 = 𝟎
𝑓 𝑥 = 0
𝒙 = 𝟑
𝑓 𝑥 = −3
𝒙 = 𝟒
𝑓 𝑥 = 0
𝑦 = (𝑥 − 2)2
− 4
𝑦 = (1 − 2)2
− 4
𝑦 = (−2)2
− 4
𝑦 = (0 − 2)2
− 4
𝑦 = (1)2
− 4
𝑦 = (3 − 2)2
− 4
𝑦 = (2)2
− 4
𝑦 = (4 − 2)2
− 4
(𝟒, 𝟎)
𝑦 = (𝑥 − 2)2
− 4
𝑣𝑒𝑟𝑡𝑒𝑥: (2, −4)
(𝟏, −𝟑)
(𝟎, 𝟎)
(𝟑, −𝟑)
(𝟐, −𝟒)
𝐴𝑥𝑖𝑠 𝑜𝑓 𝑆𝑦𝑚𝑚𝑒𝑡𝑟𝑦: (2)
𝑦 − 𝑖𝑛𝑡𝑒𝑟𝑐𝑒𝑝𝑡: 0
𝑂𝑝𝑒𝑛𝑠 𝑢𝑝𝑤𝑎𝑟𝑑
𝑥 − 𝑖𝑛𝑡𝑒𝑟𝑐𝑒𝑝𝑡: 0 𝑎𝑛𝑑 4
𝑅𝑎𝑛𝑔𝑒: 𝑦 𝑦 ≥ −4
𝐷𝑜𝑚𝑎𝑖𝑛: 𝑎𝑙𝑙 𝑟𝑒𝑎𝑙 𝑛𝑢𝑚𝑏𝑒𝑟𝑠
x
y
2
−𝟒
1
0 3 𝟒
−3
𝟎 −3 𝟎
Generate a table of values and graph each quadratic functions and
determine the vertex, axis of symmetry, y- and x- intercepts, maximum
or minimum value, opening of parabola, range, and domain.
NOTE: Use GRAPHING PAPER for your graph and other
paper for the table of values.
1. 𝒚 = 𝒙𝟐 + 𝒙 − 𝟒
2. 𝒚 = 𝒙𝟐
− 𝟑𝒙 − 𝟒
3. 𝒚 = 𝟐(𝒙 − 𝟏)𝟐 + 𝟑
4. 𝒚 = (𝒙 − 𝟑)𝟐 + 𝟐

graphs of quadratic function grade 9.pptx

  • 1.
    Forms of QuadraticFunctions Give the different forms of quadratic function, determine the axis of symmetry, opening of the parabola and the vertex; and Identify the different forms of quadratic functions.
  • 2.
    The vertex is(h,k), and the axis of symmetry is x = h which divides the graph of quadratic function into two equal parts. The value of a indicates the opening of the graph. If the value of a is positive, the graphs opens upward. If the value of a is negative, the graph opens downward.
  • 3.
    To find thevalue of the vertex use the formula of: 𝒉 = −𝒃 𝟐𝒂 and 𝒌 = 𝟒𝒂𝒄−𝒃𝟐 𝟒𝒂 and the axis of symmetry is x = h.
  • 4.
    Examples: 1.y = 3x²- 4 2.y = - x² + 2x + 3 3.y = 5x² 4.y = 2x² + 8x + 16
  • 5.
  • 6.
    Learning Targets  Drawthe graphs of the quadratic function;  Analyze the effect of changing the values of a, h and k in the equation y = a(x-h)²+k of the quadratic function on its graph.
  • 7.
    GRAPHS OF QUADRATICFUNCTION All quadratic functions have graphs similar to this graph. This U-shaped is called a parabola. 𝑷𝒂𝒓𝒂𝒃𝒐𝒍𝒂 𝒗𝒆𝒓𝒕𝒆𝒙 ( 0, -1 ) The “turning points” of the graph is called the vertex of the parabola. The parabola is symmetric with respect to a line that passes through the vertex. This line is called the axis of symmetry. It divides the parabola into two parts so that one part is a reflection of the other part. 𝒂𝒙𝒊𝒔 𝒐𝒇 𝒔𝒚𝒎𝒎𝒆𝒕𝒓𝒚
  • 8.
    EXAMPLE 1. Constructa table of values for the quadratic function and identify at least five points of the function. 𝑓 𝑥 = 1 − 2𝑥 − 𝑥2 𝒌 = 𝟒𝒂𝒄 − 𝒃𝟐 𝟒𝒂 𝒉 = −𝒃 𝟐𝒂 𝒂 = −𝟏 𝒃 = −𝟐 𝒄 = 𝟏 𝑭𝒊𝒏𝒅 𝒕𝒉𝒆 𝒗𝒆𝒓𝒕𝒆𝒙. 𝒉 = −(−𝟐) 𝟐(−𝟏) 𝒉 = 𝟐 −𝟐 𝒉 = −𝟏 𝒌 = −𝟒 − 𝟒 −𝟒 𝒌 = 𝟒(−𝟏)(𝟏) − (−𝟐)𝟐 𝟒(−𝟏) 𝒌 = −𝟖 −𝟒 𝒌 = 𝟐 𝑽𝒆𝒓𝒕𝒆𝒙: (−1, 2)
  • 9.
    x y −𝟏 𝟐 −𝟐 −𝟑 0 𝟏 1 −𝟐1 −𝟐 𝑓 𝑥 = 1 − 2(−2) − (−2)2 𝒙 = −𝟐 𝑓 𝑥 = 1 − 2𝑥 − 𝑥2 𝑓 𝑥 = 1 𝑓 𝑥 = 1 + 4 − 4 𝑓 𝑥 = 1 − 2(−3) − (−3)2 𝒙 = −𝟑 𝑓 𝑥 = −2 𝑓 𝑥 = 1 + 6 − 9 𝑓 𝑥 = 1 − 2(0) − (0)2 𝒙 = 𝟎 𝑓 𝑥 = 1 𝑓 𝑥 = 1 − 0 − 0 𝑓 𝑥 = 1 − 2(1) − (1)2 𝒙 = 𝟏 𝑓 𝑥 = −2 𝑓 𝑥 = 1 − 2 − 1 𝑽𝒆𝒓𝒕𝒆𝒙: (−1, 2)
  • 10.
    x y −𝟏 (−𝟏, 𝟐) −𝟐 −𝟑 0𝟏 1 −𝟐 1 −𝟐 𝑓 𝑥 = 1 − 2𝑥 − 𝑥2 𝑣𝑒𝑟𝑡𝑒𝑥: (−1, 2) 𝟐 (−𝟐, 𝟏) (−𝟑, −𝟐) (𝟏, −𝟐) (𝟎, 𝟏) 𝐴𝑥𝑖𝑠 𝑜𝑓 𝑆𝑦𝑚𝑚𝑒𝑡𝑟𝑦: (−1) 𝑦 − 𝑖𝑛𝑡𝑒𝑟𝑐𝑒𝑝𝑡: 1 𝑂𝑝𝑒𝑛𝑠 𝑑𝑜𝑤𝑛𝑤𝑎𝑟𝑑 𝑥 − 𝑖𝑛𝑡𝑒𝑟𝑐𝑒𝑝𝑡: −2.5, 0.5 𝑅𝑎𝑛𝑔𝑒: 𝑦 𝑦 ≤ 2 𝐷𝑜𝑚𝑎𝑖𝑛: 𝑎𝑙𝑙 𝑟𝑒𝑎𝑙 𝑛𝑢𝑚𝑏𝑒𝑟𝑠
  • 11.
    EXAMPLE 2. Drawthe graph of the quadratic function. 𝑦 = −𝑥2 − 2𝑥 + 3 𝒌 = 𝟒𝒂𝒄 − 𝒃𝟐 𝟒𝒂 𝒉 = −𝒃 𝟐𝒂 𝒂 = −𝟏 𝒃 = −𝟐 𝒄 = 𝟑 𝑭𝒊𝒏𝒅 𝒕𝒉𝒆 𝒗𝒆𝒓𝒕𝒆𝒙. 𝒉 = −(−𝟐) 𝟐(−𝟏) 𝒉 = 𝟐 −𝟐 𝒉 = −𝟏 𝒌 = −𝟏𝟐 − 𝟒 −𝟒 𝒌 = 𝟒(−𝟏)(𝟑) − (−𝟐)𝟐 𝟒(−𝟏) 𝒌 = −𝟏𝟔 −𝟒 𝒌 = 𝟒 𝑽𝒆𝒓𝒕𝒆𝒙: (−1, 4)
  • 12.
    x y −𝟏 𝟒 −𝟐 −𝟑 0 𝟏 3 𝟎3 𝟎 𝑓 𝑥 = −(0)2 − 2 0 + 3 𝒙 = −𝟐 𝑦 = −𝑥2 − 2𝑥 + 3 𝑓 𝑥 = 3 𝒙 = −𝟑 𝑓 𝑥 = 0 𝒙 = 𝟎 𝑓 𝑥 = 3 𝒙 = 𝟏 𝑓 𝑥 = 0 𝑓 𝑥 = 0 − 0 + 3 𝑓 𝑥 = −(−3)2 − 2 −3 + 3 𝑓 𝑥 = −9 + 6 + 3 𝑓 𝑥 = −(−2)2 − 2 −2 + 3 𝑓 𝑥 = −4 + 4 + 3 𝑓 𝑥 = −(1)2 − 2 1 + 3 𝑓 𝑥 = −1 − 2 + 3
  • 13.
    x y −𝟏 (−𝟏, 𝟒) −𝟐 −𝟑 0𝟏 3 𝟎 3 𝟎 𝑦 = −𝑥2 − 2𝑥 + 3 𝑣𝑒𝑟𝑡𝑒𝑥: (−1, 4) 𝟒 (−𝟐, 𝟑) (−𝟑, 𝟎) (𝟏, 𝟎) (𝟎, 𝟑) 𝐴𝑥𝑖𝑠 𝑜𝑓 𝑆𝑦𝑚𝑚𝑒𝑡𝑟𝑦: (−1) 𝑦 − 𝑖𝑛𝑡𝑒𝑟𝑐𝑒𝑝𝑡: 3 𝑂𝑝𝑒𝑛𝑠 𝑑𝑜𝑤𝑛𝑤𝑎𝑟𝑑 𝑥 − 𝑖𝑛𝑡𝑒𝑟𝑐𝑒𝑝𝑡: −3 𝑎𝑛𝑑 1 𝑅𝑎𝑛𝑔𝑒: 𝑦 𝑦 ≤ 4 𝐷𝑜𝑚𝑎𝑖𝑛: 𝑎𝑙𝑙 𝑟𝑒𝑎𝑙 𝑛𝑢𝑚𝑏𝑒𝑟𝑠
  • 14.
    EXAMPLE 3. Drawthe graph of the quadratic function. 𝑦 = (𝑥 − 2)2 − 4 𝑭𝒊𝒏𝒅 𝒕𝒉𝒆 𝒗𝒆𝒓𝒕𝒆𝒙. 𝒉 = 𝟐 𝒌 = −𝟒 𝑽𝒆𝒓𝒕𝒆𝒙: (2, −4) 𝒇 𝒙 = 𝒂(𝒙 − 𝒉)𝟐 + 𝒌 𝑦 = (𝑥 − 2)2 − 4
  • 15.
    x y 2 −𝟒 1 0 3 𝟒 −3 𝟎−3 𝟎 𝒙 = 𝟏 𝑦 = (−1)2 − 4 𝑓 𝑥 = −3 𝒙 = 𝟎 𝑓 𝑥 = 0 𝒙 = 𝟑 𝑓 𝑥 = −3 𝒙 = 𝟒 𝑓 𝑥 = 0 𝑦 = (𝑥 − 2)2 − 4 𝑦 = (1 − 2)2 − 4 𝑦 = (−2)2 − 4 𝑦 = (0 − 2)2 − 4 𝑦 = (1)2 − 4 𝑦 = (3 − 2)2 − 4 𝑦 = (2)2 − 4 𝑦 = (4 − 2)2 − 4
  • 16.
    (𝟒, 𝟎) 𝑦 =(𝑥 − 2)2 − 4 𝑣𝑒𝑟𝑡𝑒𝑥: (2, −4) (𝟏, −𝟑) (𝟎, 𝟎) (𝟑, −𝟑) (𝟐, −𝟒) 𝐴𝑥𝑖𝑠 𝑜𝑓 𝑆𝑦𝑚𝑚𝑒𝑡𝑟𝑦: (2) 𝑦 − 𝑖𝑛𝑡𝑒𝑟𝑐𝑒𝑝𝑡: 0 𝑂𝑝𝑒𝑛𝑠 𝑢𝑝𝑤𝑎𝑟𝑑 𝑥 − 𝑖𝑛𝑡𝑒𝑟𝑐𝑒𝑝𝑡: 0 𝑎𝑛𝑑 4 𝑅𝑎𝑛𝑔𝑒: 𝑦 𝑦 ≥ −4 𝐷𝑜𝑚𝑎𝑖𝑛: 𝑎𝑙𝑙 𝑟𝑒𝑎𝑙 𝑛𝑢𝑚𝑏𝑒𝑟𝑠 x y 2 −𝟒 1 0 3 𝟒 −3 𝟎 −3 𝟎
  • 17.
    Generate a tableof values and graph each quadratic functions and determine the vertex, axis of symmetry, y- and x- intercepts, maximum or minimum value, opening of parabola, range, and domain. NOTE: Use GRAPHING PAPER for your graph and other paper for the table of values. 1. 𝒚 = 𝒙𝟐 + 𝒙 − 𝟒 2. 𝒚 = 𝒙𝟐 − 𝟑𝒙 − 𝟒 3. 𝒚 = 𝟐(𝒙 − 𝟏)𝟐 + 𝟑 4. 𝒚 = (𝒙 − 𝟑)𝟐 + 𝟐