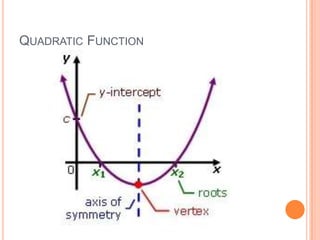
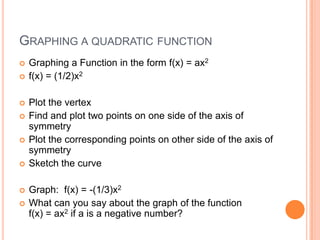
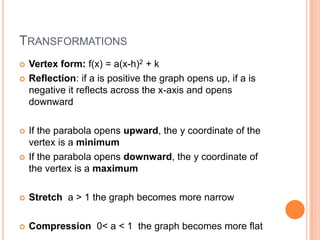
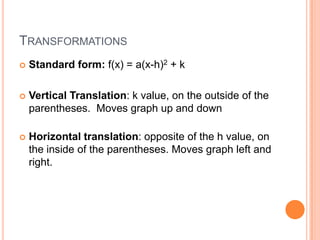
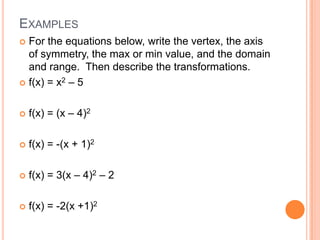
4-1 QUADRATIC FUNCTIONS AND
TRANSFORMATIONS
Chapter 4 Quadratic Functions and Equations
©Tentinger
ESSENTIAL UNDERSTANDING AND
OBJECTIVES
   Essential Understanding: The graph of any
    quadratic function is the transformation of the graph
    of the parent function y = x2

 Objectives:
 Students will be able to:
     Identify and graph quadratic functions
     Identify and graph the transformations of quadratic
      functions (reflect, stretch, compression, translation)
     Solve for the minimum and maximum values of
      parabolas
IOWA CORE CURRICULUM
   Algebra
   A.CED.1. Create equations and inequalities in one variable and use
    them to solve problems. Include equations arising from linear and
    quadratic functions, and simple rational and exponential functions.
   Functions
   F.IF.4. For a function that models a relationship between two quantities,
    interpret key features of graphs and tables in terms of the quantities, and
    sketch graphs showing key features given a verbal description of the
    relationship.
   F.IF.6. Calculate and interpret the average rate of change of a function
    (presented symbolically or as a table) over a specified interval. Estimate
    the rate of change from a graph.
   F.IF.7. Graph functions expressed symbolically, and show features of the
    graph, by hand in simple cases and using technology for more
    complicated cases.
   F.BF.3. Identify the effect on the graph of f(x) + k, kf(x), f(kx), and f(x+k)
    for specific values of k (both positive and negative); find the value of k
    given the graphs. Experiment with cases and illustrate an explanation of
    the effects on the graph using technology.
VOCABULARY
   Parabola: the graph of a quadratic function, it
    makes a U shape

   Quadratic Function: ax2 + bx + c

   Vertex Form: f(x) = a(x – h)2 +k, where a doesn’t
    equal zero, vertex is (h, k)

   Axis of Symmetry: line that divides the parabola
    into two mirror images. Equation x = h

   Parent Function: y = x2
QUADRATIC FUNCTION
GRAPHING A QUADRATIC FUNCTION
   Graphing a Function in the form f(x) = ax2
   f(x) = (1/2)x2

   Plot the vertex
   Find and plot two points on one side of the axis of
    symmetry
   Plot the corresponding points on other side of the axis of
    symmetry
   Sketch the curve

   Graph: f(x) = -(1/3)x2
   What can you say about the graph of the function
    f(x) = ax2 if a is a negative number?
TRANSFORMATIONS
   Vertex form: f(x) = a(x-h)2 + k
   Reflection: if a is positive the graph opens up, if a is
    negative it reflects across the x-axis and opens
    downward

   If the parabola opens upward, the y coordinate of the
    vertex is a minimum
   If the parabola opens downward, the y coordinate of
    the vertex is a maximum

   Stretch a > 1 the graph becomes more narrow

   Compression 0< a < 1 the graph becomes more flat
TRANSFORMATIONS
   Standard form: f(x) = a(x-h)2 + k

   Vertical Translation: k value, on the outside of the
    parentheses. Moves graph up and down

   Horizontal translation: opposite of the h value, on
    the inside of the parentheses. Moves graph left and
    right.
EXAMPLES
 For the equations below, write the vertex, the axis
  of symmetry, the max or min value, and the domain
  and range. Then describe the transformations.
 f(x) = x2 – 5


   f(x) = (x – 4)2

   f(x) = -(x + 1)2

   f(x) = 3(x – 4)2 – 2

   f(x) = -2(x +1)2
HOMEWORK
 Pg. 199 – 200
 # 9-33 (3s) 35-37, 38, 40 – 42

Alg II Unit 4-1 Quadratic Functions and Transformations

  • 1.
    4-1 QUADRATIC FUNCTIONSAND TRANSFORMATIONS Chapter 4 Quadratic Functions and Equations ©Tentinger
  • 2.
    ESSENTIAL UNDERSTANDING AND OBJECTIVES  Essential Understanding: The graph of any quadratic function is the transformation of the graph of the parent function y = x2  Objectives:  Students will be able to:  Identify and graph quadratic functions  Identify and graph the transformations of quadratic functions (reflect, stretch, compression, translation)  Solve for the minimum and maximum values of parabolas
  • 3.
    IOWA CORE CURRICULUM  Algebra  A.CED.1. Create equations and inequalities in one variable and use them to solve problems. Include equations arising from linear and quadratic functions, and simple rational and exponential functions.  Functions  F.IF.4. For a function that models a relationship between two quantities, interpret key features of graphs and tables in terms of the quantities, and sketch graphs showing key features given a verbal description of the relationship.  F.IF.6. Calculate and interpret the average rate of change of a function (presented symbolically or as a table) over a specified interval. Estimate the rate of change from a graph.  F.IF.7. Graph functions expressed symbolically, and show features of the graph, by hand in simple cases and using technology for more complicated cases.  F.BF.3. Identify the effect on the graph of f(x) + k, kf(x), f(kx), and f(x+k) for specific values of k (both positive and negative); find the value of k given the graphs. Experiment with cases and illustrate an explanation of the effects on the graph using technology.
  • 4.
    VOCABULARY  Parabola: the graph of a quadratic function, it makes a U shape  Quadratic Function: ax2 + bx + c  Vertex Form: f(x) = a(x – h)2 +k, where a doesn’t equal zero, vertex is (h, k)  Axis of Symmetry: line that divides the parabola into two mirror images. Equation x = h  Parent Function: y = x2
  • 5.
  • 6.
    GRAPHING A QUADRATICFUNCTION  Graphing a Function in the form f(x) = ax2  f(x) = (1/2)x2  Plot the vertex  Find and plot two points on one side of the axis of symmetry  Plot the corresponding points on other side of the axis of symmetry  Sketch the curve  Graph: f(x) = -(1/3)x2  What can you say about the graph of the function f(x) = ax2 if a is a negative number?
  • 7.
    TRANSFORMATIONS  Vertex form: f(x) = a(x-h)2 + k  Reflection: if a is positive the graph opens up, if a is negative it reflects across the x-axis and opens downward  If the parabola opens upward, the y coordinate of the vertex is a minimum  If the parabola opens downward, the y coordinate of the vertex is a maximum  Stretch a > 1 the graph becomes more narrow  Compression 0< a < 1 the graph becomes more flat
  • 8.
    TRANSFORMATIONS  Standard form: f(x) = a(x-h)2 + k  Vertical Translation: k value, on the outside of the parentheses. Moves graph up and down  Horizontal translation: opposite of the h value, on the inside of the parentheses. Moves graph left and right.
  • 9.
    EXAMPLES  For theequations below, write the vertex, the axis of symmetry, the max or min value, and the domain and range. Then describe the transformations.  f(x) = x2 – 5  f(x) = (x – 4)2  f(x) = -(x + 1)2  f(x) = 3(x – 4)2 – 2  f(x) = -2(x +1)2
  • 10.
    HOMEWORK  Pg. 199– 200  # 9-33 (3s) 35-37, 38, 40 – 42