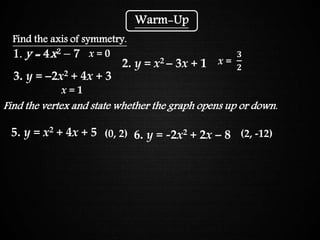
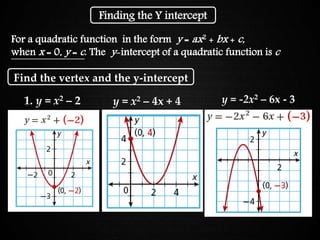
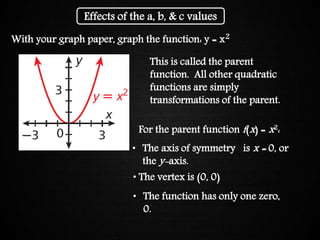
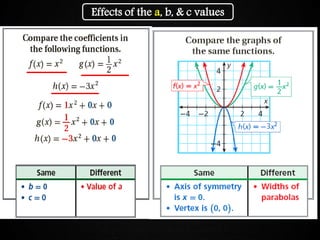
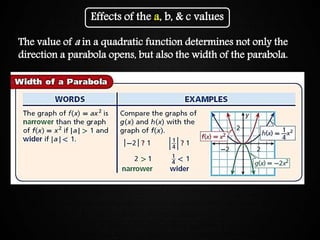
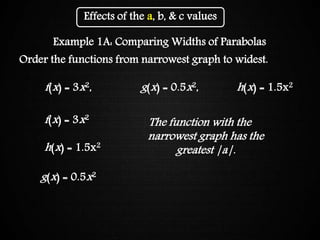
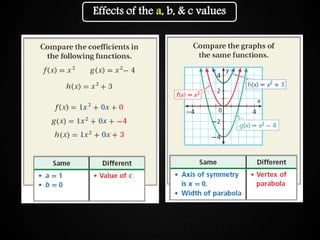
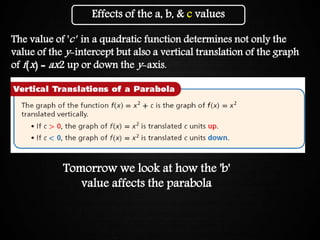
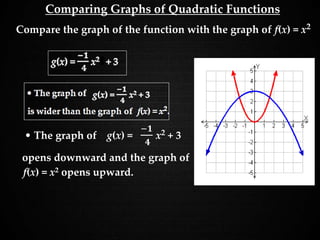
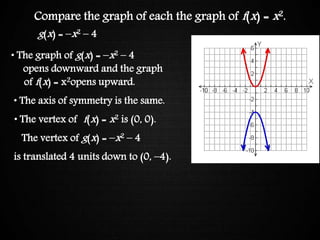
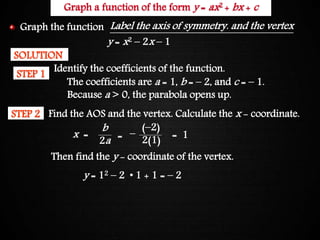
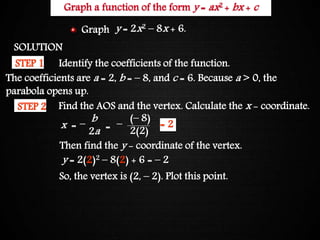
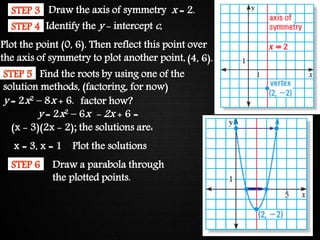
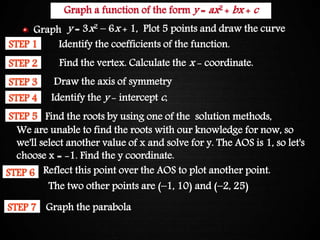
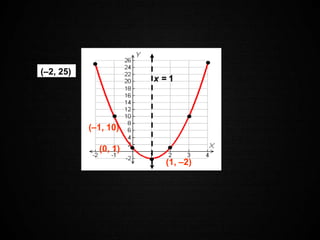
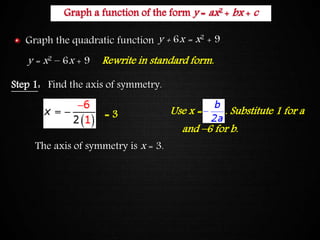
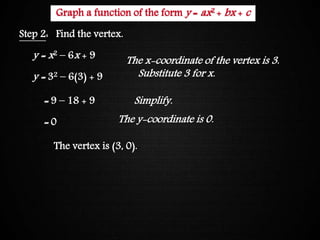
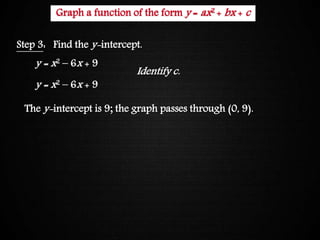
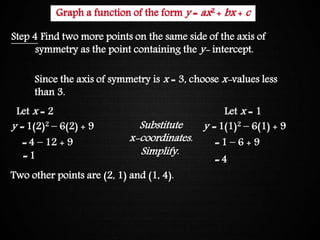
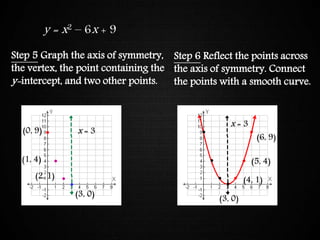
The document discusses graphing quadratic functions. It begins with reviewing key concepts like the vertex and axis of symmetry and how the a, b, and c coefficients affect the graph. Examples are provided for determining the width, direction opened, and vertical shift based on these coefficients. The remainder of the document provides step-by-step examples of graphing quadratic functions by finding the axis of symmetry, vertex, y-intercept, and other points to plot the parabolic curve.