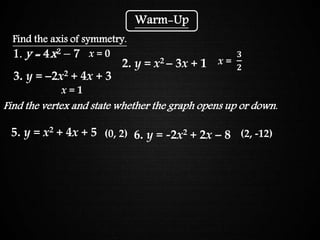
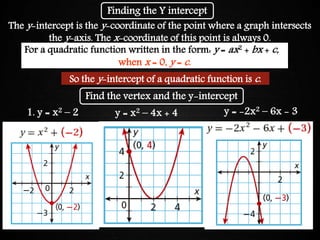
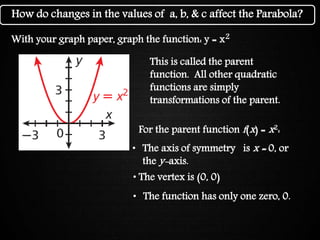
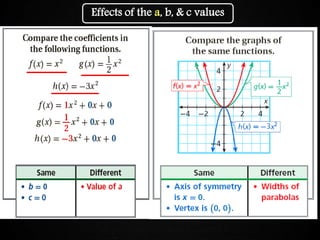
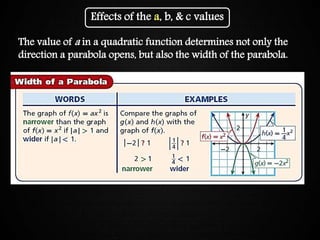
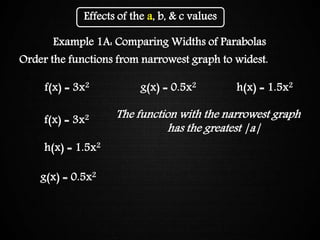
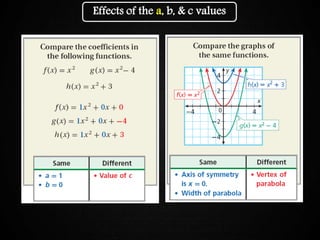
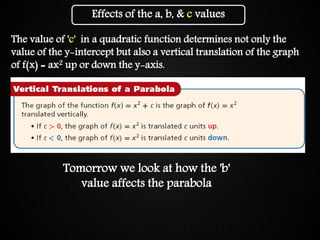
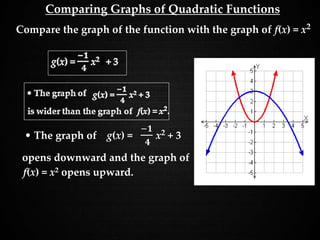
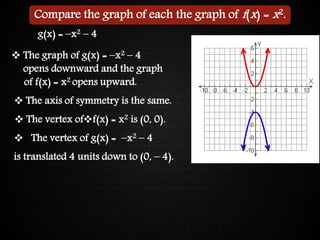
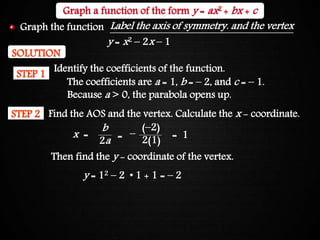
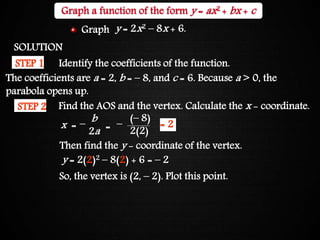
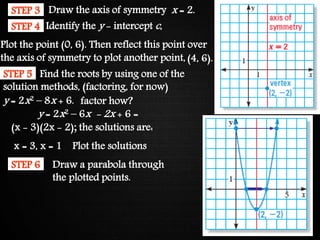
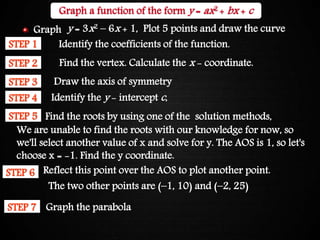
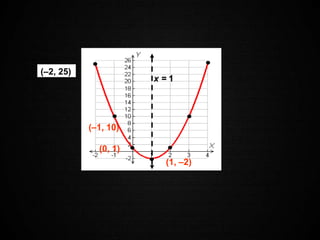
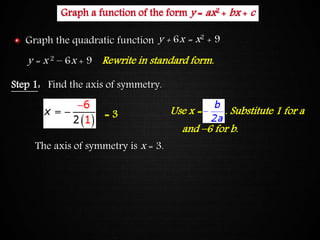
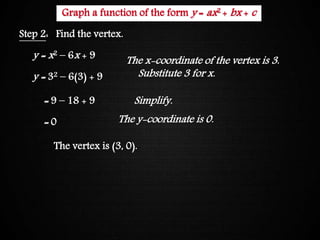
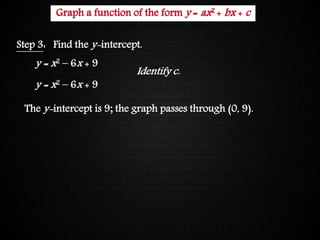
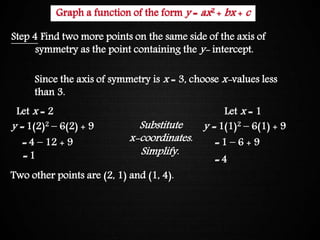
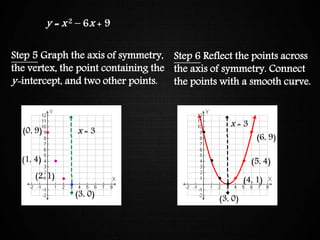
The document discusses graphing quadratic functions. It begins with reviewing key concepts like the vertex and axis of symmetry. The effects of the a, b, and c coefficients on the parabola are explained. Examples are provided to show how changing these values affects the width, direction opened, and vertical translation of the graph. The class will graph various quadratic functions by finding the axis of symmetry, vertex, y-intercept, and other points to plot the parabola. Students are assigned class work problems to graph quadratic functions and show their work.