Downloaded 359 times
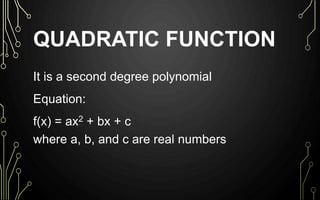
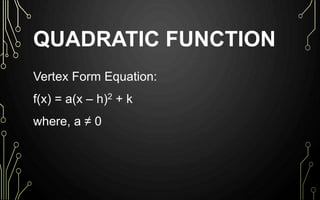
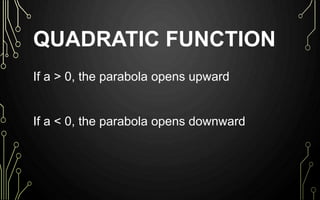
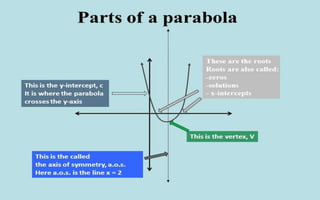
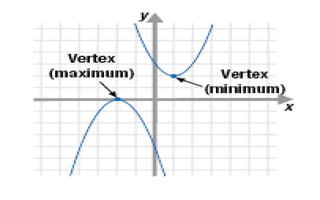
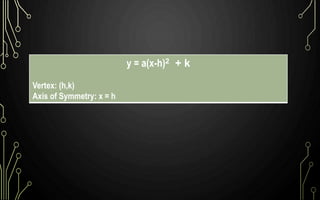
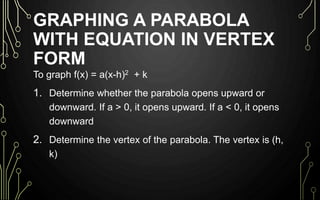
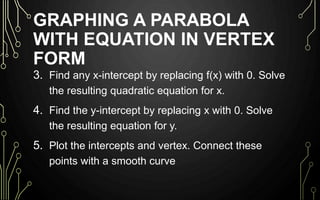
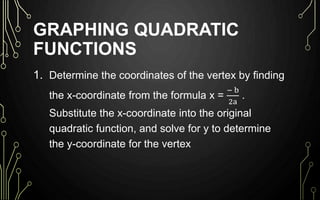
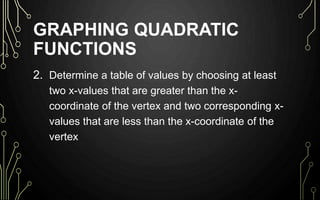
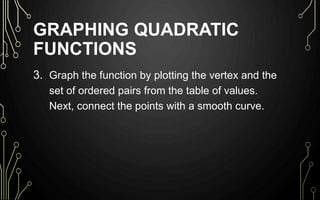
Quadratic functions are polynomial equations of the form f(x) = ax² + bx + c, with specific characteristics based on the value of 'a'. The document explains how to graph a parabola by determining its vertex, axis of symmetry, and intercepts, as well as how to represent the function in vertex form. Essential steps for graphing include finding the vertex, creating a table of values, and plotting points to connect with a smooth curve.