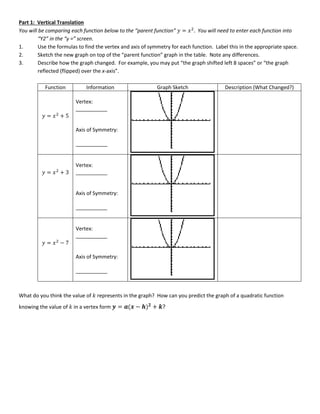
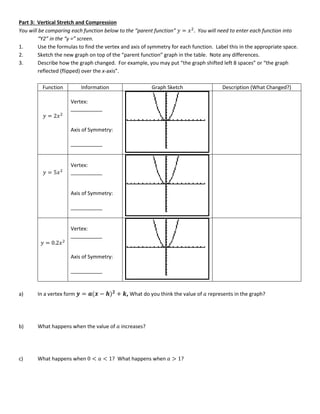
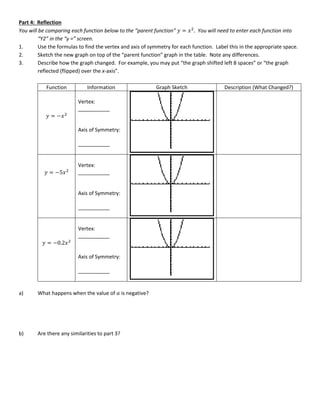
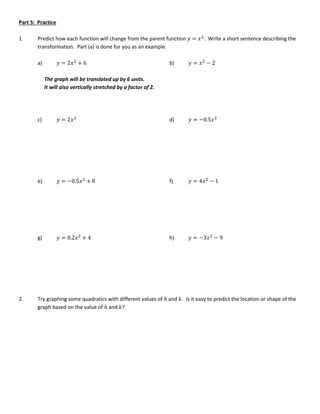
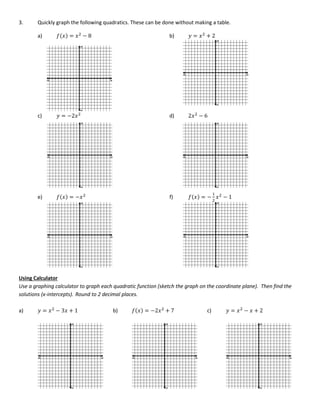
Section 9.3: Transformations of Quadratic Functions Name: ___________________________________
Calculator Exploration Worksheet
Honors Algebra I
Transformation of Quadratic Functions
In Vertex Form
𝒚 = 𝒂(𝒙 − 𝒉)𝟐
+ 𝒌
𝑊ℎ𝑎𝑡 𝑑𝑜 𝑎, ℎ, 𝑎𝑛𝑑 𝑘 𝑑𝑜 𝑡𝑜 𝑎 𝑝𝑎𝑟𝑎𝑏𝑜𝑙𝑎?
Instructions: We will be investigating the effects of different coefficients in quadratic functions on the shape of the
curve. We will be using our calculators to accomplish this. This worksheet will guide you through the
steps to understanding the different effects on the graph.
Setup
1. Find a partner (NO GROUPS OF 3 UNLESS ONE PERSON IS LEFT!!). One person should be in charge of using the
calculator and the other person should be in charge of writing down your answers on this worksheet.
2. Make sure you are both familiar with the calculator. We will be using the TI-83 today, so make sure at least one
person in your group has a TI-83 graphing calculator.
3. The major screens to know about include the “y=” screen (where you put in your equations), the “graph” screen
(where you see your equations graphed), and the “table” screen (where you can see a table of values for your
equation).
Part 1: Vertical Translation
You will be comparing each function below to the “parent function” 𝑦 = 𝑥2
. You will need to enter each function into
“Y2” in the “y =” screen.
1. Use the formulas to find the vertex and axis of symmetry for each function. Label this in the appropriate space.
2. Sketch the new graph on top of the “parent function” graph in the table. Note any differences.
3. Describe how the graph changed. For example, you may put “the graph shifted left 8 spaces” or “the graph
reflected (flipped) over the x-axis”.
Function Information Graph Sketch Description (What Changed?)
𝑦 = 𝑥2
+ 5
Vertex:
___________
Axis of Symmetry:
___________
𝑦 = 𝑥2
+ 3
Vertex:
___________
Axis of Symmetry:
___________
𝑦 = 𝑥2
− 7
Vertex:
___________
Axis of Symmetry:
___________
What do you think the value of 𝑘 represents in the graph? How can you predict the graph of a quadratic function
knowing the value of 𝑘 in a vertex form 𝒚 = 𝒂(𝒙 − 𝒉)𝟐
+ 𝒌?
Part 2: Horizontal Translation
You will be comparing each function below to the “parent function” 𝑦 = 𝑥2
. You will need to enter each function into
“Y2” in the “y =” screen.
1. Use the formulas to find the vertex and axis of symmetry for each function. Label this in the appropriate space.
2. Sketch the new graph on top of the “parent function” graph in the table. Note any differences.
3. Describe how the graph changed. For example, you may put “the graph shifted left 8 spaces” or “the graph
reflected (flipped) over the x-axis”.
Function Information Graph Sketch Description (What Changed?)
𝑦 = (𝑥 − 5)2
Vertex:
___________
Axis of Symmetry:
___________
𝑦 = (𝑥 + 3)2
Vertex:
___________
Axis of Symmetry:
___________
𝑦 = (𝑥 − 7)2
Vertex:
___________
Axis of Symmetry:
___________
What do you think the value of ℎ represents in the graph? How can you predict the graph of a quadratic function
knowing the value of ℎ in a vertex form 𝒚 = 𝒂(𝒙 − 𝒉)𝟐
+ 𝒌?
Part 3: Vertical Stretch and Compression
You will be comparing each function below to the “parent function” 𝑦 = 𝑥2
. You will need to enter each function into
“Y2” in the “y =” screen.
1. Use the formulas to find the vertex and axis of symmetry for each function. Label this in the appropriate space.
2. Sketch the new graph on top of the “parent function” graph in the table. Note any differences.
3. Describe how the graph changed. For example, you may put “the graph shifted left 8 spaces” or “the graph
reflected (flipped) over the x-axis”.
Function Information Graph Sketch Description (What Changed?)
𝑦 = 2𝑥2
Vertex:
___________
Axis of Symmetry:
___________
𝑦 = 5𝑥2
Vertex:
___________
Axis of Symmetry:
___________
𝑦 = 0.2𝑥2
Vertex:
___________
Axis of Symmetry:
___________
a) In a vertex form 𝒚 = 𝒂(𝒙 − 𝒉)𝟐
+ 𝒌, What do you think the value of 𝑎 represents in the graph?
b) What happens when the value of 𝑎 increases?
c) What happens when 0 < 𝑎 < 1? What happens when 𝑎 > 1?
Part 4: Reflection
You will be comparing each function below to the “parent function” 𝑦 = 𝑥2
. You will need to enter each function into
“Y2” in the “y =” screen.
1. Use the formulas to find the vertex and axis of symmetry for each function. Label this in the appropriate space.
2. Sketch the new graph on top of the “parent function” graph in the table. Note any differences.
3. Describe how the graph changed. For example, you may put “the graph shifted left 8 spaces” or “the graph
reflected (flipped) over the x-axis”.
Function Information Graph Sketch Description (What Changed?)
𝑦 = −𝑥2
Vertex:
___________
Axis of Symmetry:
___________
𝑦 = −5𝑥2
Vertex:
___________
Axis of Symmetry:
___________
𝑦 = −0.2𝑥2
Vertex:
___________
Axis of Symmetry:
___________
a) What happens when the value of 𝑎 is negative?
b) Are there any similarities to part 3?
Part 5: Practice
1. Predict how each function will change from the parent function 𝑦 = 𝑥2
. Write a short sentence describing the
transformation. Part (a) is done for you as an example.
a) 𝑦 = 2𝑥2
+ 6 b) 𝑦 = 𝑥2
− 2
The graph will be translated up by 6 units.
It will also vertically stretched by a factor of 2.
c) 𝑦 = 2𝑥2
d) 𝑦 = −0.5𝑥2
e) 𝑦 = −0.5𝑥2
+ 8 f) 𝑦 = 4𝑥2
− 1
g) 𝑦 = 0.2𝑥2
+ 4 h) 𝑦 = −3𝑥2
− 9
2. Try graphing some quadratics with different values of ℎ and 𝑘. Is it easy to predict the location or shape of the
graph based on the value of ℎ and 𝑘?
3. Quickly graph the following quadratics. These can be done without making a table.
a) 𝑓(𝑥) = 𝑥2
− 8 b) 𝑦 = 𝑥2
+ 2
c) 𝑦 = −2𝑥2
d) 2𝑥2
− 6
e) 𝑓(𝑥) = −𝑥2
f) 𝑓(𝑥) = −
1
2
𝑥2
− 1
Using Calculator
Use a graphing calculator to graph each quadratic function (sketch the graph on the coordinate plane). Then find the
solutions (x-intercepts). Round to 2 decimal places.
a) 𝑦 = 𝑥2
− 3𝑥 + 1 b) 𝑓(𝑥) = −2𝑥2
+ 7 c) 𝑦 = 𝑥2
− 𝑥 + 2

Transformation.docx

  • 1.
    Section 9.3: Transformationsof Quadratic Functions Name: ___________________________________ Calculator Exploration Worksheet Honors Algebra I Transformation of Quadratic Functions In Vertex Form 𝒚 = 𝒂(𝒙 − 𝒉)𝟐 + 𝒌 𝑊ℎ𝑎𝑡 𝑑𝑜 𝑎, ℎ, 𝑎𝑛𝑑 𝑘 𝑑𝑜 𝑡𝑜 𝑎 𝑝𝑎𝑟𝑎𝑏𝑜𝑙𝑎? Instructions: We will be investigating the effects of different coefficients in quadratic functions on the shape of the curve. We will be using our calculators to accomplish this. This worksheet will guide you through the steps to understanding the different effects on the graph. Setup 1. Find a partner (NO GROUPS OF 3 UNLESS ONE PERSON IS LEFT!!). One person should be in charge of using the calculator and the other person should be in charge of writing down your answers on this worksheet. 2. Make sure you are both familiar with the calculator. We will be using the TI-83 today, so make sure at least one person in your group has a TI-83 graphing calculator. 3. The major screens to know about include the “y=” screen (where you put in your equations), the “graph” screen (where you see your equations graphed), and the “table” screen (where you can see a table of values for your equation).
  • 2.
    Part 1: VerticalTranslation You will be comparing each function below to the “parent function” 𝑦 = 𝑥2 . You will need to enter each function into “Y2” in the “y =” screen. 1. Use the formulas to find the vertex and axis of symmetry for each function. Label this in the appropriate space. 2. Sketch the new graph on top of the “parent function” graph in the table. Note any differences. 3. Describe how the graph changed. For example, you may put “the graph shifted left 8 spaces” or “the graph reflected (flipped) over the x-axis”. Function Information Graph Sketch Description (What Changed?) 𝑦 = 𝑥2 + 5 Vertex: ___________ Axis of Symmetry: ___________ 𝑦 = 𝑥2 + 3 Vertex: ___________ Axis of Symmetry: ___________ 𝑦 = 𝑥2 − 7 Vertex: ___________ Axis of Symmetry: ___________ What do you think the value of 𝑘 represents in the graph? How can you predict the graph of a quadratic function knowing the value of 𝑘 in a vertex form 𝒚 = 𝒂(𝒙 − 𝒉)𝟐 + 𝒌?
  • 3.
    Part 2: HorizontalTranslation You will be comparing each function below to the “parent function” 𝑦 = 𝑥2 . You will need to enter each function into “Y2” in the “y =” screen. 1. Use the formulas to find the vertex and axis of symmetry for each function. Label this in the appropriate space. 2. Sketch the new graph on top of the “parent function” graph in the table. Note any differences. 3. Describe how the graph changed. For example, you may put “the graph shifted left 8 spaces” or “the graph reflected (flipped) over the x-axis”. Function Information Graph Sketch Description (What Changed?) 𝑦 = (𝑥 − 5)2 Vertex: ___________ Axis of Symmetry: ___________ 𝑦 = (𝑥 + 3)2 Vertex: ___________ Axis of Symmetry: ___________ 𝑦 = (𝑥 − 7)2 Vertex: ___________ Axis of Symmetry: ___________ What do you think the value of ℎ represents in the graph? How can you predict the graph of a quadratic function knowing the value of ℎ in a vertex form 𝒚 = 𝒂(𝒙 − 𝒉)𝟐 + 𝒌?
  • 4.
    Part 3: VerticalStretch and Compression You will be comparing each function below to the “parent function” 𝑦 = 𝑥2 . You will need to enter each function into “Y2” in the “y =” screen. 1. Use the formulas to find the vertex and axis of symmetry for each function. Label this in the appropriate space. 2. Sketch the new graph on top of the “parent function” graph in the table. Note any differences. 3. Describe how the graph changed. For example, you may put “the graph shifted left 8 spaces” or “the graph reflected (flipped) over the x-axis”. Function Information Graph Sketch Description (What Changed?) 𝑦 = 2𝑥2 Vertex: ___________ Axis of Symmetry: ___________ 𝑦 = 5𝑥2 Vertex: ___________ Axis of Symmetry: ___________ 𝑦 = 0.2𝑥2 Vertex: ___________ Axis of Symmetry: ___________ a) In a vertex form 𝒚 = 𝒂(𝒙 − 𝒉)𝟐 + 𝒌, What do you think the value of 𝑎 represents in the graph? b) What happens when the value of 𝑎 increases? c) What happens when 0 < 𝑎 < 1? What happens when 𝑎 > 1?
  • 5.
    Part 4: Reflection Youwill be comparing each function below to the “parent function” 𝑦 = 𝑥2 . You will need to enter each function into “Y2” in the “y =” screen. 1. Use the formulas to find the vertex and axis of symmetry for each function. Label this in the appropriate space. 2. Sketch the new graph on top of the “parent function” graph in the table. Note any differences. 3. Describe how the graph changed. For example, you may put “the graph shifted left 8 spaces” or “the graph reflected (flipped) over the x-axis”. Function Information Graph Sketch Description (What Changed?) 𝑦 = −𝑥2 Vertex: ___________ Axis of Symmetry: ___________ 𝑦 = −5𝑥2 Vertex: ___________ Axis of Symmetry: ___________ 𝑦 = −0.2𝑥2 Vertex: ___________ Axis of Symmetry: ___________ a) What happens when the value of 𝑎 is negative? b) Are there any similarities to part 3?
  • 6.
    Part 5: Practice 1.Predict how each function will change from the parent function 𝑦 = 𝑥2 . Write a short sentence describing the transformation. Part (a) is done for you as an example. a) 𝑦 = 2𝑥2 + 6 b) 𝑦 = 𝑥2 − 2 The graph will be translated up by 6 units. It will also vertically stretched by a factor of 2. c) 𝑦 = 2𝑥2 d) 𝑦 = −0.5𝑥2 e) 𝑦 = −0.5𝑥2 + 8 f) 𝑦 = 4𝑥2 − 1 g) 𝑦 = 0.2𝑥2 + 4 h) 𝑦 = −3𝑥2 − 9 2. Try graphing some quadratics with different values of ℎ and 𝑘. Is it easy to predict the location or shape of the graph based on the value of ℎ and 𝑘?
  • 7.
    3. Quickly graphthe following quadratics. These can be done without making a table. a) 𝑓(𝑥) = 𝑥2 − 8 b) 𝑦 = 𝑥2 + 2 c) 𝑦 = −2𝑥2 d) 2𝑥2 − 6 e) 𝑓(𝑥) = −𝑥2 f) 𝑓(𝑥) = − 1 2 𝑥2 − 1 Using Calculator Use a graphing calculator to graph each quadratic function (sketch the graph on the coordinate plane). Then find the solutions (x-intercepts). Round to 2 decimal places. a) 𝑦 = 𝑥2 − 3𝑥 + 1 b) 𝑓(𝑥) = −2𝑥2 + 7 c) 𝑦 = 𝑥2 − 𝑥 + 2