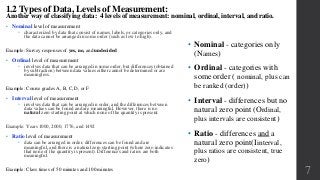
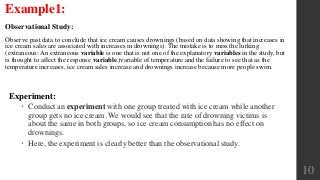
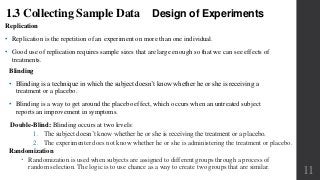
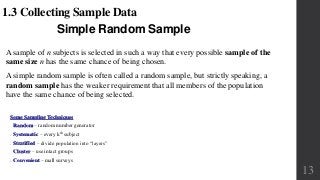
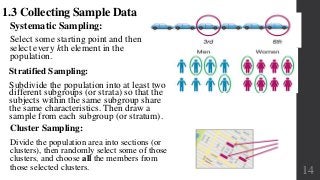
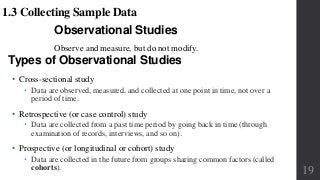
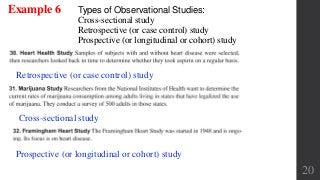
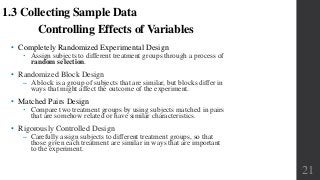
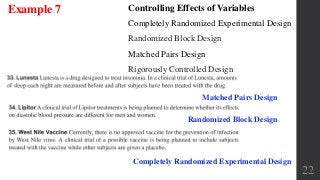
Elementary Statistics
Chapter 1:
Introduction to
Statistics
1.3 Collecting Sample
Data
1
Chapter 1:
Introduction to Statistics
1.1 Statistical and Critical Thinking
1.2 Types of Data
1.3 Collecting Sample Data
2
Population: It consists of all subjects (human or otherwise) that are
studied.
Sample: It is a subset of the population.
Census: The collection of data from every member of a population
3
1.1 Statistical and Critical Thinking, Key Concept
• Voluntary Response Sample
 Voluntary Response Sample or Self-Selected Sample is one in which the
respondents themselves decide whether to be included.
Statistics: The science of planning studies and experiments, obtaining
data, and organizing, summarizing, presenting, analyzing, and interpreting
those data and then drawing conclusions based on them.
Data: Collections of observations, such as measurements, genders, or
survey responses
The final step in our statistical process involves conclusions, and we should develop an
ability to distinguish between statistical significance and practical significance.
• Statistical Significance
 Statistical significance is achieved in a study if the likelihood of an event occurring
by chance is 5% or less.
 Getting 98 girls in 100 random births is statistically significant because such an
extreme outcome is not likely to result from random chance.
 Getting 52 girls in 100 births is not statistically significant because that event could
easily occur with random chance.
4
1.1 Statistical and Critical Thinking, Conclude
• Practical Significance
 It is possible that some treatment or finding is effective, but common sense might
suggest that the treatment or finding does not make enough of a difference to justify
its use or to be practical.
• Misleading Conclusions
 When forming a conclusion based on a statistical analysis, we should make statements that are clear
even to those who have no understanding of statistics and its terminology.
• Sample Data Reported Instead of Measured
 When collecting data from people, it is better to take measurements yourself instead of asking
subjects to report results.
• Loaded Questions
 If survey results are not worded carefully, the results of a study can be misleading.
• Order of Questions
 Sometimes survey questions are unintentionally loaded by the order of the items being considered.
• Nonresponse
 A nonresponse occurs when someone either refuses to respond or is unavailable.
• Percentages
 Some studies cite misleading percentages. Note that 100% of some quantity is all of it, but if there
are references made to percentages that exceed 100%, such references are often not justified.
5
1.1 Statistical and Critical Thinking
Analyzing Data: Potential Pitfalls
Data
Qualitative
Categorical
Quantitative
Numerical,
Can be ranked
Discrete
Countable
5, 29, 8000, etc.
Continuous
Can be decimals
2.59, 312.1, etc.
6
1.2 Types of Data, Key Concept, Quantitative Data
A major use of
statistics is to collect
and use sample data to
make conclusions
about populations.
• Parameter
 a numerical measurement
describing some characteristic
of a population
• Statistic
 a numerical measurement
describing some characteristic
of a sample
• Nominal level of measurement
 characterized by data that consist of names, labels, or categories only, and
the data cannot be arranged in some order (such as low to high).
Example: Survey responses of yes, no, and undecided
• Ordinal level of measurement
 involves data that can be arranged in some order, but differences (obtained
by subtraction) between data values either cannot be determined or are
meaningless.
Example: Course grades A, B, C, D, or F
• Interval level of measurement
 involves data that can be arranged in order, and the differences between
data values can be found and are meaningful. However, there is no
natural zero starting point at which none of the quantity is present.
Example: Years 1000, 2000, 1776, and 1492
• Ratio level of measurement
 data can be arranged in order, differences can be found and are
meaningful, and there is a natural zero starting point (where zero indicates
that none of the quantity is present). Differences and ratios are both
meaningful.
Example: Class times of 50 minutes and 100 minutes
1.2 Types of Data, Levels of Measurement:
Another way of classifying data: 4 levels of measurement: nominal, ordinal, interval, and ratio.
7
• Nominal - categories only
(Names)
• Ordinal - categories with
some order ( nominal, plus can
be ranked (order))
• Interval - differences but no
natural zero point (Ordinal,
plus intervals are consistent)
• Ratio - differences and a
natural zero point(Iinterval,
plus ratios are consistent, true
zero)
Key Concept
The method used to collect sample data influences the quality of the statistical
analysis.
Of particular importance is the simple random sample.
If sample data are not collected in an appropriate way, the data may be so
utterly useless that no amount of statistical torturing can salvage them.
1.3 Collecting Sample Data
The Gold Standard:
Randomization with placebo/treatment groups is sometimes called the “gold
standard” because it is so effective. (A placebo such as a sugar pill has no
medicinal effect.)
8
Basics of Collecting Data
Statistical methods are driven by the data that we collect. We typically obtain
data from two distinct sources: observational studies and experiments.
1.3 Collecting Sample Data
Experiment: Apply some treatment and then proceed to observe its effects on the
individuals. (The individuals in experiments are called experimental units, and they are often
called subjects when they are people.)
The researcher manipulates the independent (explanatory) variable and tries to determine
how the manipulation influences the dependent (outcome) variable in an experimental study.
A confounding variable influences the dependent variable but cannot be separated from the
independent variable.
Observational study: Observing and measuring specific characteristics without
attempting to modify the individuals being studied
In an observational study, the researcher merely observes and tries to draw
conclusions based on the observations. 9
Example1:
Observational Study:
Observe past data to conclude that ice cream causes drownings (based on data showing that increases in
ice cream sales are associated with increases in drownings). The mistake is to miss the lurking
(extraneous: An extraneous variable is one that is not one of the explanatory variables in the study, but
is thought to affect the response variable.)variable of temperature and the failure to see that as the
temperature increases, ice cream sales increase and drownings increase because more people swim.
Experiment:
 Conduct an experiment with one group treated with ice cream while another
group gets no ice cream. We would see that the rate of drowning victims is
about the same in both groups, so ice cream consumption has no effect on
drownings.
 Here, the experiment is clearly better than the observational study.
10
Design of Experiments
Replication
• Replication is the repetition of an experiment on more than one individual.
• Good use of replication requires sample sizes that are large enough so that we can see effects of
treatments.
1.3 Collecting Sample Data
Blinding
• Blinding is a technique in which the subject doesn’t know whether he or she is receiving a
treatment or a placebo.
• Blinding is a way to get around the placebo effect, which occurs when an untreated subject
reports an improvement in symptoms.
Double-Blind: Blinding occurs at two levels:
1. The subject doesn’t know whether he or she is receiving the treatment or a placebo.
2. The experimenter does not know whether he or she is administering the treatment or placebo.
Randomization
 Randomization is used when subjects are assigned to different groups through a process of
random selection. The logic is to use chance as a way to create two groups that are similar.
11
12
Example 2
It’s an experiment, because subjects were given treatments
Observational study or experiment?
Double-Blind: Blinding occurs at two levels:
1. The subjects did not know whether they were receiving the treatment or a placebo.
2. Those who administered the pills did not knoweither.
Simple Random Sample
1.3 Collecting Sample Data
A sample of n subjects is selected in such a way that every possible sample of the
same size n has the same chance of being chosen.
A simple random sample is often called a random sample, but strictly speaking, a
random sample has the weaker requirement that all members of the population
have the same chance of being selected.
Some Sampling Techniques
• Random – random number generator
• Systematic – every kth subject
• Stratified – divide population into “layers”
• Cluster – use intact groups
• Convenient – mall surveys
13
Systematic Sampling:
Select some starting point and then
select every kth element in the
population.
1.3 Collecting Sample Data
Stratified Sampling:
Subdivide the population into at least two
different subgroups (or strata) so that the
subjects within the same subgroup share
the same characteristics. Then draw a
sample from each subgroup (or stratum).
Cluster Sampling:
Divide the population area into sections (or
clusters), then randomly select some of those
clusters, and choose all the members from
those selected clusters. 14
Multistage Sampling:
Collect data by using some combination of the basic sampling methods.
In a multistage sample design, pollsters select a sample in different stages,
and each stage might use different methods of sampling.
1.3 Collecting Sample Data
Convenience Sampling: Use data
that are very easy to get.
15
16
Example 3: Given the following
a. What type of sampling is used? Does it affect the result?
b. Is this an Observational study or experiment?
c. What is the response rate (%)? Is it low? In general what is the problem with
a very low response rate?
This is an Observational study because there was no treatment given to subjects .
717/5000 = 0.1434
17
What Sampling Technique is used?
Random, Systematic, Stratified, Cluster, Convenience
Convenience
Random
Cluster
Stratified
Systematic
Example 4
18
Observational study or experiment? Any problem?
Observational study, the sample is too small.
Experiment: Sample consists of male physicians only. It would be better to
include female physicians as well as males and females that re not physicians.
Example 5
Observational Studies
Observe and measure, but do not modify.
1.3 Collecting Sample Data
Types of Observational Studies
• Cross-sectional study
 Data are observed, measured, and collected at one point in time, not over a
period of time.
• Retrospective (or case control) study
 Data are collected from a past time period by going back in time (through
examination of records, interviews, and so on).
• Prospective (or longitudinal or cohort) study
 Data are collected in the future from groups sharing common factors (called
cohorts). 19
20
Types of Observational Studies:
Cross-sectional study
Retrospective (or case control) study
Prospective (or longitudinal or cohort) study
Retrospective (or case control) study
Cross-sectional study
Prospective (or longitudinal or cohort) study
Example 6
Controlling Effects of Variables
• Completely Randomized Experimental Design
 Assign subjects to different treatment groups through a process of
random selection.
• Randomized Block Design
‒ A block is a group of subjects that are similar, but blocks differ in
ways that might affect the outcome of the experiment.
• Matched Pairs Design
 Compare two treatment groups by using subjects matched in pairs
that are somehow related or have similar characteristics.
• Rigorously Controlled Design
‒ Carefully assign subjects to different treatment groups, so that
those given each treatment are similar in ways that are important
to the experiment.
1.3 Collecting Sample Data
21
22
Controlling Effects of Variables
Completely Randomized Experimental Design
Randomized Block Design
Matched Pairs Design
Rigorously Controlled Design
Matched Pairs Design
Randomized Block Design
Completely Randomized Experimental Design
Example 7
Sampling Errors
• No matter how well you plan and execute the sample collection process, there
is likely to be some error in the results.
• Sampling error (or random sampling error)
• occurs when the sample has been selected with a random method, but there is a
discrepancy between a sample result and the true population result; such an error
results from chance sample fluctuations. Nonsampling error
 Nonsampling is the result of human error, including such factors as wrong data
entries, computing errors, questions with biased wording, false data provided by
respondents, forming biased conclusions, or applying statistical methods that are
not appropriate for the circumstances.
• Nonrandom sampling error
 Nonrandom sampling error is the result of using a sampling method that is not
random, such as using a convenience sample or a voluntary response sample.
23
1.3 Collecting Sample Data
Confounding
• Confounding
 occurs in an experiment when the experimenter is not able to distinguish
between the effects of different factors.
 Try to plan the experiment so that confounding does not occur.
24

1.3 collecting sample data

  • 1.
    Elementary Statistics Chapter 1: Introductionto Statistics 1.3 Collecting Sample Data 1
  • 2.
    Chapter 1: Introduction toStatistics 1.1 Statistical and Critical Thinking 1.2 Types of Data 1.3 Collecting Sample Data 2
  • 3.
    Population: It consistsof all subjects (human or otherwise) that are studied. Sample: It is a subset of the population. Census: The collection of data from every member of a population 3 1.1 Statistical and Critical Thinking, Key Concept • Voluntary Response Sample  Voluntary Response Sample or Self-Selected Sample is one in which the respondents themselves decide whether to be included. Statistics: The science of planning studies and experiments, obtaining data, and organizing, summarizing, presenting, analyzing, and interpreting those data and then drawing conclusions based on them. Data: Collections of observations, such as measurements, genders, or survey responses
  • 4.
    The final stepin our statistical process involves conclusions, and we should develop an ability to distinguish between statistical significance and practical significance. • Statistical Significance  Statistical significance is achieved in a study if the likelihood of an event occurring by chance is 5% or less.  Getting 98 girls in 100 random births is statistically significant because such an extreme outcome is not likely to result from random chance.  Getting 52 girls in 100 births is not statistically significant because that event could easily occur with random chance. 4 1.1 Statistical and Critical Thinking, Conclude • Practical Significance  It is possible that some treatment or finding is effective, but common sense might suggest that the treatment or finding does not make enough of a difference to justify its use or to be practical.
  • 5.
    • Misleading Conclusions When forming a conclusion based on a statistical analysis, we should make statements that are clear even to those who have no understanding of statistics and its terminology. • Sample Data Reported Instead of Measured  When collecting data from people, it is better to take measurements yourself instead of asking subjects to report results. • Loaded Questions  If survey results are not worded carefully, the results of a study can be misleading. • Order of Questions  Sometimes survey questions are unintentionally loaded by the order of the items being considered. • Nonresponse  A nonresponse occurs when someone either refuses to respond or is unavailable. • Percentages  Some studies cite misleading percentages. Note that 100% of some quantity is all of it, but if there are references made to percentages that exceed 100%, such references are often not justified. 5 1.1 Statistical and Critical Thinking Analyzing Data: Potential Pitfalls
  • 6.
    Data Qualitative Categorical Quantitative Numerical, Can be ranked Discrete Countable 5,29, 8000, etc. Continuous Can be decimals 2.59, 312.1, etc. 6 1.2 Types of Data, Key Concept, Quantitative Data A major use of statistics is to collect and use sample data to make conclusions about populations. • Parameter  a numerical measurement describing some characteristic of a population • Statistic  a numerical measurement describing some characteristic of a sample
  • 7.
    • Nominal levelof measurement  characterized by data that consist of names, labels, or categories only, and the data cannot be arranged in some order (such as low to high). Example: Survey responses of yes, no, and undecided • Ordinal level of measurement  involves data that can be arranged in some order, but differences (obtained by subtraction) between data values either cannot be determined or are meaningless. Example: Course grades A, B, C, D, or F • Interval level of measurement  involves data that can be arranged in order, and the differences between data values can be found and are meaningful. However, there is no natural zero starting point at which none of the quantity is present. Example: Years 1000, 2000, 1776, and 1492 • Ratio level of measurement  data can be arranged in order, differences can be found and are meaningful, and there is a natural zero starting point (where zero indicates that none of the quantity is present). Differences and ratios are both meaningful. Example: Class times of 50 minutes and 100 minutes 1.2 Types of Data, Levels of Measurement: Another way of classifying data: 4 levels of measurement: nominal, ordinal, interval, and ratio. 7 • Nominal - categories only (Names) • Ordinal - categories with some order ( nominal, plus can be ranked (order)) • Interval - differences but no natural zero point (Ordinal, plus intervals are consistent) • Ratio - differences and a natural zero point(Iinterval, plus ratios are consistent, true zero)
  • 8.
    Key Concept The methodused to collect sample data influences the quality of the statistical analysis. Of particular importance is the simple random sample. If sample data are not collected in an appropriate way, the data may be so utterly useless that no amount of statistical torturing can salvage them. 1.3 Collecting Sample Data The Gold Standard: Randomization with placebo/treatment groups is sometimes called the “gold standard” because it is so effective. (A placebo such as a sugar pill has no medicinal effect.) 8
  • 9.
    Basics of CollectingData Statistical methods are driven by the data that we collect. We typically obtain data from two distinct sources: observational studies and experiments. 1.3 Collecting Sample Data Experiment: Apply some treatment and then proceed to observe its effects on the individuals. (The individuals in experiments are called experimental units, and they are often called subjects when they are people.) The researcher manipulates the independent (explanatory) variable and tries to determine how the manipulation influences the dependent (outcome) variable in an experimental study. A confounding variable influences the dependent variable but cannot be separated from the independent variable. Observational study: Observing and measuring specific characteristics without attempting to modify the individuals being studied In an observational study, the researcher merely observes and tries to draw conclusions based on the observations. 9
  • 10.
    Example1: Observational Study: Observe pastdata to conclude that ice cream causes drownings (based on data showing that increases in ice cream sales are associated with increases in drownings). The mistake is to miss the lurking (extraneous: An extraneous variable is one that is not one of the explanatory variables in the study, but is thought to affect the response variable.)variable of temperature and the failure to see that as the temperature increases, ice cream sales increase and drownings increase because more people swim. Experiment:  Conduct an experiment with one group treated with ice cream while another group gets no ice cream. We would see that the rate of drowning victims is about the same in both groups, so ice cream consumption has no effect on drownings.  Here, the experiment is clearly better than the observational study. 10
  • 11.
    Design of Experiments Replication •Replication is the repetition of an experiment on more than one individual. • Good use of replication requires sample sizes that are large enough so that we can see effects of treatments. 1.3 Collecting Sample Data Blinding • Blinding is a technique in which the subject doesn’t know whether he or she is receiving a treatment or a placebo. • Blinding is a way to get around the placebo effect, which occurs when an untreated subject reports an improvement in symptoms. Double-Blind: Blinding occurs at two levels: 1. The subject doesn’t know whether he or she is receiving the treatment or a placebo. 2. The experimenter does not know whether he or she is administering the treatment or placebo. Randomization  Randomization is used when subjects are assigned to different groups through a process of random selection. The logic is to use chance as a way to create two groups that are similar. 11
  • 12.
    12 Example 2 It’s anexperiment, because subjects were given treatments Observational study or experiment? Double-Blind: Blinding occurs at two levels: 1. The subjects did not know whether they were receiving the treatment or a placebo. 2. Those who administered the pills did not knoweither.
  • 13.
    Simple Random Sample 1.3Collecting Sample Data A sample of n subjects is selected in such a way that every possible sample of the same size n has the same chance of being chosen. A simple random sample is often called a random sample, but strictly speaking, a random sample has the weaker requirement that all members of the population have the same chance of being selected. Some Sampling Techniques • Random – random number generator • Systematic – every kth subject • Stratified – divide population into “layers” • Cluster – use intact groups • Convenient – mall surveys 13
  • 14.
    Systematic Sampling: Select somestarting point and then select every kth element in the population. 1.3 Collecting Sample Data Stratified Sampling: Subdivide the population into at least two different subgroups (or strata) so that the subjects within the same subgroup share the same characteristics. Then draw a sample from each subgroup (or stratum). Cluster Sampling: Divide the population area into sections (or clusters), then randomly select some of those clusters, and choose all the members from those selected clusters. 14
  • 15.
    Multistage Sampling: Collect databy using some combination of the basic sampling methods. In a multistage sample design, pollsters select a sample in different stages, and each stage might use different methods of sampling. 1.3 Collecting Sample Data Convenience Sampling: Use data that are very easy to get. 15
  • 16.
    16 Example 3: Giventhe following a. What type of sampling is used? Does it affect the result? b. Is this an Observational study or experiment? c. What is the response rate (%)? Is it low? In general what is the problem with a very low response rate? This is an Observational study because there was no treatment given to subjects . 717/5000 = 0.1434
  • 17.
    17 What Sampling Techniqueis used? Random, Systematic, Stratified, Cluster, Convenience Convenience Random Cluster Stratified Systematic Example 4
  • 18.
    18 Observational study orexperiment? Any problem? Observational study, the sample is too small. Experiment: Sample consists of male physicians only. It would be better to include female physicians as well as males and females that re not physicians. Example 5
  • 19.
    Observational Studies Observe andmeasure, but do not modify. 1.3 Collecting Sample Data Types of Observational Studies • Cross-sectional study  Data are observed, measured, and collected at one point in time, not over a period of time. • Retrospective (or case control) study  Data are collected from a past time period by going back in time (through examination of records, interviews, and so on). • Prospective (or longitudinal or cohort) study  Data are collected in the future from groups sharing common factors (called cohorts). 19
  • 20.
    20 Types of ObservationalStudies: Cross-sectional study Retrospective (or case control) study Prospective (or longitudinal or cohort) study Retrospective (or case control) study Cross-sectional study Prospective (or longitudinal or cohort) study Example 6
  • 21.
    Controlling Effects ofVariables • Completely Randomized Experimental Design  Assign subjects to different treatment groups through a process of random selection. • Randomized Block Design ‒ A block is a group of subjects that are similar, but blocks differ in ways that might affect the outcome of the experiment. • Matched Pairs Design  Compare two treatment groups by using subjects matched in pairs that are somehow related or have similar characteristics. • Rigorously Controlled Design ‒ Carefully assign subjects to different treatment groups, so that those given each treatment are similar in ways that are important to the experiment. 1.3 Collecting Sample Data 21
  • 22.
    22 Controlling Effects ofVariables Completely Randomized Experimental Design Randomized Block Design Matched Pairs Design Rigorously Controlled Design Matched Pairs Design Randomized Block Design Completely Randomized Experimental Design Example 7
  • 23.
    Sampling Errors • Nomatter how well you plan and execute the sample collection process, there is likely to be some error in the results. • Sampling error (or random sampling error) • occurs when the sample has been selected with a random method, but there is a discrepancy between a sample result and the true population result; such an error results from chance sample fluctuations. Nonsampling error  Nonsampling is the result of human error, including such factors as wrong data entries, computing errors, questions with biased wording, false data provided by respondents, forming biased conclusions, or applying statistical methods that are not appropriate for the circumstances. • Nonrandom sampling error  Nonrandom sampling error is the result of using a sampling method that is not random, such as using a convenience sample or a voluntary response sample. 23 1.3 Collecting Sample Data
  • 24.
    Confounding • Confounding  occursin an experiment when the experimenter is not able to distinguish between the effects of different factors.  Try to plan the experiment so that confounding does not occur. 24