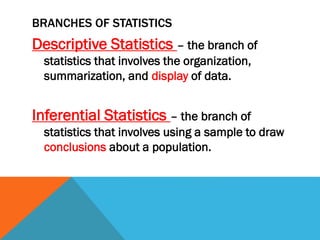
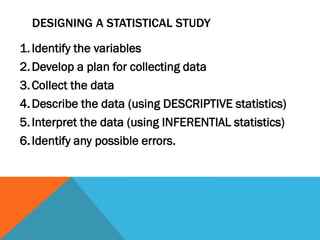
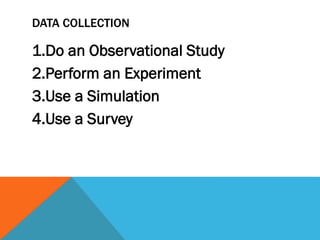
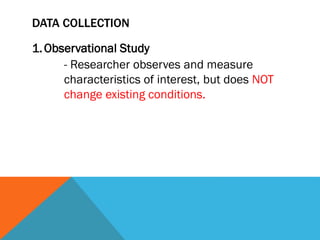
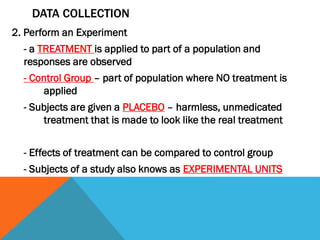
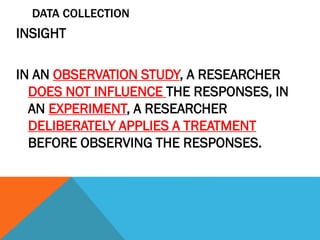
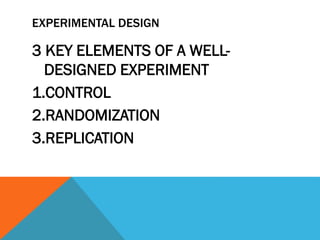
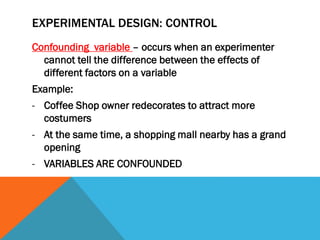
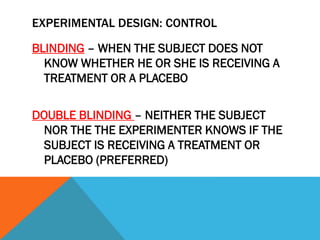
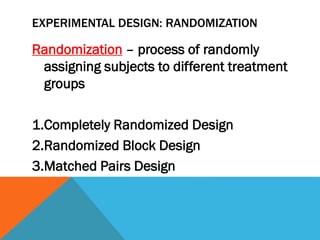
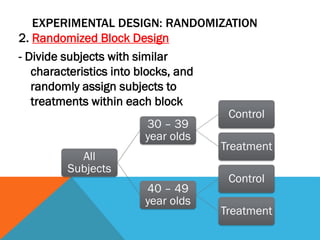
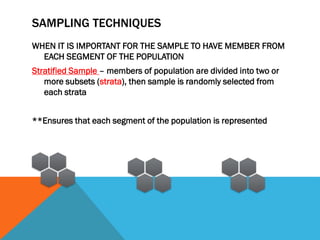
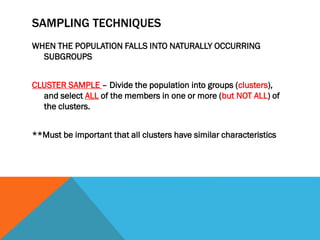
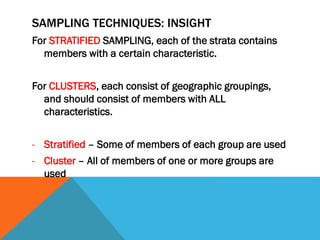
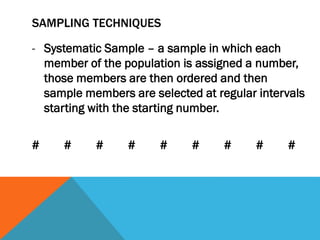
The document discusses key concepts in statistics including populations, samples, parameters, statistics, experimental design, and sampling techniques. It defines a population as all possible outcomes of interest and a sample as a subset of a population. Experimental design aims to control for confounding variables through randomization and replication. There are different sampling techniques for selecting samples such as simple random sampling, stratified sampling, and cluster sampling. Descriptive and inferential statistics are used to analyze and draw conclusions from data.


![SECTION 1.2 ASSIGNMENT
Case Study on Page 17 (SUBMIT) [Groups of 3 or less]
INDIVIDUAL:
Pg. 15 – 16 #1 - #24 ALL
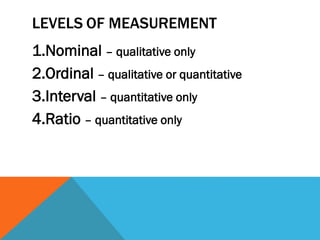
(Level of Measurement means: nominal, ordinal, interval or ratio)](https://image.slidesharecdn.com/stat4325is-230301053443-9747218c/85/Stat-4325IS-pdf-19-320.jpg)


![BASIC CONCEPTS in STAT 1 [Autosaved].pptx](https://cdn.slidesharecdn.com/ss_thumbnails/basicconceptsinstat1autosaved-221027115944-55c11ebb-thumbnail.jpg?width=640&height=640&fit=bounds)