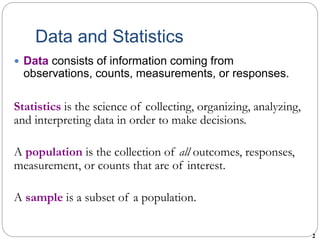
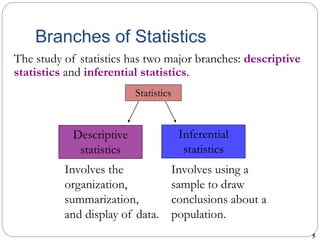
1. The document discusses key concepts in statistics including populations, samples, descriptive statistics, inferential statistics, qualitative and quantitative data, and scales of measurement.
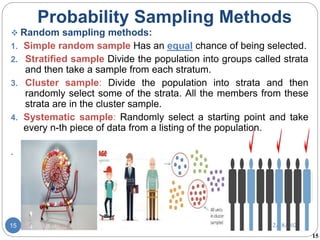
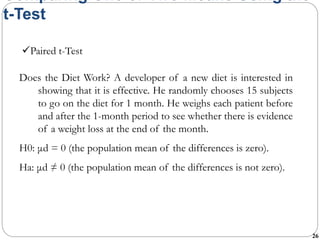
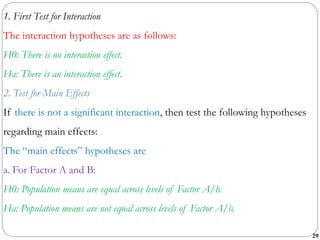
2. It provides examples of statistical tests that can be used including one-sample t-tests, two-sample t-tests, paired t-tests, one-way ANOVA tests, and examples of how they can be applied.
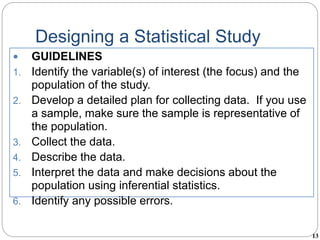
3. The guidelines for designing a statistical study are outlined including identifying variables of interest, developing a data collection plan, collecting and describing data, and interpreting results.