The document discusses principles and techniques for exploratory data analysis including:
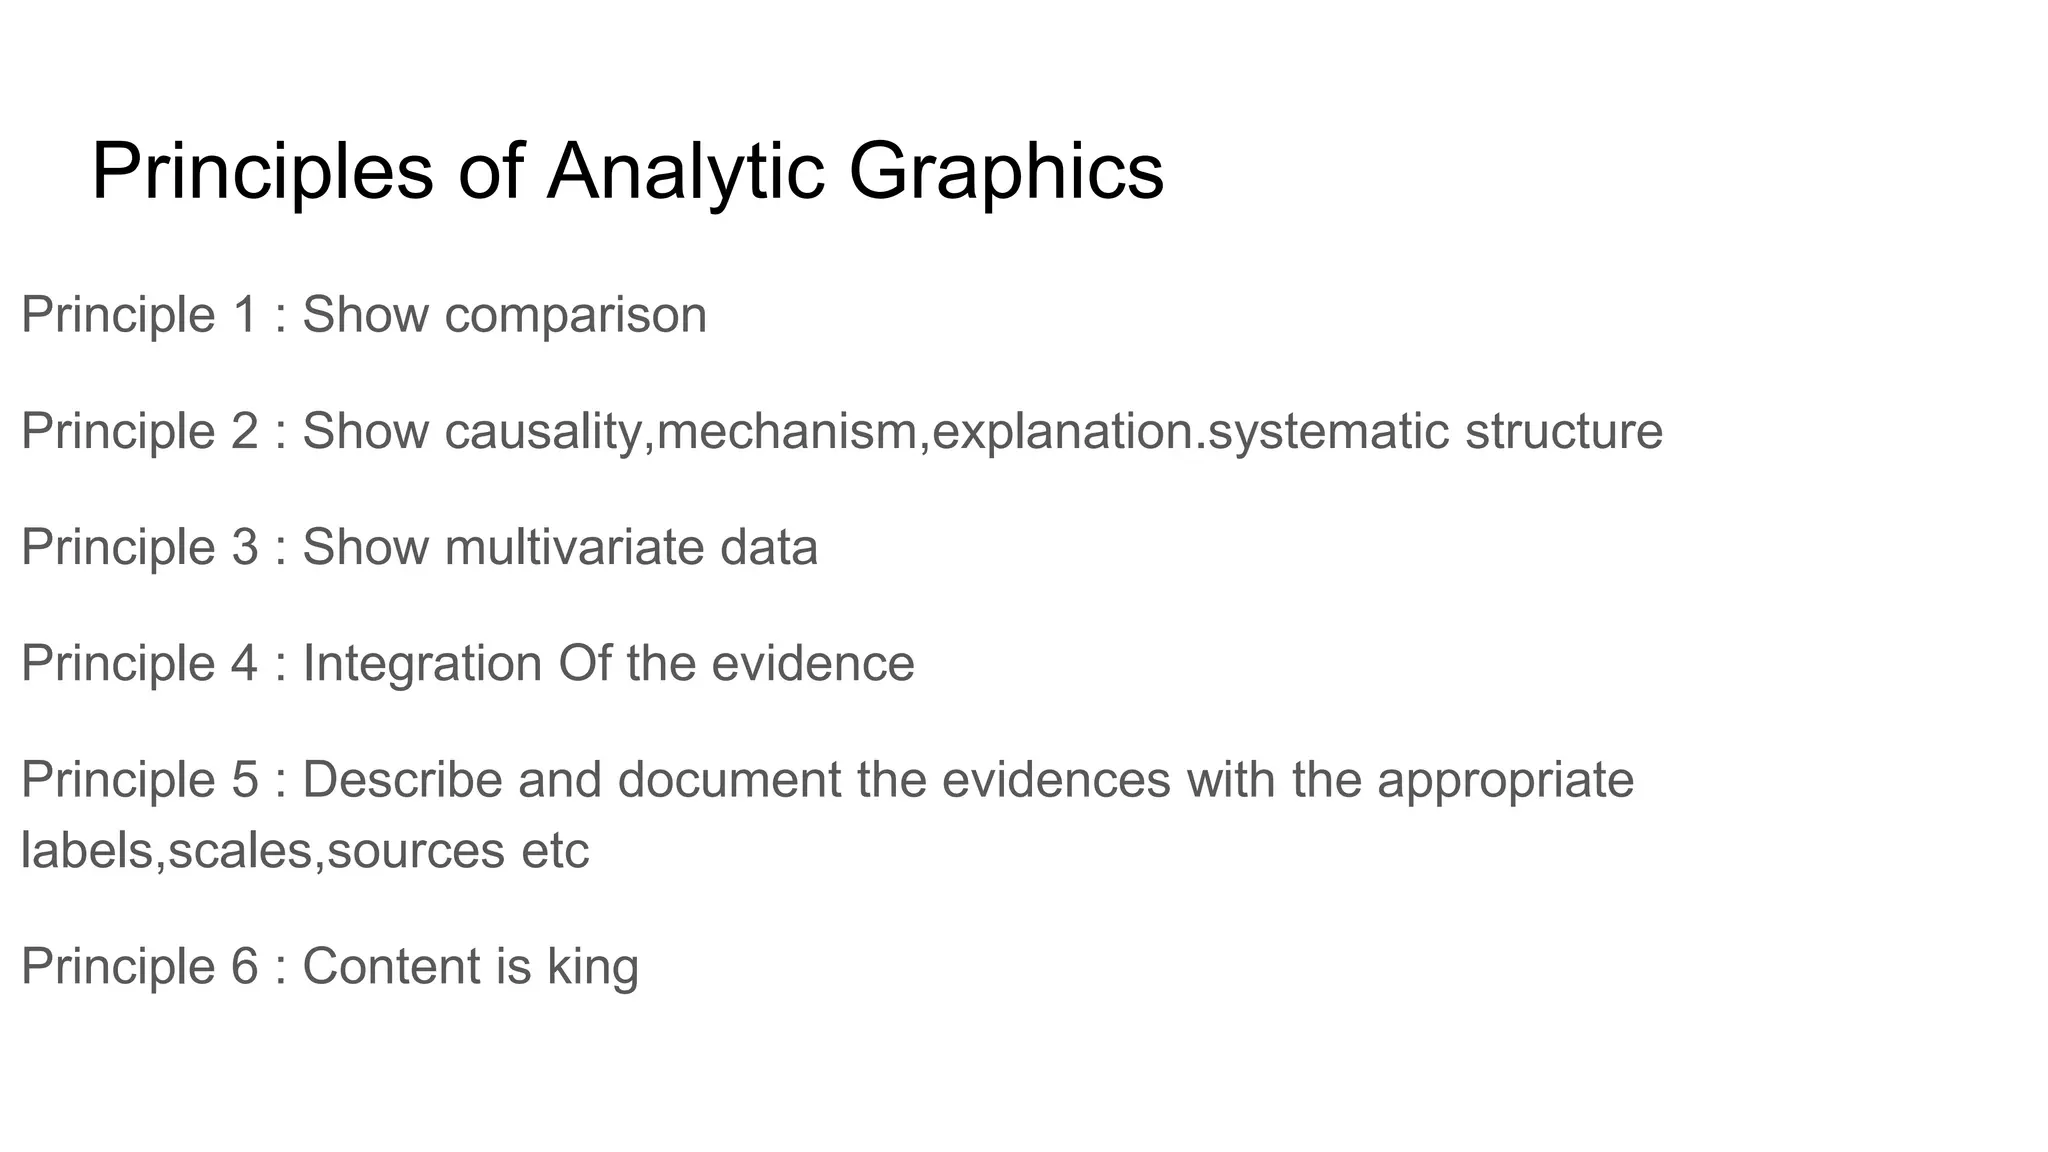
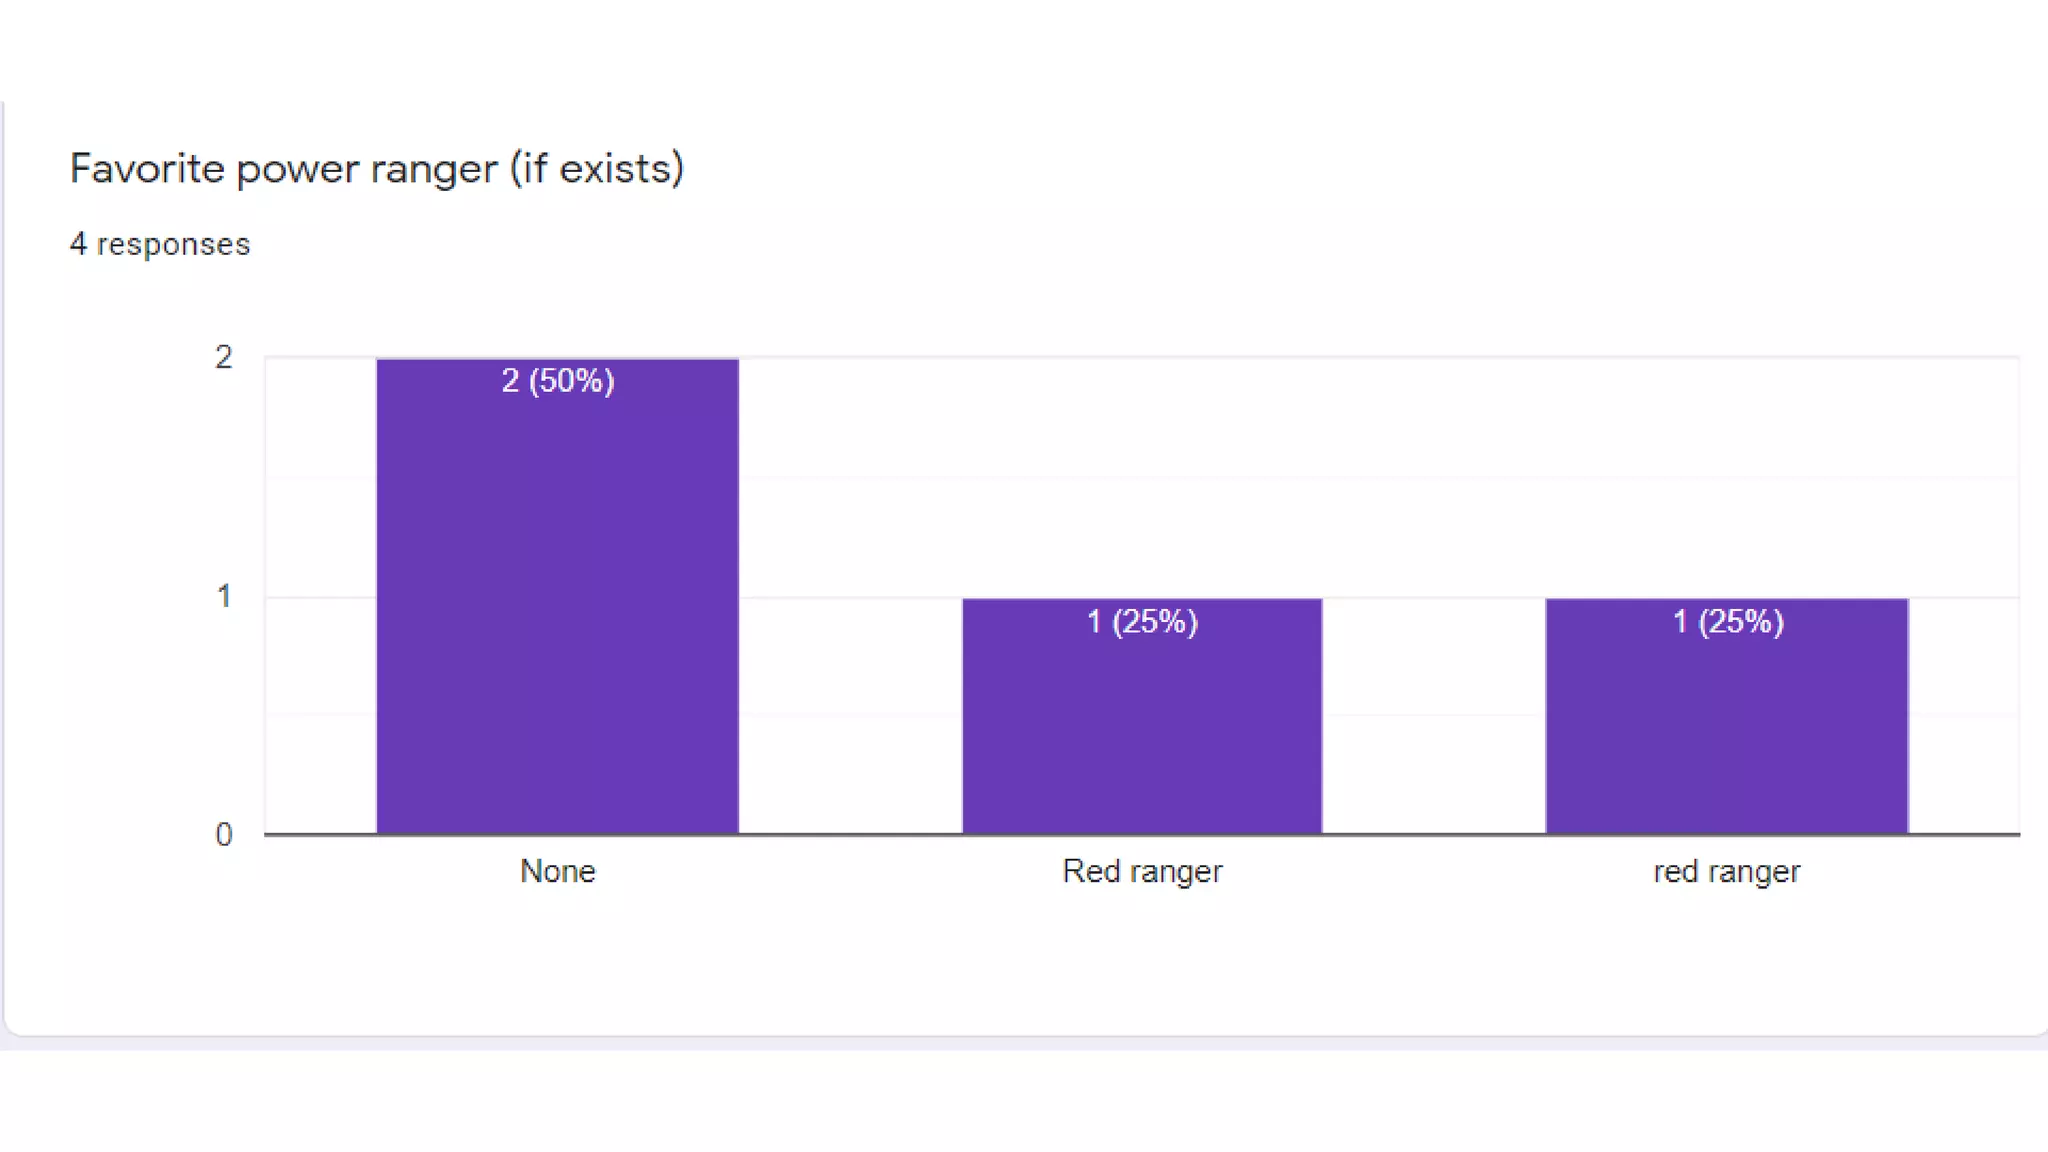
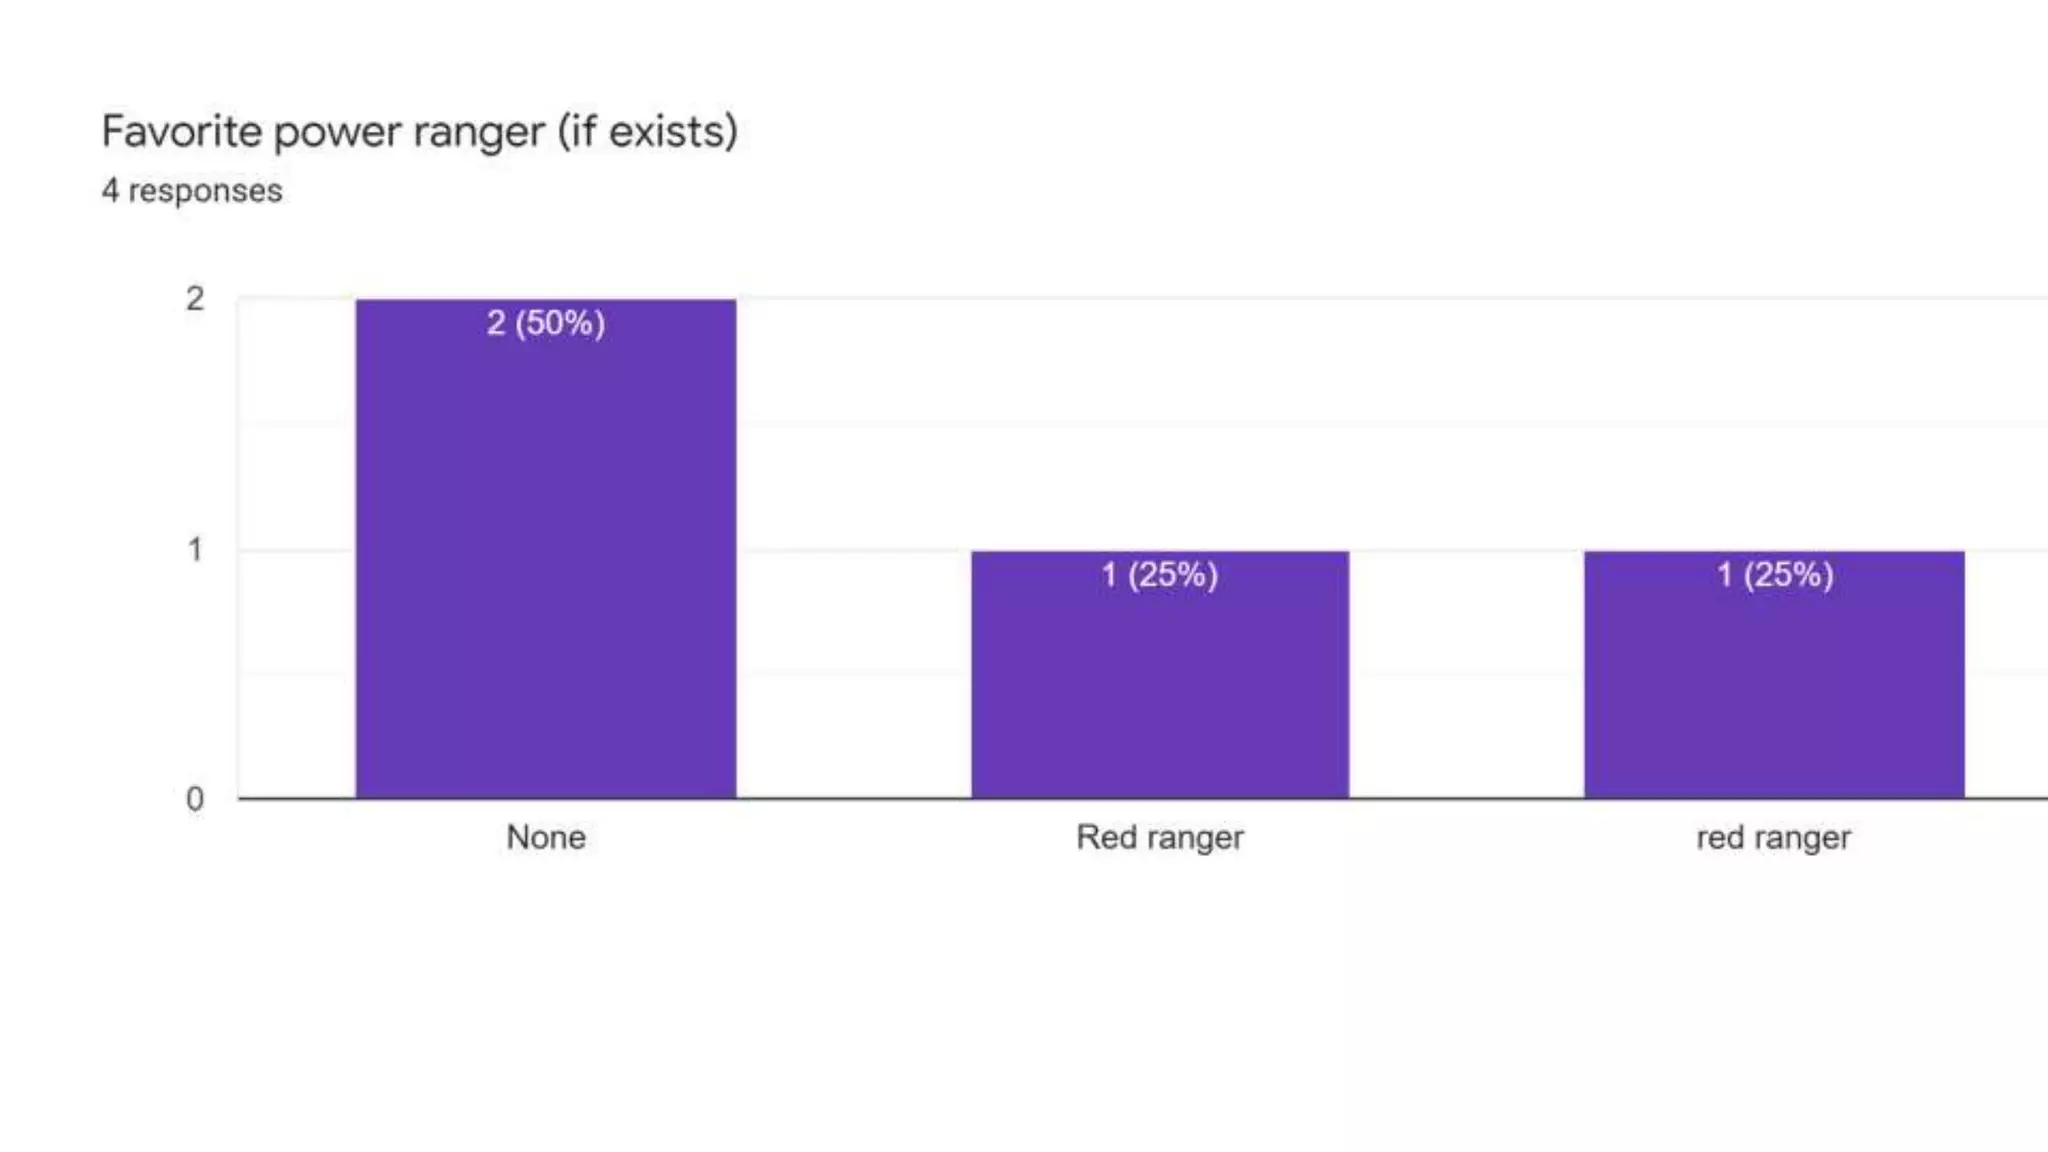
1) Showing comparisons, causality, and systematic structure through data visualization principles.
2) Creating one dimensional and two dimensional plots like scatter plots to understand data properties and find patterns.
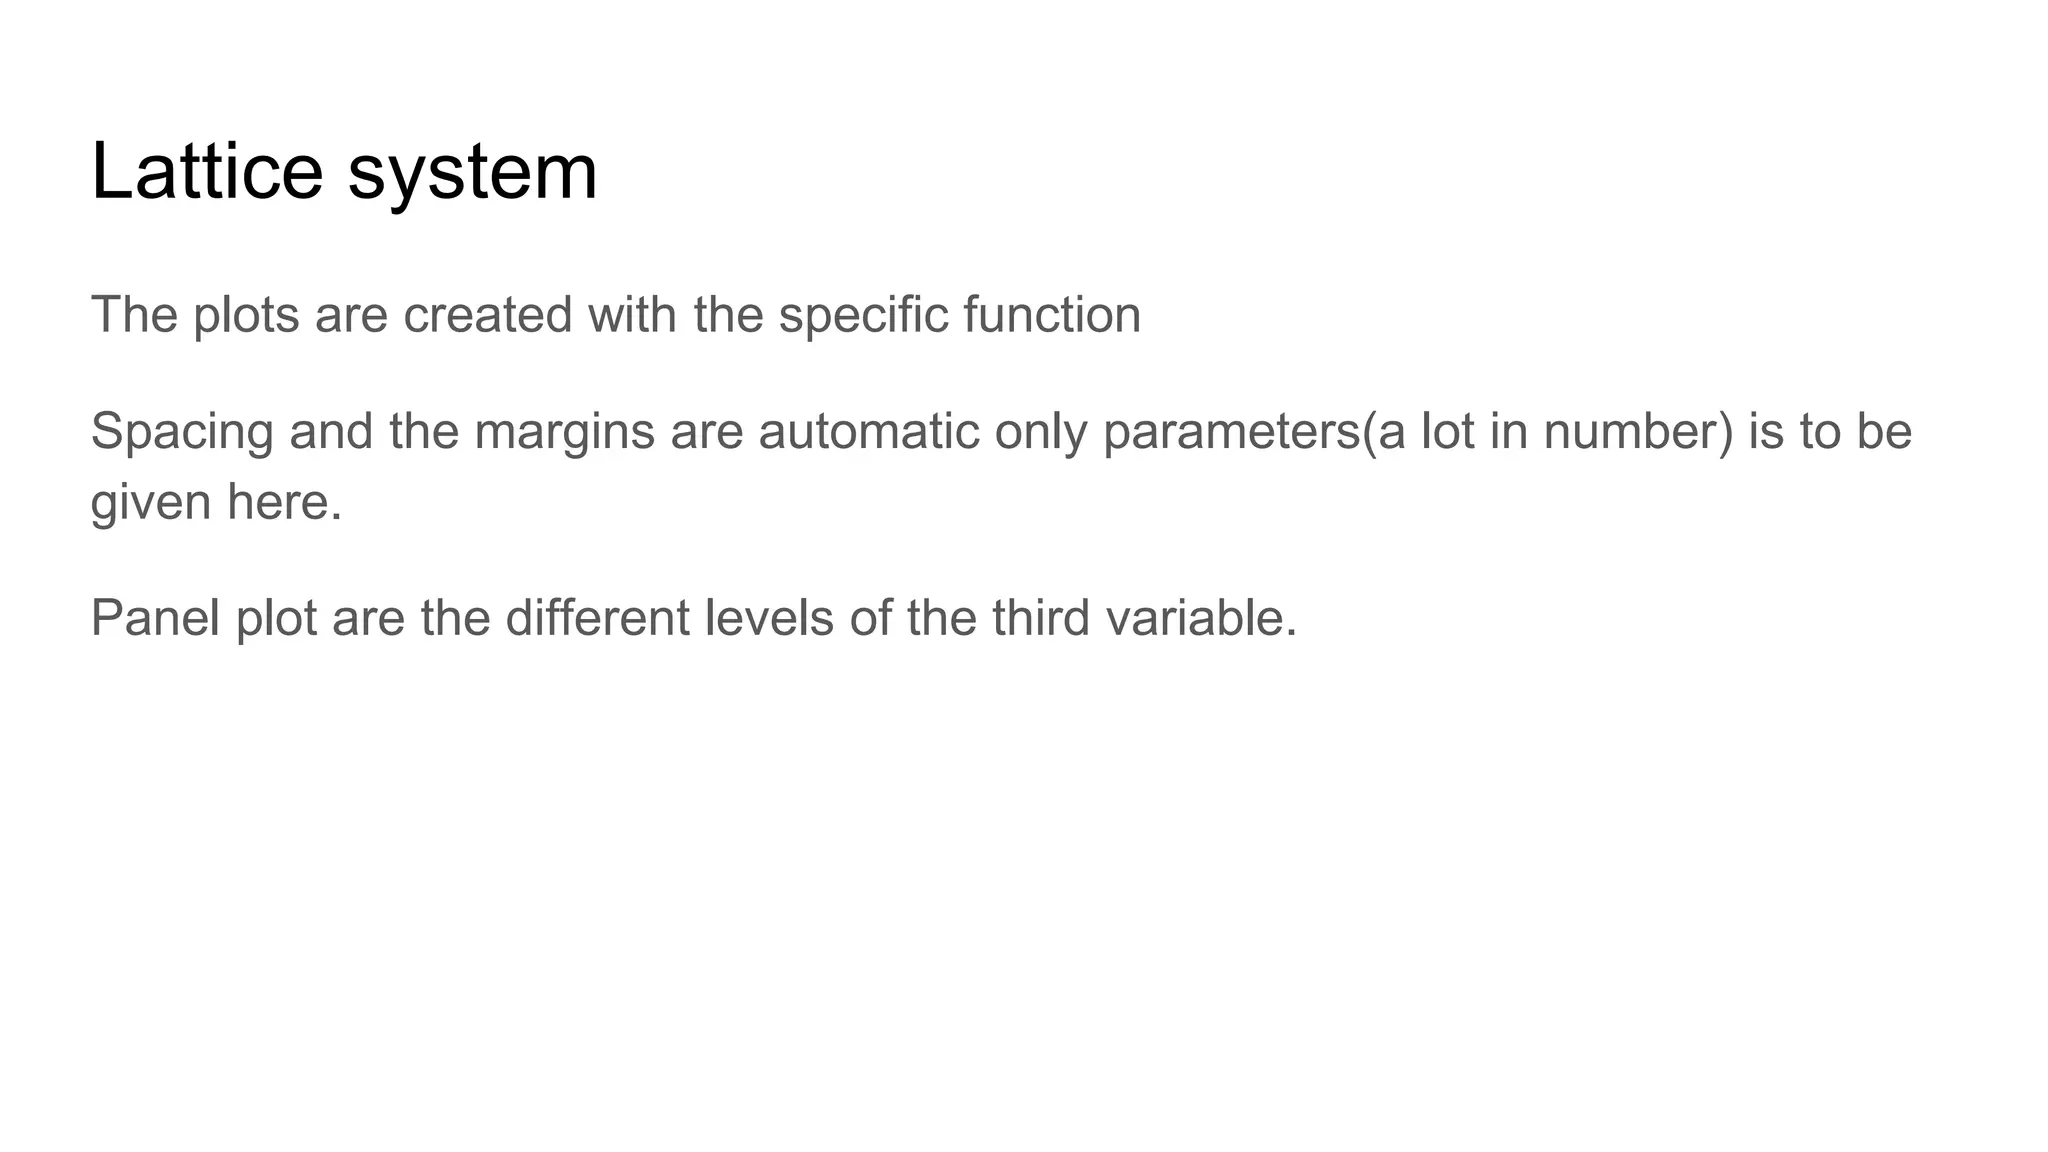
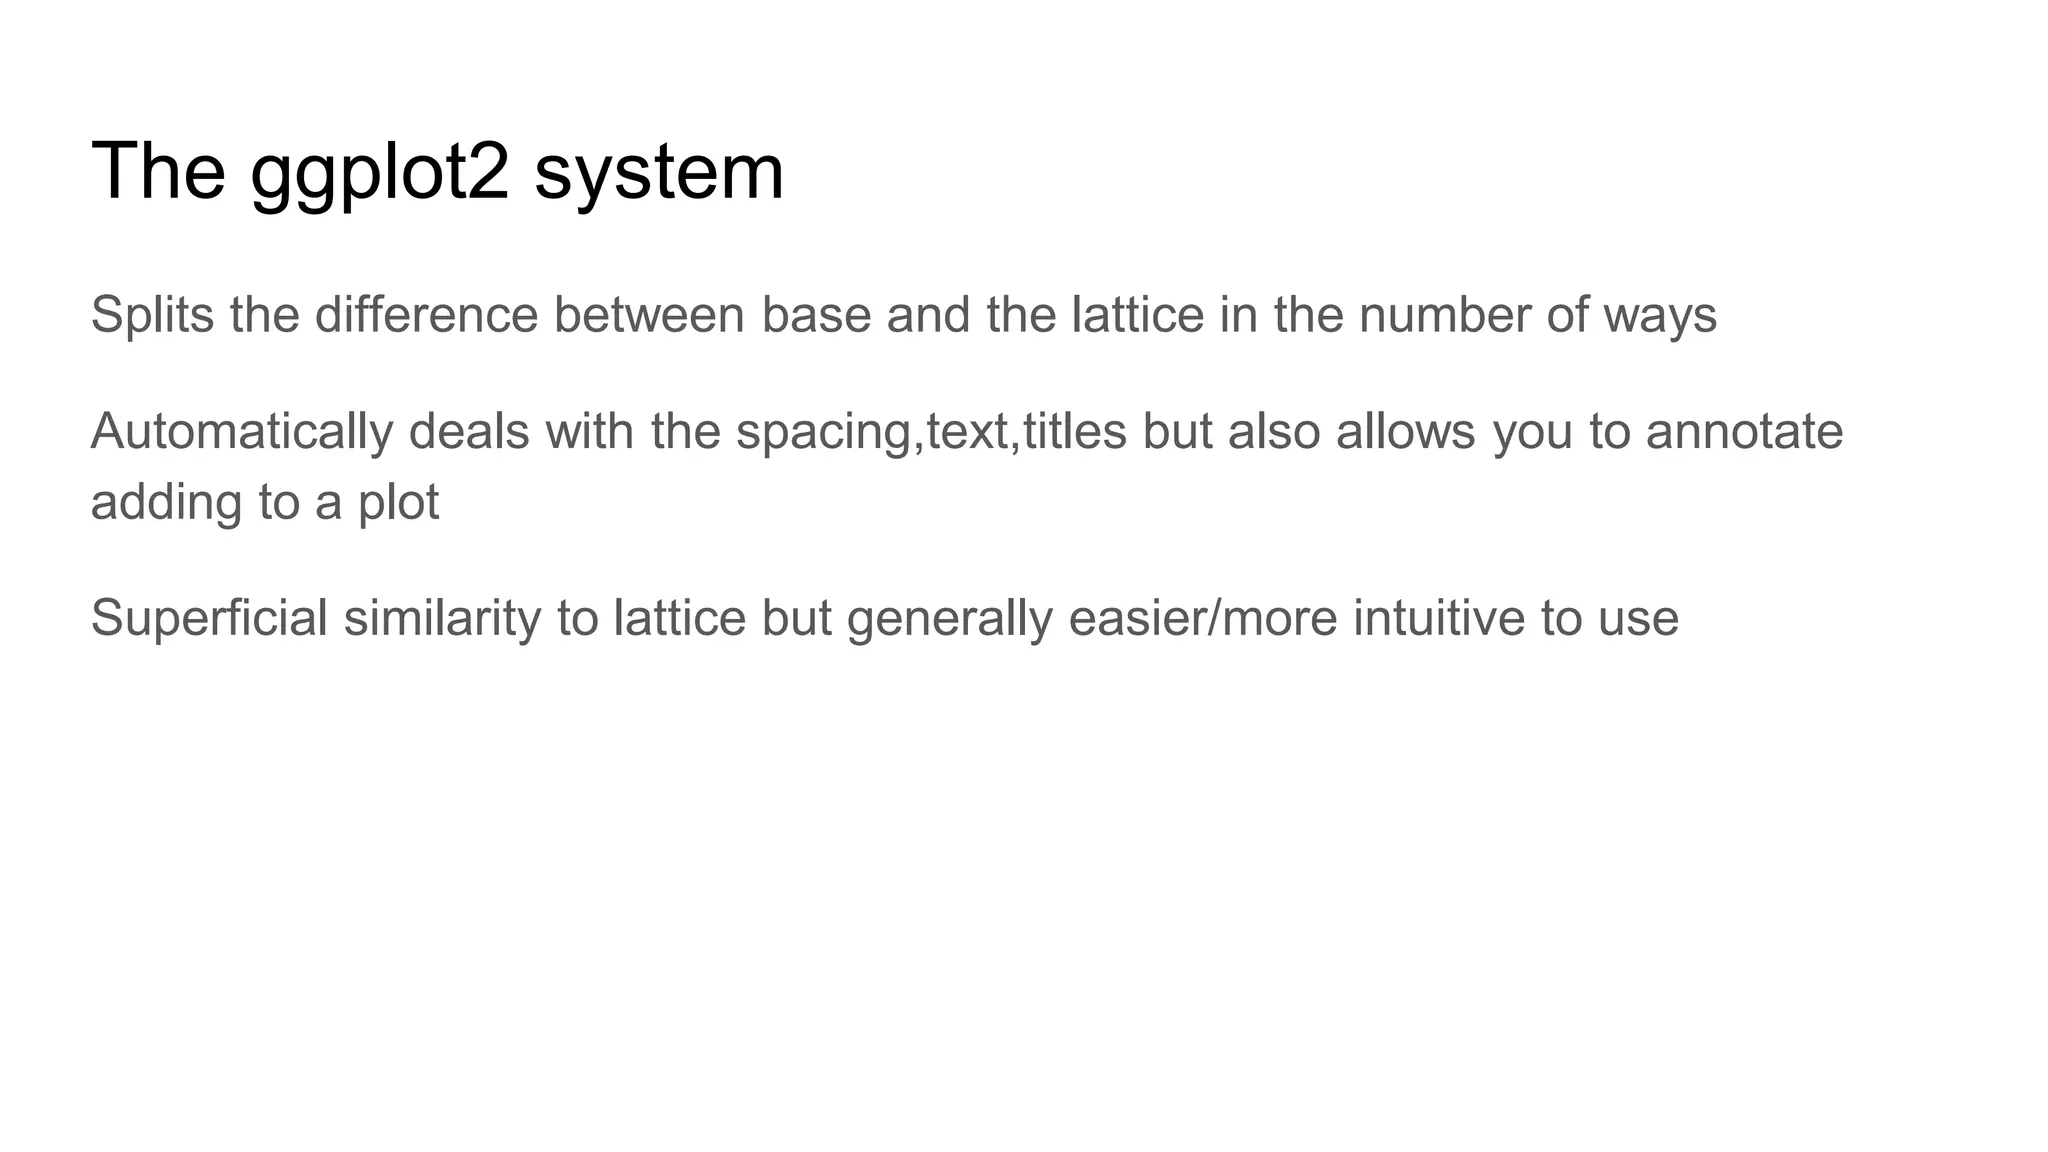
3) Using base plotting systems, lattice systems, and ggplot2 systems which offer different levels of customization for creating plots.
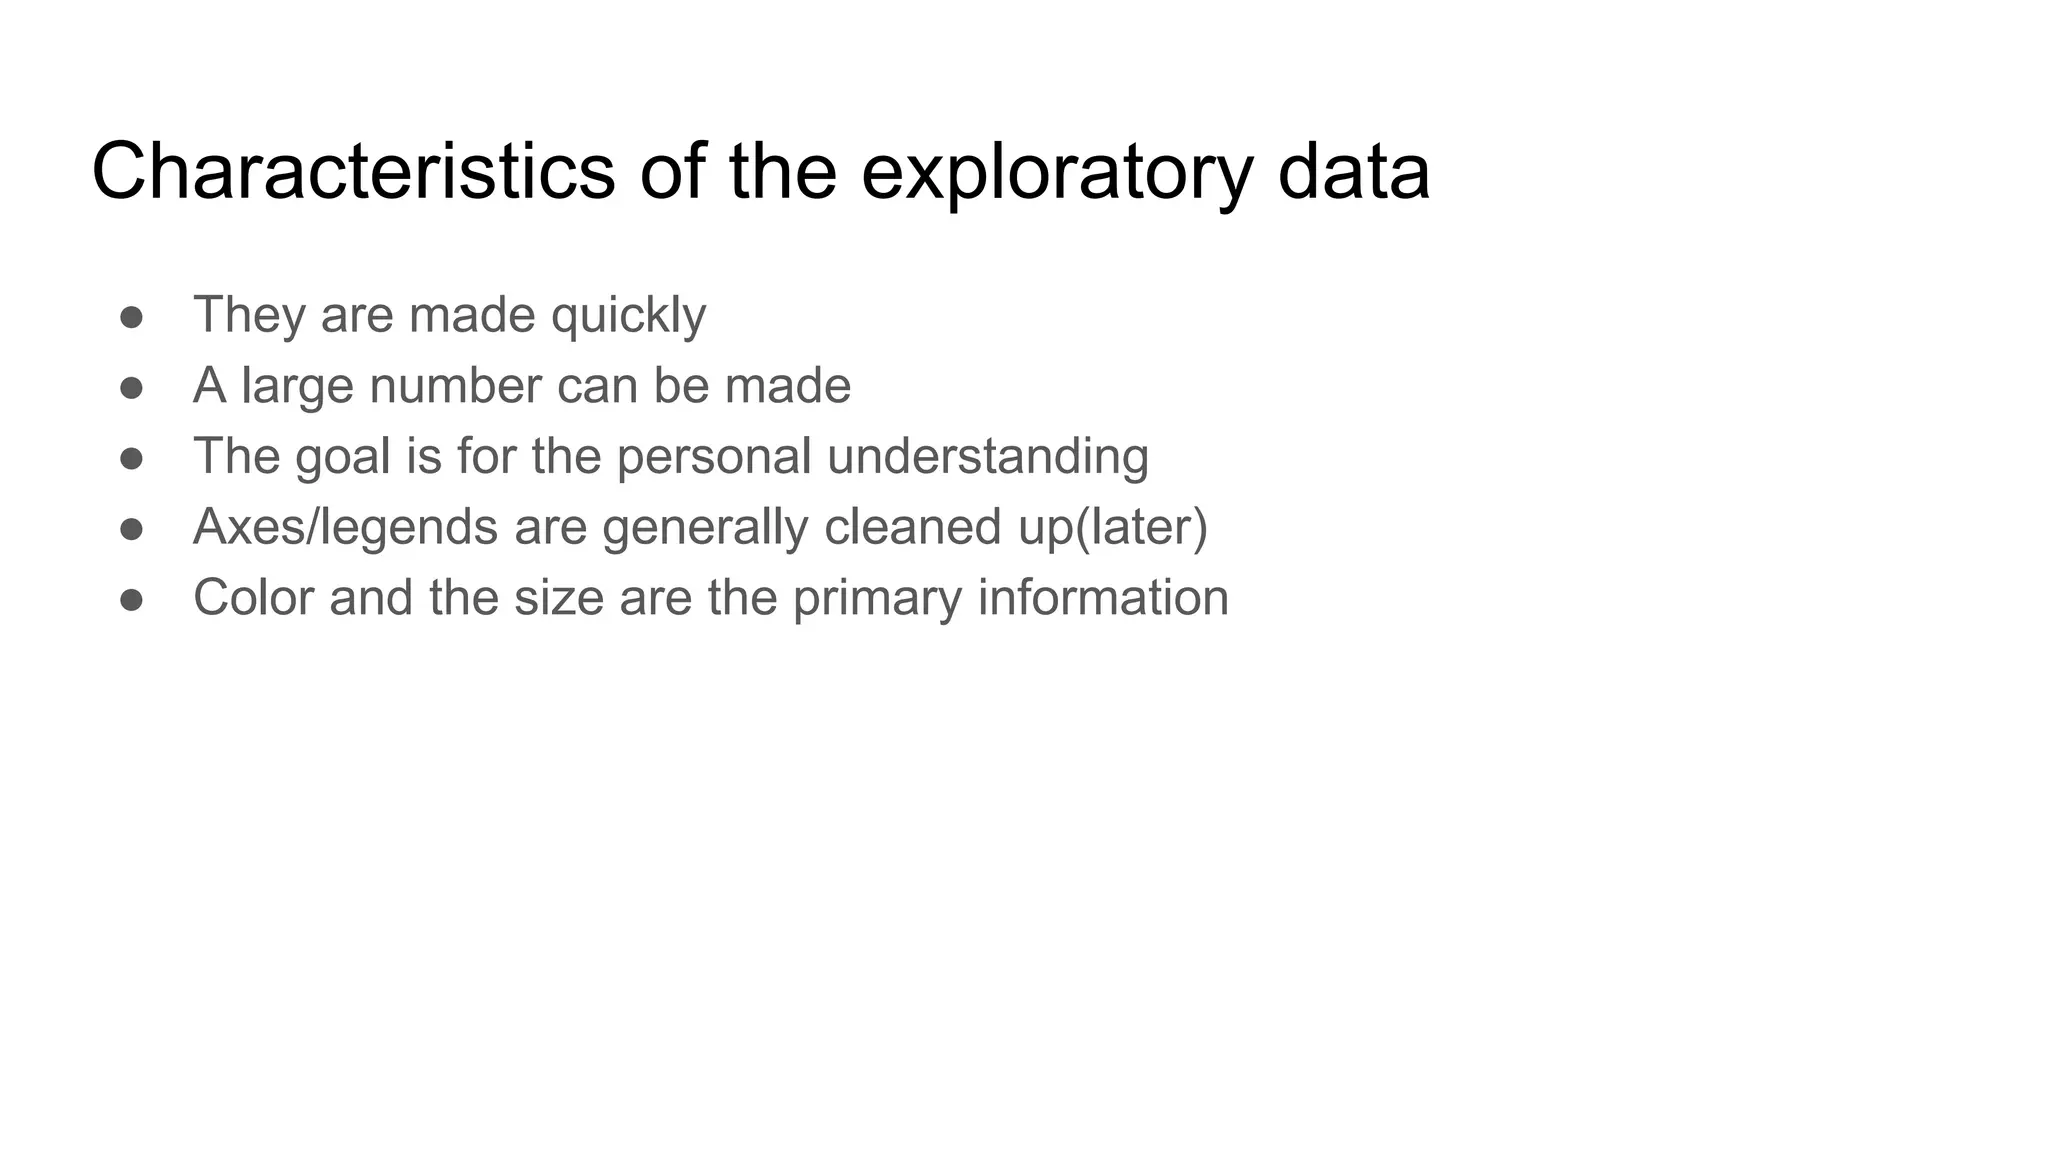
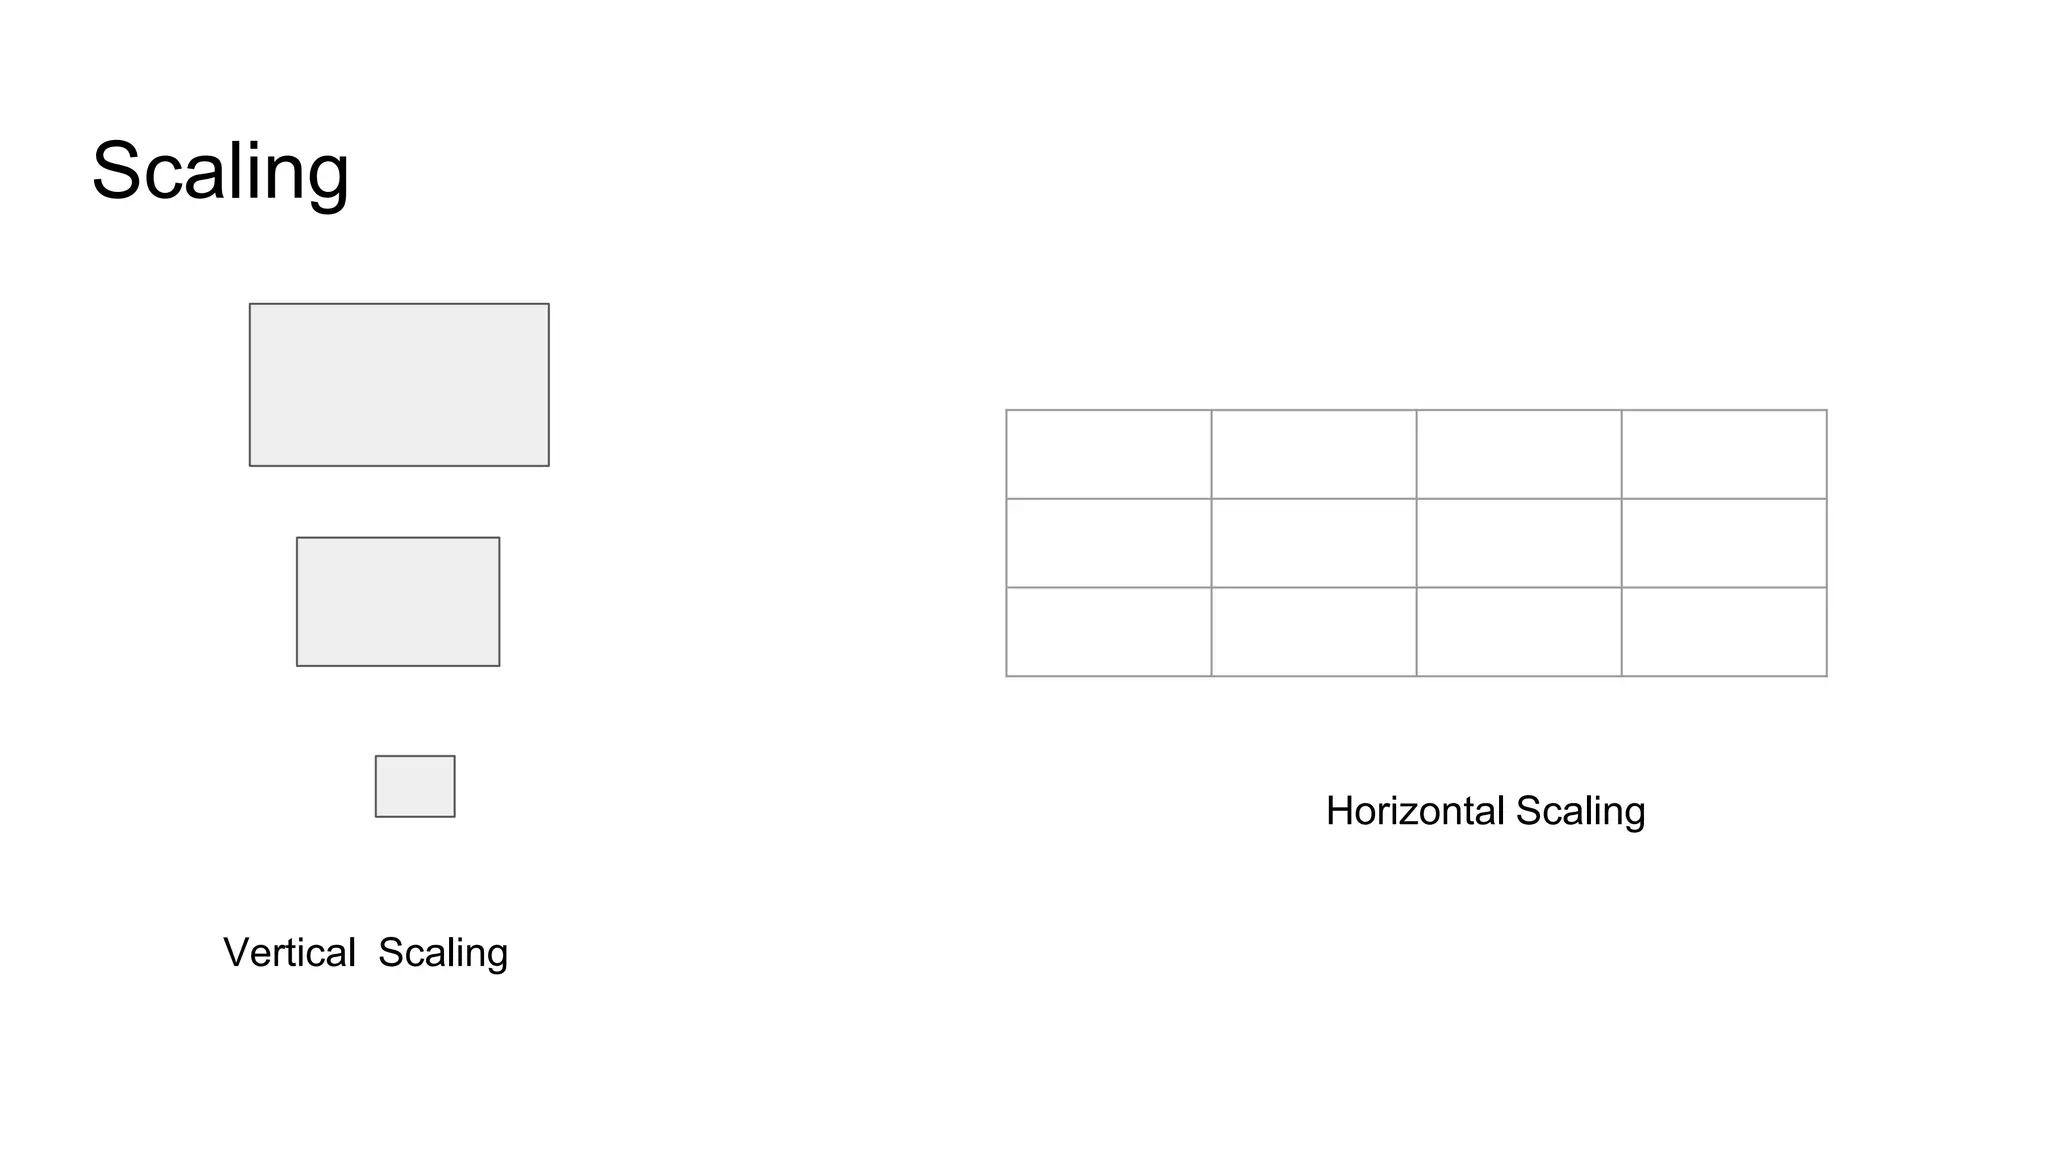
4) Addressing issues like scaling, cost, and clustering when analyzing exploratory data.
Exploratory data analysis data visualization:
Exploratory Data Analysis (EDA) is an approach/philosophy for data analysis that employs a variety of techniques (mostly graphical) to
Maximize insight into a data set.
Uncover underlying structure.
Extract important variables.
Detect outliers and anomalies.
Test underlying assumptions.
Develop parsimonious models.
Determine optimal factor settings
Missing data handling is typically done in an ad-hoc way. Without understanding the repurcussions of a missing data handling technique, approaches that only let you get to the "next step" in your analytics pipeline leads to terrible outputs, conclusions that aren't robust and biased estimates. Handling missing data in data sets requires a structured approach. In this workshop, we will cover the key tenets of handling missing data in a structured way
This presentation gives the idea about Data Preprocessing in the field of Data Mining. Images, examples and other things are adopted from "Data Mining Concepts and Techniques by Jiawei Han, Micheline Kamber and Jian Pei "
My presentation at The Richmond Data Science Community (Jan 2018). The slides are slightly different than what I had presented last year at The Data Intelligence Conference.
Exploratory data analysis is an approach consisting of tools that help you understand your data easily. These tools can be used with minimal knowledge of statistics.
EDA tools are presented here by The School of Continuous Improvement with the main purpose of anyone wanting to use these tools to be able to use them.
Exploratory Data Analysis - A Comprehensive Guide to EDA.pdfJamieDornan2
Exploratory Data Analysis is a method of examining and understanding data using multiple techniques like visualization, summary statistics and data transformation to abstract its core characteristics. EDA is done to get a sense of data and discover any potential problems or issues which need to be addressed and is generally performed before formal modeling or hypothesis testing.
Data Mining: Concepts and Techniques (3rd ed.)- Chapter 3 preprocessingSalah Amean
the chapter contains :
Data Preprocessing: An Overview,
Data Quality,
Major Tasks in Data Preprocessing,
Data Cleaning,
Data Integration,
Data Reduction,
Data Transformation and Data Discretization,
Summary.
Introduction to Statistical Machine Learningmahutte
This course provides a broad introduction to the methods and practice
of statistical machine learning, which is concerned with the development
of algorithms and techniques that learn from observed data by
constructing stochastic models that can be used for making predictions
and decisions. Topics covered include Bayesian inference and maximum
likelihood modeling; regression, classi¯cation, density estimation,
clustering, principal component analysis; parametric, semi-parametric,
and non-parametric models; basis functions, neural networks, kernel
methods, and graphical models; deterministic and stochastic
optimization; over¯tting, regularization, and validation.
Description of four techniques for Data Cleaning:
1.DWCLEANER Framework
2.Data Mining Techniques include Association Rule and Functional Dependecies
,...
UNIT V TEXT AND OPINION MINING
Text Mining in Social Networks -Opinion extraction – Sentiment classification and clustering -
Temporal sentiment analysis - Irony detection in opinion mining - Wish analysis – Product review mining – Review Classification – Tracking sentiments towards topics over time
Statistical Techniques for Processing & Analysis of Data Part 9.pdfAdebisiAdetayo1
the present book has been written with two clear objectives, viz., (i) to
enable researchers, irrespective of their discipline, in developing the most appropriate methodology
for their research studies; and (ii) to make them familiar with the art of using different researchmethods
and techniques. It is hoped that the humble effort made in the form of this book will assist in
the accomplishment of exploratory as well as result-oriented research studies.
Hypothesis on Different Data Mining AlgorithmsIJERA Editor
In this paper, different classification algorithms for data mining are discussed. Data Mining is about
explaining the past & predicting the future by means of data analysis. Classification is a task of data mining,
which categories data based on numerical or categorical variables. To classify the data many algorithms are
proposed, out of them five algorithms are comparatively studied for data mining through classification. There are
four different classification approaches namely Frequency Table, Covariance Matrix, Similarity Functions &
Others. As work for research on classification methods, algorithms like Naive Bayesian, K Nearest Neighbors,
Decision Tree, Artificial Neural Network & Support Vector Machine are studied & examined using benchmark
datasets like Iris & Lung Cancer.
Data Warehouses are structures with large amount of data collected from heterogeneous sources to be
used in a decision support system. Data Warehouses analysis identifies hidden patterns initially unexpected
which analysis requires great memory and computation cost. Data reduction methods were proposed to
make this analysis easier. In this paper, we present a hybrid approach based on Genetic Algorithms (GA)
as Evolutionary Algorithms and the Multiple Correspondence Analysis (MCA) as Analysis Factor Methods
to conduct this reduction. Our approach identifies reduced subset of dimensions p’ from the initial subset p
where p'<p where it is proposed to find the profile fact that is the closest to reference. Gas identify the
possible subsets and the Khi² formula of the ACM evaluates the quality of each subset. The study is based
on a distance measurement between the reference and n facts profile extracted from the warehouse.
Privacy preservation techniques in data miningeSAT Journals
Abstract In this paper different privacy preservation techniques are compared. Classification is the most commonly applied data mining technique, which employs a set of pre-classified examples to develop a model that can classify the population of records at large. Fraud detection and credit risk applications are particularly well suited to this type of analysis. This approach frequently employs decision tree or neural network-based classification algorithms. The data classification process involves learning and classification. In Learning the training data are analyzed by classification algorithm. In classification test data are used to estimate the accuracy of the classification rules. If the accuracy is acceptable the rules can be applied to the new data tuples . For a fraud detection application, this would include complete records of both fraudulent and valid activities determined on a record-by-record basis. The classifier-training algorithm uses these pre-classified examples to determine the set of parameters required for proper discrimination. The algorithm then encodes these parameters into a model called a classifier Index Terms: Data Mining, Privacy Preservation, Clustering, Classification Techniques, Naive Bayes.
IJRET : International Journal of Research in Engineering and Technology is an international peer reviewed, online journal published by eSAT Publishing House for the enhancement of research in various disciplines of Engineering and Technology. The aim and scope of the journal is to provide an academic medium and an important reference for the advancement and dissemination of research results that support high-level learning, teaching and research in the fields of Engineering and Technology. We bring together Scientists, Academician, Field Engineers, Scholars and Students of related fields of Engineering and Technology.
Literature Survey: Clustering TechniqueEditor IJCATR
Clustering is a partition of data into the groups of similar or dissimilar objects. Clustering is unsupervised learning
technique helps to find out hidden patterns of Data Objects. These hidden patterns represent a data concept. Clustering is used in many
data mining applications for data analysis by finding data patterns. There is a number of clustering techniques and algorithms are
available to cluster the data object. According to the type of data object and structure appropriate clustering technique is selected. This
survey focuses on the clustering techniques for their input attribute data type, their input parameters and output. The main objective is
not to understand the actual working of clustering technique. Instead, the input data requirement and input parameters of clustering
technique are focused.
Main points of this slide presentation:
1.What is statistics?
2.Application
3.Application of Statistics in Computer Science and Engineering
4.Machine learning’s Relation to statistics
5.Application of Statistics in Data mining
6.Data mining relation with Statistics
7.Outline of Applications
8.Some Outline of Application’s details are given below
Thank you
Bridging the Digital Gap Brad Spiegel Macon, GA Initiative.pptxBrad Spiegel Macon GA
Brad Spiegel Macon GA’s journey exemplifies the profound impact that one individual can have on their community. Through his unwavering dedication to digital inclusion, he’s not only bridging the gap in Macon but also setting an example for others to follow.
# Internet Security: Safeguarding Your Digital World
In the contemporary digital age, the internet is a cornerstone of our daily lives. It connects us to vast amounts of information, provides platforms for communication, enables commerce, and offers endless entertainment. However, with these conveniences come significant security challenges. Internet security is essential to protect our digital identities, sensitive data, and overall online experience. This comprehensive guide explores the multifaceted world of internet security, providing insights into its importance, common threats, and effective strategies to safeguard your digital world.
## Understanding Internet Security
Internet security encompasses the measures and protocols used to protect information, devices, and networks from unauthorized access, attacks, and damage. It involves a wide range of practices designed to safeguard data confidentiality, integrity, and availability. Effective internet security is crucial for individuals, businesses, and governments alike, as cyber threats continue to evolve in complexity and scale.
### Key Components of Internet Security
1. **Confidentiality**: Ensuring that information is accessible only to those authorized to access it.
2. **Integrity**: Protecting information from being altered or tampered with by unauthorized parties.
3. **Availability**: Ensuring that authorized users have reliable access to information and resources when needed.
## Common Internet Security Threats
Cyber threats are numerous and constantly evolving. Understanding these threats is the first step in protecting against them. Some of the most common internet security threats include:
### Malware
Malware, or malicious software, is designed to harm, exploit, or otherwise compromise a device, network, or service. Common types of malware include:
- **Viruses**: Programs that attach themselves to legitimate software and replicate, spreading to other programs and files.
- **Worms**: Standalone malware that replicates itself to spread to other computers.
- **Trojan Horses**: Malicious software disguised as legitimate software.
- **Ransomware**: Malware that encrypts a user's files and demands a ransom for the decryption key.
- **Spyware**: Software that secretly monitors and collects user information.
### Phishing
Phishing is a social engineering attack that aims to steal sensitive information such as usernames, passwords, and credit card details. Attackers often masquerade as trusted entities in email or other communication channels, tricking victims into providing their information.
### Man-in-the-Middle (MitM) Attacks
MitM attacks occur when an attacker intercepts and potentially alters communication between two parties without their knowledge. This can lead to the unauthorized acquisition of sensitive information.
### Denial-of-Service (DoS) and Distributed Denial-of-Service (DDoS) Attacks
Multi-cluster Kubernetes Networking- Patterns, Projects and GuidelinesSanjeev Rampal
Talk presented at Kubernetes Community Day, New York, May 2024.
Technical summary of Multi-Cluster Kubernetes Networking architectures with focus on 4 key topics.
1) Key patterns for Multi-cluster architectures
2) Architectural comparison of several OSS/ CNCF projects to address these patterns
3) Evolution trends for the APIs of these projects
4) Some design recommendations & guidelines for adopting/ deploying these solutions.
APNIC Foundation, presented by Ellisha Heppner at the PNG DNS Forum 2024APNIC
Ellisha Heppner, Grant Management Lead, presented an update on APNIC Foundation to the PNG DNS Forum held from 6 to 10 May, 2024 in Port Moresby, Papua New Guinea.
1.Wireless Communication System_Wireless communication is a broad term that i...JeyaPerumal1
Wireless communication involves the transmission of information over a distance without the help of wires, cables or any other forms of electrical conductors.
Wireless communication is a broad term that incorporates all procedures and forms of connecting and communicating between two or more devices using a wireless signal through wireless communication technologies and devices.
Features of Wireless Communication
The evolution of wireless technology has brought many advancements with its effective features.
The transmitted distance can be anywhere between a few meters (for example, a television's remote control) and thousands of kilometers (for example, radio communication).
Wireless communication can be used for cellular telephony, wireless access to the internet, wireless home networking, and so on.
This 7-second Brain Wave Ritual Attracts Money To You.!nirahealhty
Discover the power of a simple 7-second brain wave ritual that can attract wealth and abundance into your life. By tapping into specific brain frequencies, this technique helps you manifest financial success effortlessly. Ready to transform your financial future? Try this powerful ritual and start attracting money today!
2. Principles of Analytic Graphics
Principle 1 : Show comparison
Principle 2 : Show causality,mechanism,explanation.systematic structure
Principle 3 : Show multivariate data
Principle 4 : Integration Of the evidence
Principle 5 : Describe and document the evidences with the appropriate
labels,scales,sources etc
Principle 6 : Content is king
3. Graphs
● To understand the data property
● To find patterns
● To suggest modeling strategy
● To “debug” analysis
4. Characteristics of the exploratory data
● They are made quickly
● A large number can be made
● The goal is for the personal understanding
● Axes/legends are generally cleaned up(later)
● Color and the size are the primary information
7. > 2 dimensional plots
Co-plots
Spinning plots
Use of the color,size
8. Base plotting system
test ,lines,points,axis
These will be very convenient
Difficult to translate
Plot is just a series of the command
9. Lattice system
The plots are created with the specific function
Spacing and the margins are automatic only parameters(a lot in number) is to be
given here.
Panel plot are the different levels of the third variable.
10. The ggplot2 system
Splits the difference between base and the lattice in the number of ways
Automatically deals with the spacing,text,titles but also allows you to annotate
adding to a plot
Superficial similarity to lattice but generally easier/more intuitive to use