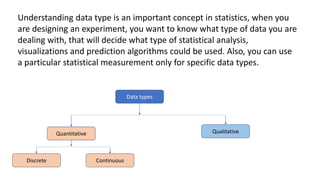
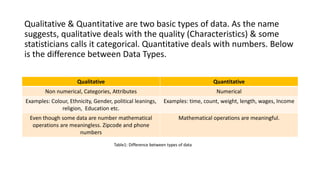
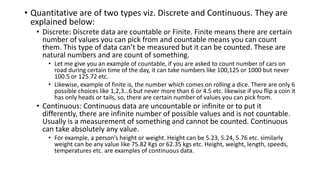
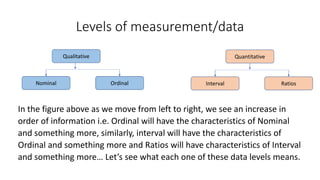
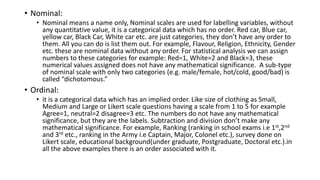
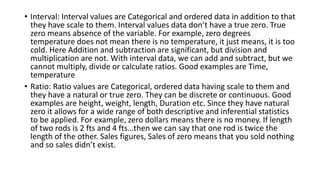
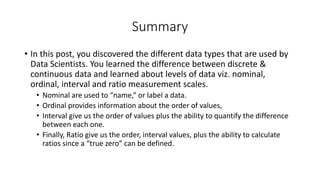
SlideShare a Scribd company logo
Four Types of Data
Data types
Quantitative Qualitative
Discrete Continuous
Understanding data type is an important concept in statistics, when you
are designing an experiment, you want to know what type of data you are
dealing with, that will decide what type of statistical analysis,
visualizations and prediction algorithms could be used. Also, you can use
a particular statistical measurement only for specific data types.
Qualitative & Quantitative are two basic types of data. As the name
suggests, qualitative deals with the quality (Characteristics) & some
statisticians calls it categorical. Quantitative deals with numbers. Below
is the difference between Data Types.
Qualitative Quantitative
Non numerical, Categories, Attributes Numerical
Examples: Colour, Ethnicity, Gender, political leanings,
religion, Education etc.
Examples: time, count, weight, length, wages, Income
Even though some data are number mathematical
operations are meaningless. Zipcode and phone
numbers
Mathematical operations are meaningful.
Table1: Difference between types of data
• Quantitative are of two types viz. Discrete and Continuous. They are
explained below:
• Discrete: Discrete data are countable or Finite. Finite means there are certain
number of values you can pick from and countable means you can count
them. This type of data can’t be measured but it can be counted. These are
natural numbers and are count of something.
• Let me give you an example of countable, if you are asked to count number of cars on
road during certain time of the day, it can take numbers like 100,125 or 1000 but never
100.5 or 125.72 etc.
• Likewise, example of finite is, the number which comes on rolling a dice. There are only 6
possible choices like 1,2,3…6 but never more than 6 or 4.5 etc. likewise if you flip a coin it
has only heads or tails, so, there are certain number of values you can pick from.
• Continuous: Continuous data are uncountable or infinite or to put it
differently, there are infinite number of possible values and is not countable.
Usually is a measurement of something and cannot be counted. Continuous
can take absolutely any value.
• For example, a person’s height or weight. Height can be 5.23, 5.24, 5.76 etc. similarly
weight can be any value like 75.82 Kgs or 62.35 kgs etc. Height, weight, length, speeds,
temperatures etc. are examples of continuous data.
Levels of measurement/data
QuantitativeQualitative
Interval RatiosNominal Ordinal
In the figure above as we move from left to right, we see an increase in
order of information i.e. Ordinal will have the characteristics of Nominal
and something more, similarly, interval will have the characteristics of
Ordinal and something more and Ratios will have characteristics of Interval
and something more… Let’s see what each one of these data levels means.
• Nominal:
• Nominal means a name only, Nominal scales are used for labelling variables, without
any quantitative value, it is a categorical data which has no order. Red car, Blue car,
yellow car, Black Car, White car etc. are just categories, they don’t have any order to
them. All you can do is list them out. For example, Flavour, Religion, Ethnicity, Gender
etc. these are nominal data without any order. For statistical analysis we can assign
numbers to these categories for example: Red=1, White=2 and Black=3, these
numerical values assigned does not have any mathematical significance. A sub-type
of nominal scale with only two categories (e.g. male/female, hot/cold, good/bad) is
called “dichotomous.”
• Ordinal:
• it is a categorical data which has an implied order. Like size of clothing as Small,
Medium and Large or Likert scale questions having a scale from 1 to 5 for example
Agree=1, neutral=2 disagree=3 etc. The numbers do not have any mathematical
significance, but they are the labels. Subtraction and division don’t make any
mathematical significance. For example, Ranking (ranking in school exams i.e 1st,2nd
and 3rd etc., ranking in the Army i.e Captain, Major, Colonel etc.), survey done on
Likert scale, educational background(under graduate, Postgraduate, Doctoral etc.).in
all the above examples there is an order associated with it.
• Interval: Interval values are Categorical and ordered data in addition to that
they have scale to them. Interval values data don’t have a true zero. True
zero means absence of the variable. For example, zero degrees
temperature does not mean there is no temperature, it just means, it is too
cold. Here Addition and subtraction are significant, but division and
multiplication are not. With interval data, we can add and subtract, but we
cannot multiply, divide or calculate ratios. Good examples are Time,
temperature
• Ratio: Ratio values are Categorical, ordered data having scale to them and
they have a natural or true zero. They can be discrete or continuous. Good
examples are height, weight, length, Duration etc. Since they have natural
zero it allows for a wide range of both descriptive and inferential statistics
to be applied. For example, zero dollars means there is no money. If length
of two rods is 2 fts and 4 fts…then we can say that one rod is twice the
length of the other. Sales figures, Sales of zero means that you sold nothing
and so sales didn’t exist.
Summary
• In this post, you discovered the different data types that are used by
Data Scientists. You learned the difference between discrete &
continuous data and learned about levels of data viz. nominal,
ordinal, interval and ratio measurement scales.
• Nominal are used to “name,” or label a data.
• Ordinal provides information about the order of values,
• Interval give us the order of values plus the ability to quantify the difference
between each one.
• Finally, Ratio give us the order, interval values, plus the ability to calculate
ratios since a “true zero” can be defined.

More Related Content

What's hot

Scales of measurement and presentation of data
Scales of measurement and presentation of dataScales of measurement and presentation of data
Scales of measurement and presentation of dataDr Sithun Kumar Patro
 
Descriptive statistics
Descriptive statisticsDescriptive statistics
Descriptive statisticsAttaullah Khan
 
Classification of data
Classification of dataClassification of data
Classification of dataligaya06
 
What is Statistics
What is StatisticsWhat is Statistics
What is Statisticssidra-098
 
Basic Statistics & Data Analysis
Basic Statistics & Data AnalysisBasic Statistics & Data Analysis
Basic Statistics & Data AnalysisAjendra Sharma
 
Introduction to Statistics (Part -I)
Introduction to Statistics (Part -I)Introduction to Statistics (Part -I)
Introduction to Statistics (Part -I)YesAnalytics
 
Descriptive statistics
Descriptive statisticsDescriptive statistics
Descriptive statisticsAileen Balbido
 
General Statistics boa
General Statistics boaGeneral Statistics boa
General Statistics boaraileeanne
 
Introduction to statistics
Introduction to statisticsIntroduction to statistics
Introduction to statisticsKapil Dev Ghante
 
Types of Statistics
Types of StatisticsTypes of Statistics
Types of Statisticsloranel
 
Types of variables in statistics
Types of variables in statisticsTypes of variables in statistics
Types of variables in statisticsZakaria Hossain
 
The Basics of Statistics for Data Science By Statisticians
The Basics of Statistics for Data Science By StatisticiansThe Basics of Statistics for Data Science By Statisticians
The Basics of Statistics for Data Science By StatisticiansStat Analytica
 
Statistics
StatisticsStatistics
Statisticsitutor
 
Introduction to statistics
Introduction to statisticsIntroduction to statistics
Introduction to statisticsScholarsPoint1
 
Inferential statistics
Inferential statisticsInferential statistics
Inferential statisticsAshok Kulkarni
 

What's hot (20)

Scales of measurement and presentation of data
Scales of measurement and presentation of dataScales of measurement and presentation of data
Scales of measurement and presentation of data
 
Univariate Analysis
Univariate AnalysisUnivariate Analysis
Univariate Analysis
 
Descriptive statistics
Descriptive statisticsDescriptive statistics
Descriptive statistics
 
Classification of data
Classification of dataClassification of data
Classification of data
 
Descriptive Statistics
Descriptive StatisticsDescriptive Statistics
Descriptive Statistics
 
What is Statistics
What is StatisticsWhat is Statistics
What is Statistics
 
Introduction to Descriptive Statistics
Introduction to Descriptive StatisticsIntroduction to Descriptive Statistics
Introduction to Descriptive Statistics
 
Basic Statistics & Data Analysis
Basic Statistics & Data AnalysisBasic Statistics & Data Analysis
Basic Statistics & Data Analysis
 
Types of Data
Types of DataTypes of Data
Types of Data
 
Introduction to Statistics (Part -I)
Introduction to Statistics (Part -I)Introduction to Statistics (Part -I)
Introduction to Statistics (Part -I)
 
Descriptive statistics
Descriptive statisticsDescriptive statistics
Descriptive statistics
 
General Statistics boa
General Statistics boaGeneral Statistics boa
General Statistics boa
 
Introduction to statistics
Introduction to statisticsIntroduction to statistics
Introduction to statistics
 
Types of Statistics
Types of StatisticsTypes of Statistics
Types of Statistics
 
Data
DataData
Data
 
Types of variables in statistics
Types of variables in statisticsTypes of variables in statistics
Types of variables in statistics
 
The Basics of Statistics for Data Science By Statisticians
The Basics of Statistics for Data Science By StatisticiansThe Basics of Statistics for Data Science By Statisticians
The Basics of Statistics for Data Science By Statisticians
 
Statistics
StatisticsStatistics
Statistics
 
Introduction to statistics
Introduction to statisticsIntroduction to statistics
Introduction to statistics
 
Inferential statistics
Inferential statisticsInferential statistics
Inferential statistics
 

Similar to Four data types Data Scientist should know

Categorical DataCategorical data represents characteristics..docx
Categorical DataCategorical data represents characteristics..docxCategorical DataCategorical data represents characteristics..docx
Categorical DataCategorical data represents characteristics..docxketurahhazelhurst
 
Data analysis for business decisions
Data analysis for business decisionsData analysis for business decisions
Data analysis for business decisionsMd Salman Ashrafi
 
Data And Variable In Scientific Research
Data And Variable In Scientific ResearchData And Variable In Scientific Research
Data And Variable In Scientific ResearchAswin Sarath
 
Presentation1.pptx
Presentation1.pptxPresentation1.pptx
Presentation1.pptxIndhuGreen
 
Basic statistics
Basic statisticsBasic statistics
Basic statisticsGanesh Raju
 
Introduction to Statistics in Nursing.
Introduction to Statistics in Nursing.Introduction to Statistics in Nursing.
Introduction to Statistics in Nursing.Johny Kutty Joseph
 
Scale of measurement
Scale of measurementScale of measurement
Scale of measurementHiral Anghan
 
Introduction to Data Analysis 1.pptx
Introduction to Data Analysis 1.pptxIntroduction to Data Analysis 1.pptx
Introduction to Data Analysis 1.pptxGeorgeGidudu
 
psychometrics ch 2 -2016.ppt
psychometrics ch 2 -2016.pptpsychometrics ch 2 -2016.ppt
psychometrics ch 2 -2016.pptDejeneDay
 
Basics of Educational Statistics (Variables and types)
Basics of Educational Statistics (Variables and types)Basics of Educational Statistics (Variables and types)
Basics of Educational Statistics (Variables and types)HennaAnsari
 
Sampling-A compact study of different types of sample
Sampling-A compact study of different types of sampleSampling-A compact study of different types of sample
Sampling-A compact study of different types of sampleAsith Paul.K
 
Chapter one Business statistics referesh
Chapter one Business statistics refereshChapter one Business statistics referesh
Chapter one Business statistics refereshYasin Abdela
 

Similar to Four data types Data Scientist should know (20)

Categorical DataCategorical data represents characteristics..docx
Categorical DataCategorical data represents characteristics..docxCategorical DataCategorical data represents characteristics..docx
Categorical DataCategorical data represents characteristics..docx
 
Data analysis for business decisions
Data analysis for business decisionsData analysis for business decisions
Data analysis for business decisions
 
Types of Data, Key Concept
Types of Data, Key ConceptTypes of Data, Key Concept
Types of Data, Key Concept
 
Data And Variable In Scientific Research
Data And Variable In Scientific ResearchData And Variable In Scientific Research
Data And Variable In Scientific Research
 
Measurementand scaling-10
Measurementand scaling-10Measurementand scaling-10
Measurementand scaling-10
 
Concept of measurement
Concept of measurementConcept of measurement
Concept of measurement
 
Presentation1.pptx
Presentation1.pptxPresentation1.pptx
Presentation1.pptx
 
Basic statistics
Basic statisticsBasic statistics
Basic statistics
 
Introduction to Statistics in Nursing.
Introduction to Statistics in Nursing.Introduction to Statistics in Nursing.
Introduction to Statistics in Nursing.
 
Scale of measurement
Scale of measurementScale of measurement
Scale of measurement
 
Statistical lechure
Statistical lechureStatistical lechure
Statistical lechure
 
Lecture # 03 measurement scales
Lecture # 03 measurement scalesLecture # 03 measurement scales
Lecture # 03 measurement scales
 
Introduction to Data Analysis 1.pptx
Introduction to Data Analysis 1.pptxIntroduction to Data Analysis 1.pptx
Introduction to Data Analysis 1.pptx
 
psychometrics ch 2 -2016.ppt
psychometrics ch 2 -2016.pptpsychometrics ch 2 -2016.ppt
psychometrics ch 2 -2016.ppt
 
Basics of Educational Statistics (Variables and types)
Basics of Educational Statistics (Variables and types)Basics of Educational Statistics (Variables and types)
Basics of Educational Statistics (Variables and types)
 
Mesurement & scaling- Sem Shaikh
Mesurement & scaling- Sem ShaikhMesurement & scaling- Sem Shaikh
Mesurement & scaling- Sem Shaikh
 
Sampling-A compact study of different types of sample
Sampling-A compact study of different types of sampleSampling-A compact study of different types of sample
Sampling-A compact study of different types of sample
 
Chapter one Business statistics referesh
Chapter one Business statistics refereshChapter one Business statistics referesh
Chapter one Business statistics referesh
 
week2 ba lects.pptx
week2 ba lects.pptxweek2 ba lects.pptx
week2 ba lects.pptx
 
EXPLAIN SPSS-part1.pdf
EXPLAIN SPSS-part1.pdfEXPLAIN SPSS-part1.pdf
EXPLAIN SPSS-part1.pdf
 

Recently uploaded

Students, digital devices and success - Andreas Schleicher - 27 May 2024..pptx
Students, digital devices and success - Andreas Schleicher - 27 May 2024..pptxStudents, digital devices and success - Andreas Schleicher - 27 May 2024..pptx
Students, digital devices and success - Andreas Schleicher - 27 May 2024..pptxEduSkills OECD
 
Telling Your Story_ Simple Steps to Build Your Nonprofit's Brand Webinar.pdf
Telling Your Story_ Simple Steps to Build Your Nonprofit's Brand Webinar.pdfTelling Your Story_ Simple Steps to Build Your Nonprofit's Brand Webinar.pdf
Telling Your Story_ Simple Steps to Build Your Nonprofit's Brand Webinar.pdfTechSoup
 
How to Manage Notification Preferences in the Odoo 17
How to Manage Notification Preferences in the Odoo 17How to Manage Notification Preferences in the Odoo 17
How to Manage Notification Preferences in the Odoo 17Celine George
 
How to Create Map Views in the Odoo 17 ERP
How to Create Map Views in the Odoo 17 ERPHow to Create Map Views in the Odoo 17 ERP
How to Create Map Views in the Odoo 17 ERPCeline George
 
Benefits and Challenges of Using Open Educational Resources
Benefits and Challenges of Using Open Educational ResourcesBenefits and Challenges of Using Open Educational Resources
Benefits and Challenges of Using Open Educational Resourcesdimpy50
 
Keeping Your Information Safe with Centralized Security Services
Keeping Your Information Safe with Centralized Security ServicesKeeping Your Information Safe with Centralized Security Services
Keeping Your Information Safe with Centralized Security ServicesTechSoup
 
How to Break the cycle of negative Thoughts
How to Break the cycle of negative ThoughtsHow to Break the cycle of negative Thoughts
How to Break the cycle of negative ThoughtsCol Mukteshwar Prasad
 
Instructions for Submissions thorugh G- Classroom.pptx
Instructions for Submissions thorugh G- Classroom.pptxInstructions for Submissions thorugh G- Classroom.pptx
Instructions for Submissions thorugh G- Classroom.pptxJheel Barad
 
MARUTI SUZUKI- A Successful Joint Venture in India.pptx
MARUTI SUZUKI- A Successful Joint Venture in India.pptxMARUTI SUZUKI- A Successful Joint Venture in India.pptx
MARUTI SUZUKI- A Successful Joint Venture in India.pptxbennyroshan06
 
Research Methods in Psychology | Cambridge AS Level | Cambridge Assessment In...
Research Methods in Psychology | Cambridge AS Level | Cambridge Assessment In...Research Methods in Psychology | Cambridge AS Level | Cambridge Assessment In...
Research Methods in Psychology | Cambridge AS Level | Cambridge Assessment In...Abhinav Gaur Kaptaan
 
Gyanartha SciBizTech Quiz slideshare.pptx
Gyanartha SciBizTech Quiz slideshare.pptxGyanartha SciBizTech Quiz slideshare.pptx
Gyanartha SciBizTech Quiz slideshare.pptxShibin Azad
 
Morse OER Some Benefits and Challenges.pptx
Morse OER Some Benefits and Challenges.pptxMorse OER Some Benefits and Challenges.pptx
Morse OER Some Benefits and Challenges.pptxjmorse8
 
Sha'Carri Richardson Presentation 202345
Sha'Carri Richardson Presentation 202345Sha'Carri Richardson Presentation 202345
Sha'Carri Richardson Presentation 202345beazzy04
 
aaaaaaaaaaaaaaaaaaaaaaaaaaaaaaaaaaaaaaaaa
aaaaaaaaaaaaaaaaaaaaaaaaaaaaaaaaaaaaaaaaaaaaaaaaaaaaaaaaaaaaaaaaaaaaaaaaaaaaaaaaaa
aaaaaaaaaaaaaaaaaaaaaaaaaaaaaaaaaaaaaaaaasiemaillard
 
Sectors of the Indian Economy - Class 10 Study Notes pdf
Sectors of the Indian Economy - Class 10 Study Notes pdfSectors of the Indian Economy - Class 10 Study Notes pdf
Sectors of the Indian Economy - Class 10 Study Notes pdfVivekanand Anglo Vedic Academy
 
2024_Student Session 2_ Set Plan Preparation.pptx
2024_Student Session 2_ Set Plan Preparation.pptx2024_Student Session 2_ Set Plan Preparation.pptx
2024_Student Session 2_ Set Plan Preparation.pptxmansk2
 
The impact of social media on mental health and well-being has been a topic o...
The impact of social media on mental health and well-being has been a topic o...The impact of social media on mental health and well-being has been a topic o...
The impact of social media on mental health and well-being has been a topic o...sanghavirahi2
 
How to Split Bills in the Odoo 17 POS Module
How to Split Bills in the Odoo 17 POS ModuleHow to Split Bills in the Odoo 17 POS Module
How to Split Bills in the Odoo 17 POS ModuleCeline George
 

Recently uploaded (20)

Students, digital devices and success - Andreas Schleicher - 27 May 2024..pptx
Students, digital devices and success - Andreas Schleicher - 27 May 2024..pptxStudents, digital devices and success - Andreas Schleicher - 27 May 2024..pptx
Students, digital devices and success - Andreas Schleicher - 27 May 2024..pptx
 
Telling Your Story_ Simple Steps to Build Your Nonprofit's Brand Webinar.pdf
Telling Your Story_ Simple Steps to Build Your Nonprofit's Brand Webinar.pdfTelling Your Story_ Simple Steps to Build Your Nonprofit's Brand Webinar.pdf
Telling Your Story_ Simple Steps to Build Your Nonprofit's Brand Webinar.pdf
 
How to Manage Notification Preferences in the Odoo 17
How to Manage Notification Preferences in the Odoo 17How to Manage Notification Preferences in the Odoo 17
How to Manage Notification Preferences in the Odoo 17
 
How to Create Map Views in the Odoo 17 ERP
How to Create Map Views in the Odoo 17 ERPHow to Create Map Views in the Odoo 17 ERP
How to Create Map Views in the Odoo 17 ERP
 
Benefits and Challenges of Using Open Educational Resources
Benefits and Challenges of Using Open Educational ResourcesBenefits and Challenges of Using Open Educational Resources
Benefits and Challenges of Using Open Educational Resources
 
Keeping Your Information Safe with Centralized Security Services
Keeping Your Information Safe with Centralized Security ServicesKeeping Your Information Safe with Centralized Security Services
Keeping Your Information Safe with Centralized Security Services
 
Introduction to Quality Improvement Essentials
Introduction to Quality Improvement EssentialsIntroduction to Quality Improvement Essentials
Introduction to Quality Improvement Essentials
 
How to Break the cycle of negative Thoughts
How to Break the cycle of negative ThoughtsHow to Break the cycle of negative Thoughts
How to Break the cycle of negative Thoughts
 
Instructions for Submissions thorugh G- Classroom.pptx
Instructions for Submissions thorugh G- Classroom.pptxInstructions for Submissions thorugh G- Classroom.pptx
Instructions for Submissions thorugh G- Classroom.pptx
 
MARUTI SUZUKI- A Successful Joint Venture in India.pptx
MARUTI SUZUKI- A Successful Joint Venture in India.pptxMARUTI SUZUKI- A Successful Joint Venture in India.pptx
MARUTI SUZUKI- A Successful Joint Venture in India.pptx
 
Research Methods in Psychology | Cambridge AS Level | Cambridge Assessment In...
Research Methods in Psychology | Cambridge AS Level | Cambridge Assessment In...Research Methods in Psychology | Cambridge AS Level | Cambridge Assessment In...
Research Methods in Psychology | Cambridge AS Level | Cambridge Assessment In...
 
NCERT Solutions Power Sharing Class 10 Notes pdf
NCERT Solutions Power Sharing Class 10 Notes pdfNCERT Solutions Power Sharing Class 10 Notes pdf
NCERT Solutions Power Sharing Class 10 Notes pdf
 
Gyanartha SciBizTech Quiz slideshare.pptx
Gyanartha SciBizTech Quiz slideshare.pptxGyanartha SciBizTech Quiz slideshare.pptx
Gyanartha SciBizTech Quiz slideshare.pptx
 
Morse OER Some Benefits and Challenges.pptx
Morse OER Some Benefits and Challenges.pptxMorse OER Some Benefits and Challenges.pptx
Morse OER Some Benefits and Challenges.pptx
 
Sha'Carri Richardson Presentation 202345
Sha'Carri Richardson Presentation 202345Sha'Carri Richardson Presentation 202345
Sha'Carri Richardson Presentation 202345
 
aaaaaaaaaaaaaaaaaaaaaaaaaaaaaaaaaaaaaaaaa
aaaaaaaaaaaaaaaaaaaaaaaaaaaaaaaaaaaaaaaaaaaaaaaaaaaaaaaaaaaaaaaaaaaaaaaaaaaaaaaaaa
aaaaaaaaaaaaaaaaaaaaaaaaaaaaaaaaaaaaaaaaa
 
Sectors of the Indian Economy - Class 10 Study Notes pdf
Sectors of the Indian Economy - Class 10 Study Notes pdfSectors of the Indian Economy - Class 10 Study Notes pdf
Sectors of the Indian Economy - Class 10 Study Notes pdf
 
2024_Student Session 2_ Set Plan Preparation.pptx
2024_Student Session 2_ Set Plan Preparation.pptx2024_Student Session 2_ Set Plan Preparation.pptx
2024_Student Session 2_ Set Plan Preparation.pptx
 
The impact of social media on mental health and well-being has been a topic o...
The impact of social media on mental health and well-being has been a topic o...The impact of social media on mental health and well-being has been a topic o...
The impact of social media on mental health and well-being has been a topic o...
 
How to Split Bills in the Odoo 17 POS Module
How to Split Bills in the Odoo 17 POS ModuleHow to Split Bills in the Odoo 17 POS Module
How to Split Bills in the Odoo 17 POS Module
 

Four data types Data Scientist should know

  • 2. Data types Quantitative Qualitative Discrete Continuous Understanding data type is an important concept in statistics, when you are designing an experiment, you want to know what type of data you are dealing with, that will decide what type of statistical analysis, visualizations and prediction algorithms could be used. Also, you can use a particular statistical measurement only for specific data types.
  • 3. Qualitative & Quantitative are two basic types of data. As the name suggests, qualitative deals with the quality (Characteristics) & some statisticians calls it categorical. Quantitative deals with numbers. Below is the difference between Data Types. Qualitative Quantitative Non numerical, Categories, Attributes Numerical Examples: Colour, Ethnicity, Gender, political leanings, religion, Education etc. Examples: time, count, weight, length, wages, Income Even though some data are number mathematical operations are meaningless. Zipcode and phone numbers Mathematical operations are meaningful. Table1: Difference between types of data
  • 4. • Quantitative are of two types viz. Discrete and Continuous. They are explained below: • Discrete: Discrete data are countable or Finite. Finite means there are certain number of values you can pick from and countable means you can count them. This type of data can’t be measured but it can be counted. These are natural numbers and are count of something. • Let me give you an example of countable, if you are asked to count number of cars on road during certain time of the day, it can take numbers like 100,125 or 1000 but never 100.5 or 125.72 etc. • Likewise, example of finite is, the number which comes on rolling a dice. There are only 6 possible choices like 1,2,3…6 but never more than 6 or 4.5 etc. likewise if you flip a coin it has only heads or tails, so, there are certain number of values you can pick from. • Continuous: Continuous data are uncountable or infinite or to put it differently, there are infinite number of possible values and is not countable. Usually is a measurement of something and cannot be counted. Continuous can take absolutely any value. • For example, a person’s height or weight. Height can be 5.23, 5.24, 5.76 etc. similarly weight can be any value like 75.82 Kgs or 62.35 kgs etc. Height, weight, length, speeds, temperatures etc. are examples of continuous data.
  • 5. Levels of measurement/data QuantitativeQualitative Interval RatiosNominal Ordinal In the figure above as we move from left to right, we see an increase in order of information i.e. Ordinal will have the characteristics of Nominal and something more, similarly, interval will have the characteristics of Ordinal and something more and Ratios will have characteristics of Interval and something more… Let’s see what each one of these data levels means.
  • 6. • Nominal: • Nominal means a name only, Nominal scales are used for labelling variables, without any quantitative value, it is a categorical data which has no order. Red car, Blue car, yellow car, Black Car, White car etc. are just categories, they don’t have any order to them. All you can do is list them out. For example, Flavour, Religion, Ethnicity, Gender etc. these are nominal data without any order. For statistical analysis we can assign numbers to these categories for example: Red=1, White=2 and Black=3, these numerical values assigned does not have any mathematical significance. A sub-type of nominal scale with only two categories (e.g. male/female, hot/cold, good/bad) is called “dichotomous.” • Ordinal: • it is a categorical data which has an implied order. Like size of clothing as Small, Medium and Large or Likert scale questions having a scale from 1 to 5 for example Agree=1, neutral=2 disagree=3 etc. The numbers do not have any mathematical significance, but they are the labels. Subtraction and division don’t make any mathematical significance. For example, Ranking (ranking in school exams i.e 1st,2nd and 3rd etc., ranking in the Army i.e Captain, Major, Colonel etc.), survey done on Likert scale, educational background(under graduate, Postgraduate, Doctoral etc.).in all the above examples there is an order associated with it.
  • 7. • Interval: Interval values are Categorical and ordered data in addition to that they have scale to them. Interval values data don’t have a true zero. True zero means absence of the variable. For example, zero degrees temperature does not mean there is no temperature, it just means, it is too cold. Here Addition and subtraction are significant, but division and multiplication are not. With interval data, we can add and subtract, but we cannot multiply, divide or calculate ratios. Good examples are Time, temperature • Ratio: Ratio values are Categorical, ordered data having scale to them and they have a natural or true zero. They can be discrete or continuous. Good examples are height, weight, length, Duration etc. Since they have natural zero it allows for a wide range of both descriptive and inferential statistics to be applied. For example, zero dollars means there is no money. If length of two rods is 2 fts and 4 fts…then we can say that one rod is twice the length of the other. Sales figures, Sales of zero means that you sold nothing and so sales didn’t exist.
  • 8. Summary • In this post, you discovered the different data types that are used by Data Scientists. You learned the difference between discrete & continuous data and learned about levels of data viz. nominal, ordinal, interval and ratio measurement scales. • Nominal are used to “name,” or label a data. • Ordinal provides information about the order of values, • Interval give us the order of values plus the ability to quantify the difference between each one. • Finally, Ratio give us the order, interval values, plus the ability to calculate ratios since a “true zero” can be defined.